


The MACD indicator, or Moving Average Convergence Divergence, is one of the most widely used tools in technical analysis. Designed to help identify trend changes and assess market momentum, this indicator simplifies price data into easy-to-read signals. Whether you’re a beginner exploring charts or an experienced trader looking to fine-tune your entries and exits, understanding the MACD can add value to your technical analysis. Developed by Gerald Appel in the late 1970s, the MACD combines simplicity with useful insights into price trends and momentum. Let’s break it down in the simplest terms and see how it works.
What is MACD Indicator?
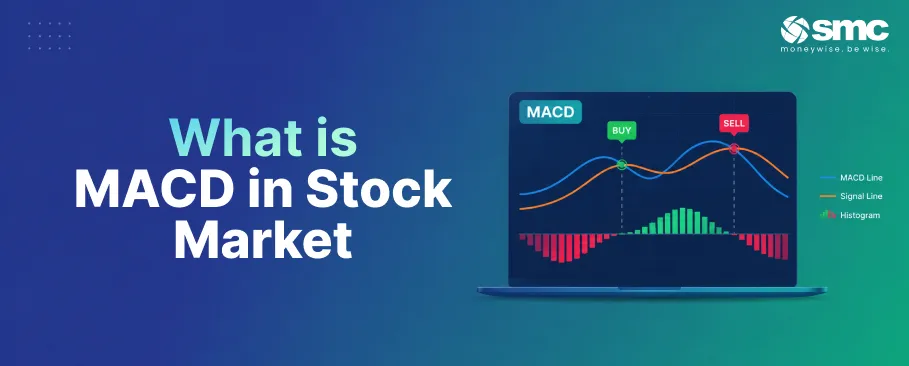
The MACD indicator is a technical analysis tool that measures the relationship between two exponential moving averages (EMAs) of a security’s price. The full form is Moving Average Convergence Divergence. It consists of three main components:
- MACD Line: This line is calculated by subtracting the 26-period EMA from the 12-period EMA. It helps indicate short-term momentum relative to the longer-term trend.
- Signal Line: A 9-period EMA of the MACD line; it is used to identify potential bullish or bearish signals.
- Histogram: The histogram represents the difference between the MACD line and the signal line. It provides a visual representation of changes in momentum and can help identify potential trend shifts.
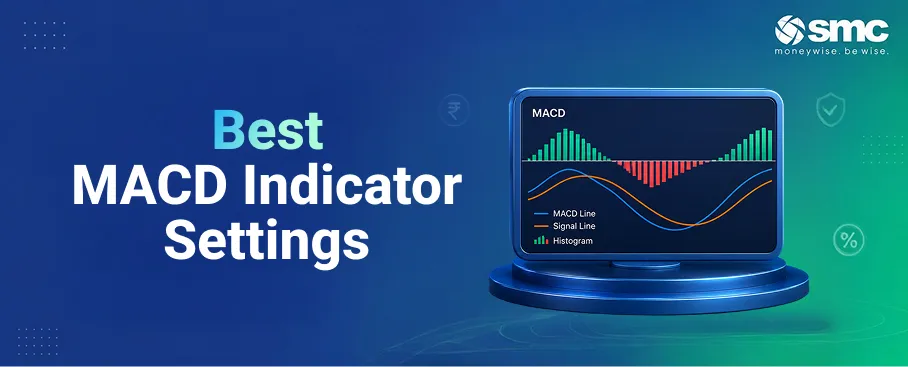
The standard MACD settings are 12, 26 and 9, although traders may adjust these parameters depending on their trading style and time frame.
The MACD indicator is widely used due to its simplicity and ability to provide insights into both trend direction and momentum.
How Does the MACD Indicator Work?
The MACD indicator compares two EMAs to assess changes in momentum and trend direction:
Convergence: When the 12s-period and 26-period EMAs move closer together, the MACD line moves towards zero, indicating that the difference between the two averages is narrowing.
Divergence: When the two EMAs move farther apart, the MACD line moves farther from zero, indicating that the difference between the averages is widening.
When the MACD line crosses above the signal line, it may indicate increasing bullish momentum. Conversely, when the MACD line crosses below the signal line, it may indicate increasing bearish momentum.
The histogram helps traders visualise changes in momentum. A histogram moving higher generally indicates improving momentum, while a histogram moving lower indicates weakening momentum. The direction and whether it is above or below zero should be considered together.
Interpreting MACD Signals
Understanding how to interpret the signals generated by the MACD indicator is important for effective technical analysis:
1. MACD Line and Signal Line Crossovers:
- Bullish Crossover: When the MACD line crosses above the signal line, it suggests increasing upward momentum and may indicate a potential bullish signal.
- Bearish Crossover: When the MACD line crosses below the signal line, it suggests increasing downward momentum and may indicate a potential bearish signal.
2. Zero Line Crossovers:
- MACD Above Zero: Indicates that the 12-period EMA is above the 26-period EMA, suggesting relatively stronger bullish momentum.
- MACD Below Zero: Indicates that the 12-period EMA is below the 26-period EMA, suggesting relatively stronger bearish momentum.
3. Divergence:
- Bullish Divergence: Occurs when price makes a new low while the MACD forms a higher low. This can signal that downward momentum is weakening and a potential upward reversal may be developing.
- Bearish Divergence: Occurs when price makes a new high while the MACD forms a lower high. This can indicate weakening upward momentum and a potential downward reversal.
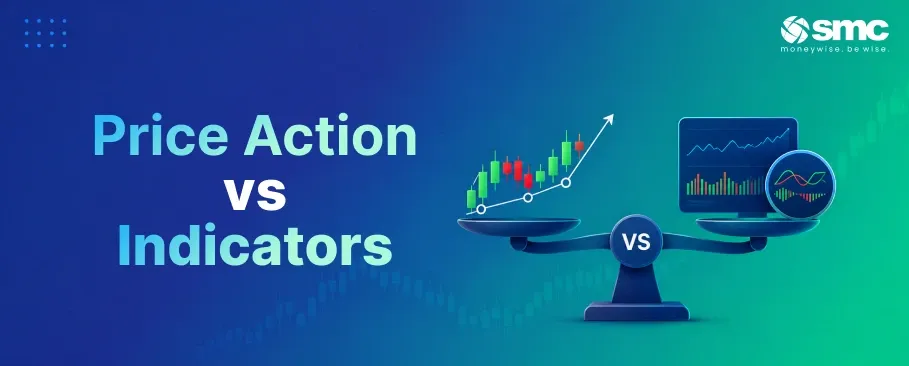
MACD signals should not be considered guarantees of future price movements. Traders often combine them with price action and other technical indicators for confirmation.
Advantages of Using the MACD Indicator
The MACD indicator (short for Moving Average Convergence Divergence) is widely used by traders for its simplicity and ability to provide insights into trend and momentum.
Simplicity
One of the biggest advantages of the MACD indicator is that it’s easy to understand, even if you’re new to trading. The MACD uses crossovers, the zero line and the histogram to make changes in momentum easier to interpret.
Versatility
Whether you’re trading stocks, currencies, commodities, or cryptocurrencies, the MACD indicator can be applied across different asset classes and time frames. Traders can use it on intraday, daily, weekly or monthly charts depending on their trading approach.
Combines Trend and Momentum
Many indicators focus mainly on trend direction or momentum. The MACD provides insights into both, helping traders assess the direction and strength of price momentum.
Potential Reversal Signals
Divergences between price movement and the MACD can sometimes indicate that the existing trend is losing momentum. These signals can help traders identify potential trend changes, though they should ideally be confirmed with other technical indicators.
Limitations of the MACD Indicator
While the MACD indicator is useful, it’s not without its limitations. Here are some key points to keep in mind:
Lagging Indicator
Since the MACD is based on moving averages, it can react after a price trend has already started. This may result in delayed entry or exit signals.
False Signals in Sideways Markets
In choppy or range-bound markets, the MACD can produce multiple crossovers and misleading signals, leading to unnecessary trades.
Not Ideal for All Market Conditions
The MACD tends to be more useful when a market has a clear trend. In sideways markets, its signals may be less reliable.
Understanding these limitations can help traders use the MACD more effectively and avoid relying on a single indicator.
Practical Application of the MACD Indicator
The MACD indicator can help traders assess market momentum and potential trend changes, but it works best as part of a broader trading strategy. Here’s how you can use it:
1. Combine with Other Indicators
Don’t rely solely on the MACD indicator. Pair it with other tools, such as the Relative Strength Index (RSI) or moving averages, to confirm the trend direction and reduce the chances of acting on false signals.
2. Choose a Suitable Time Frame
The standard MACD settings of 12, 26 and 9 can be used as a starting point. Traders may use different time frames, such as 5-minute, 15-minute, daily or weekly charts, depending on their trading style and objectives.
3. Watch for Divergences
A divergence between the MACD and price chart can provide an early warning that momentum may be changing. For example, if the price makes higher highs while the MACD makes lower highs, it may indicate weakening upward momentum.
4. Use Risk-Management Tools
MACD signals can be false, so proper risk management is important. Depending on the trading strategy, traders may use tools such as stop-loss orders and position sizing to manage potential losses.
In short, the MACD indicator can become more useful when combined with other technical tools, appropriate time frames and sound risk-management practices.
Conclusion
The MACD indicator, or Moving Average Convergence Divergence, is a widely used technical analysis tool that helps traders assess trend direction and momentum. By understanding its components, crossovers, zero-line movements and divergences, traders can use MACD as part of their broader market analysis.
However, no single indicator can predict market movements with certainty. Combining MACD signals with other technical tools and appropriate risk-management practices can help traders make more informed decisions.





 1800 11 0909
 smc.care@smctradeonline.com