
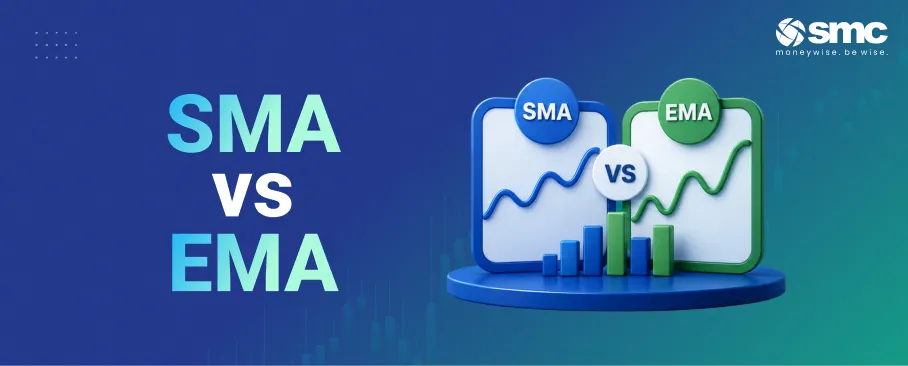


Moving averages are technical indicators that smooth price data to make the direction of a stock or index easier to see. A Simple Moving Average (SMA) gives equal weight to every price in the selected period, while an Exponential Moving Average (EMA) gives greater weight to recent prices and therefore reacts faster. Both are lagging indicators, so they confirm trends based on past prices rather than predict where the market will move next.
Traders use moving averages to identify trend direction, spot crossovers, and track dynamic support and resistance across different timeframes. In this blog, we'll compare SMA and EMA, explain how each is calculated, look at common moving-average trading methods, and cover where these indicators can give misleading signals.
What is a moving average?
A moving average smooths out a price series by averaging closing prices over a set number of days, then updating that average as each new day's price comes in. Instead of reacting to a single spike or dip, you get a cleaner line that reflects the underlying direction.
Both the simple moving average and the exponential moving average are lagging indicators. They are built entirely from past prices, so they confirm a trend rather than predict one. India's NISM research analyst material treats both as trend-confirmation tools, kept separate from momentum indicators such as the RSI. That is worth remembering before you lean on any moving average to call an exact top or bottom.
How a simple moving average (SMA) works
A simple moving average adds up the closing prices over your chosen period and divides by the number of days. Every day carries equal weight.
Take a five-day example:
If a stock closes at ₹100, ₹102, ₹101, ₹103 and ₹104, the five prices add up to ₹510, so the five-day SMA is ₹102. The next day, you drop the oldest price and add the newest close, then recalculate. Because every close counts the same, the SMA is smooth and steady, which also means it can be slow to react when the price turns sharply.
How an exponential moving average (EMA) works
The exponential moving average takes a different approach. It gives more weight to recent prices and less to older ones, so it hugs the current price more closely. It does this with a smoothing multiplier, worked out as 2 ÷ (n + 1), where n is your chosen period. A 10-day EMA, for instance, uses a multiplier of about 0.18.
The calculation builds on the previous day's value: today's EMA = (multiplier × today's close) + ((1 - multiplier) × yesterday's EMA). If yesterday's 10-day EMA was ₹100 and today's close is ₹105, today's EMA works out to about ₹100.91. The series is seeded with a simple moving average for its first reading, then rolls forward on its own.
SMA vs EMA: which one reacts faster
The key difference between an SMA and an EMA is how quickly they respond to new price data. Because an EMA gives more weight to recent prices, it reacts faster to changes in direction than an SMA of the same period. An SMA moves more gradually because every price in the calculation carries equal weight.
That faster response makes the EMA useful for spotting earlier changes in trend, but also more sensitive to short-term volatility and false signals. An SMA filters out more of that noise, though it can react later when the trend changes. Traders often use a faster EMA for early signals and a slower SMA to confirm the broader direction.
How to trade with moving averages
Moving averages are commonly used in three ways: to spot crossovers, confirm trend direction, and identify dynamic support or resistance.
- Crossovers: When a shorter moving average crosses above a longer one, such as the 50-day moving average above the 200-day, traders call it a golden cross and usually read it as bullish. The reverse, known as a death cross, is considered bearish. SEBI's investor education material highlights the 50-day and 200-day averages as a classic pair for gauging trend direction. Because the crossover occurs after the price has already moved, it is better treated as confirmation than as a prediction.
- Trend confirmation: An upward-sloping moving average supports an uptrend, while a downward-sloping one supports a downtrend. When daily, weekly, and monthly averages point in the same direction, the broader trend signal is stronger.
- Dynamic support and resistance: In an uptrend, price may pull back toward a rising moving average and bounce. In a downtrend, a falling average can act as resistance, limiting rallies.
Common settings include the 20-day SMA, the 12-day and 26-day EMAs used in MACD, and the 50-day and 200-day averages for longer-term trends. These are reference points, not guaranteed trading rules. One long-horizon Nifty 50 study covering 2010 to 2022 found that a mechanical 50-day/200-day crossover strategy returned 4.01% annually versus 9.90% for buy-and-hold, though with lower volatility.
Where moving averages can mislead you
No indicator is foolproof, and moving averages have clear blind spots.
In sideways, range-bound markets, crossovers tend to whipsaw, producing false signals that rack up trading costs with little to show for it. Indian academic studies on moving-average rules echo this finding, showing that gross gains often shrink or disappear once real-world transaction costs are accounted for. This is why many traders treat moving averages as one input among several rather than a system on their own.
Corporate actions such as bonus issues and stock splits can mechanically change a stock's price without representing an economic gain or loss. Using adjusted price data helps ensure that moving averages are not distorted by these changes.
Conclusion
Moving averages give you a straightforward way to read trend and direction without getting lost in daily price swings. The simple moving average remains steady, while the exponential moving average reacts faster; most traders combine the two rather than picking a side. Use them to read context and confirm any signal with other tools, keeping the built-in lag in mind.
When you are ready to put this into practice, you can open a demat account with SMC and start applying these ideas on live charts.
Investments in securities markets are subject to market risks. Read all the related documents carefully before investing.



 1800 11 0909
 smc.care@smctradeonline.com