
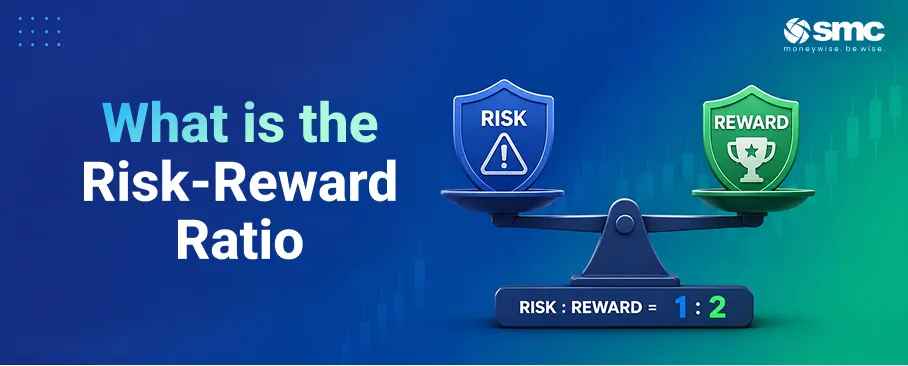


Profitable trading has less to do with how often you are right and more to do with how your wins and losses are sized. The risk-reward ratio captures exactly that: how much you put at risk against how much you stand to gain on each trade. Get this relationship right, and you can be wrong more often than you are right and still make money; get it wrong and a high win rate won't save you.
The sections below explain how the risk-reward ratio works, how to calculate it, why it matters more than win rate alone, and how it shapes position sizing and trade management.
What is the Risk-Reward Ratio
The risk-reward ratio compares the distance from your entry to your stop-loss (the risk) with the distance from your entry to your take-profit target (the reward). If you buy at 50, set a stop at 47 (risking 3 per share), and target 56 (a reward of 6 per share), the reward-to-risk ratio is 2:1.
Two notation conventions exist:
- Some sources write it as reward: risk (target ÷ risk), where 2:1 means the reward is twice the risk.
- Others write it as risk: reward (risk ÷ target), where 1:2 says the same thing.
The principle is identical either way: quantify how many units of profit you expect for each unit of loss.
Why Professionals Prioritise R:R Over Win Rate
Trading expectancy, the average profit or loss per trade over a large sample, depends on both the win rate and the payoff size, not on win rate alone.
The expectancy formula: E = (Win Rate × Average Win) − (Loss Rate × Average Loss)
Because R:R directly shapes your average win versus your average loss, you can be profitable with a low win rate if the winners are materially larger than the losers. A system with a 45% win rate, average wins of ₹400, and average losses of ₹250 still generates a positive expectancy of ₹42.50 per trade. A high win rate, on the other hand, becomes meaningless if the losses dwarf the wins when they occur.
Professionals design setups around a solid R:R first, then check whether the combination of R:R and win rate yields positive expectancy, rather than chasing accuracy for its own sake.
Common Risk-Reward Ratios Used in Markets
Educational resources highlight 1:2 and 1:3 as baseline thresholds that support positive expectancy at moderate win rates. Many treat 1:3 as a favoured benchmark for stock and derivatives trades because it provides a buffer against the inevitable losing streaks.
Indian equity trading guides similarly recommend using a 1:2 or 1:3 ratio when setting stop-loss and target levels, especially when using tools like ATR and support-resistance to anchor those levels.
Advanced traders vary R:R widely, from tight 1:1 scalps in highly liquid instruments to 1:4-1:5 asymmetric positions around event catalysts. Still, the principle holds: the strategy's long-run expectancy must be positive.
How to Calculate the Risk-Reward Ratio
Identifying Entry, Stop-Loss, and Target
The risk-reward ratio is based on three key price levels: your entry, stop-loss, and target.
- Entry: Determined by your trading strategy, such as a breakout above resistance, a pullback to support, or confirmation from indicators like VWAP or moving averages.
- Stop-loss: Placed where the trade setup is no longer valid, typically below key support for long positions or above resistance for short positions.
- Target: Set at a realistic price objective, such as a previous swing high, a measured move, or the next major support or resistance level.
Together, these three levels define the potential risk and reward for the trade and form the basis of the risk-reward ratio.
Formula and Worked Examples
Reward:Risk = Potential Profit ÷ Potential Loss
Risking 50 to gain 150 produces a reward-to-risk of 3:1. Expressed as a fraction (risk ÷ reward), the same trade is 0.33, or 1:3.
Example 1: You buy a stock at ₹500, place a stop at ₹485 (risk = ₹15 per share), and target ₹545 (reward = ₹45 per share). Reward:risk = 45 ÷ 15 = 3:1.
Example 2: Entry at ₹120, stop at ₹114 (risk = ₹6), target at ₹132 (reward = ₹12). Reward:risk = 12 ÷ 6 = 2:1.
The maths is the same across instruments and markets. What changes is how you derive the three price levels, which is where chart structure and volatility come in.
Using Charts and Price Levels for Accuracy
Chart-based planning aligns your stops and targets with real market structure, swing highs and lows, support-resistance zones, supply-demand areas, rather than arbitrary offsets from entry.
A sound approach: decide on technically valid stop locations first, then size the position so the monetary risk fits within a fixed percentage of account equity. Volatility indicators like ATR can calibrate this further, with stops placed around 1.5-2× the 14-period ATR to reduce noise stop-outs while keeping risk disciplined.
Once stops and targets are anchored to structure and volatility, R:R becomes a realistic reflection of likely trade behaviour rather than a theoretical number disconnected from the market.
Why Risk-Reward Matters More Than Accuracy
Probability vs. Profitability
Expectancy combines win rate and R:R into a single number: the average gain or loss per trade over time. A system that wins 45% of the time with ₹400 average wins and ₹250 average losses produces positive expectancy, despite losing more often than it wins.
If the average loss creeps up, say, from ₹250 to ₹350 due to undisciplined stop-moving, expectancy can flip negative at the same win rate. Poor R:R management destroys strategies that are otherwise sound.
How Low Win-Rate Strategies Remain Profitable
A trader with a 30% win rate can still profit if R:R is consistently 1:4. Over 10 trades: 3 winners at 4 units each (+12), 7 losers at 1 unit each (−7), net result = +5 units. You are wrong 70% of the time and still come out ahead.
At 3:1 reward-to-risk, break-even sits at roughly 25% accuracy: one winner making 3 units offsets three losers at 1 unit each. Asymmetric payoffs compensate for low accuracy in a way that high accuracy with poor R:R cannot.
The reverse is just as instructive. If you risk 2 to make 1, you need a win rate above 67% just to break even. In volatile markets, sustaining that accuracy is unrealistic, and when it slips, drawdowns accelerate.
Trader Psychology and Disciplined Execution
Many traders gravitate toward high win rates because being "right" feels good. But that instinct tempts you to cut winners early, let losers run, or move stops further away, all of which compress your realised R:R.
Risk-management thinking treats losses as a normal cost of doing business in a probabilistic game. Even a solid positive-expectancy strategy will produce runs of consecutive losses. The professional response is process adherence: follow the plan, log your trades, hold your R:R. Patience and acceptance of frequent small losses are what let you exploit favourable R:R over a large sample.
How Professional Traders Set Risk-Reward Levels
Support and Resistance-Based Targeting
A common workflow: locate major support and resistance, place the stop just beyond the invalidation zone, and set the target near the next structural level where supply or demand is likely to appear.
For a long breakout above resistance, the stop goes just below the broken level (now expected to act as support), while the target sits near the next higher resistance or a measured-move objective.
Avoid choosing stops and targets solely to produce an attractive numerical ratio when the levels lack structural support. Even a good-looking 1:3 setup offers no real edge if the stop is at an arbitrary price and the target sits in an area with no meaningful market context.
Volatility and ATR-Based Risk Planning
ATR measures the average true range of price movement over a lookback period and is used to scale stop distances to current volatility.
- Long position: Stop = Entry − (ATR × multiplier)
- Short position: Stop = Entry + (ATR × multiplier)
Common multipliers are 1.5-2× for shorter-term trades, higher for trend-following. Once the ATR-derived stop distance is known, position size is calculated as:
Position Size = (Account Capital × Risk %) ÷ Stop Distance
This keeps the monetary risk per trade within a fixed percentage (commonly 1-2%), even as volatility shifts.
Adjusting Ratios Based on Market Conditions
Rigid, one-size-fits-all R:R rules (always demanding 1:3, for instance) can hurt performance. In trending markets, trailing mechanisms let winners extend beyond the initial target, improving realised R:R. In choppy conditions, tighter stops and closer targets reflect smaller average swings.
The adjustment principle: adapt to the instrument, timeframe, and regime, but always confirm that expectancy remains positive after accounting for win rate, spreads, and slippage.
Risk-Reward Ratio Across Trading Styles
Intraday Trading
Day trading captures short-term price moves within a single session. Stops are tighter in absolute terms, anchored to intraday levels such as VWAP, previous session highs/lows, and short-term support/resistance. Target ratios are commonly 1:2 or 1:3.
Because leverage is often higher intraday and the noise more intense, keeping a fixed percentage risk per trade (1% of account value, for example) and realistic R:R expectations is critical.
Swing Trading
Swing traders hold for several days to weeks, seeking larger moves between key support and resistance zones. Stops are wider than intraday to accommodate overnight gaps and multi-day pullbacks.
Daily and 4-hour charts typically define stops and targets, sometimes combined with ATR-based volatility buffers. Fewer trades, but potentially higher reward per trade than intraday.
Positional and Long-Term Trading
Positional traders hold for weeks to months, relying on macro trends and long-term technical structure. Stops sit below major weekly or monthly support for longs, with R:R planned around major trend legs or valuation targets.
The emphasis shifts from per-trade R:R to portfolio-level risk management, limiting position size and maintaining diversification so that any single trade's downside, even with a wide stop, does not jeopardise long-run capital.
Common Mistakes Traders Make with Risk-Reward
Moving Stop-Losses Emotionally
- Shifting a stop further away to avoid taking a loss increases the average loss size and worsens realised R:R.
- Even a modest increase in average loss (from ₹250 to ₹350 while keeping the average win constant) can flip a profitable system to a losing one.
- Every rule-based stop-out is a planned business expense. The mistake lies in failing to honour the pre-defined exit; the loss itself is simply a cost of trading.
Chasing Unrealistic Reward Targets
Forcing high ratios by setting distant targets that price rarely reaches leads to many small losses and few realised winners. A large theoretical R:R does not justify entering poor setups or ignoring the probability that the price will actually reach the target.
Over-optimistic targets can also make you reject solid trades with slightly lower R:R (say 1:2.5 instead of 1:3.5) that might, in practice, deliver better expectancy and a smoother equity curve.
Ignoring Position Sizing
An attractive per-trade R:R is only half of risk management. You must also limit the fraction of equity risked per trade, commonly 1-2%, to survive the inevitable drawdowns.
Position-sizing formulas that tie trade size to stop distance and account capital ensure that wider stops in volatile markets don't accidentally magnify your monetary risk beyond acceptable levels. Another common error is evaluating R:R in isolation without computing the expected value over a sufficiently large sample. A trade journal and expectancy calculator help you quantify whether the combined statistics produce a sustainable edge, which is what matters, not any single trade's outcome.
Investments in securities markets are subject to market risks. Read all the related documents carefully before investing.
Conclusion
The risk-reward ratio is the single variable that lets you profit even when you are wrong more often than you are right. It is not about predicting every move correctly; it is about sizing your wins bigger than your losses and holding that discipline across a large number of trades. Anchor your stops and targets to real market structure, keep your per-trade risk to a fixed percentage, and let expectancy, not any one trade, be your scoreboard. When you're ready to put this approach into practice, open a free Demat account with SMC and use its charts and trading tools to map your risk and reward before entering a trade.


 1800 11 0909
 smc.care@smctradeonline.com