
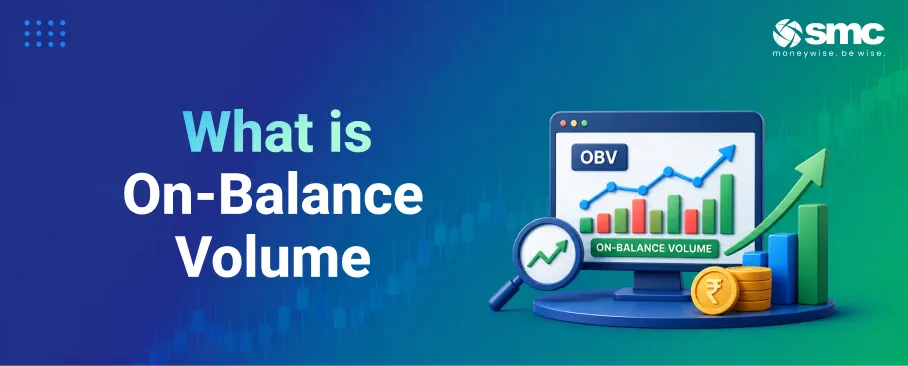


On-Balance Volume (OBV) is a cumulative, volume-based momentum indicator: it adds a session's trading volume to a running total on up-close days. It subtracts it on down-close days to measure the buying and selling pressure behind price moves.
Joseph Granville introduced OBV in his 1963 book Granville's New Key to Stock Market Profits, arguing that volume shifts often precede price moves. OBV works across equities, commodities, and futures wherever reliable volume data exists. The absolute number OBV prints is irrelevant; what matters is the direction, slope, and pattern of the OBV line relative to price, which can signal accumulation or distribution before it shows up in price action.
In this blog, we'll look at how OBV works, how to calculate and interpret it, the main OBV trading strategies, and where the indicator falls short.
How OBV Works
The Origins and Core Logic
Granville's central argument was that volume often leads price: a significant shift in volume without an equivalent price reaction builds pressure that eventually drives a large directional move. He first applied OBV to equities, but the concept extends to any market with reliable volume data, including futures and commodity contracts.
The three core purposes of OBV are:
- Detect accumulation or distribution phases before they appear in price trends
- Confirm whether an existing trend is backed by strong participation
- Anticipate breakouts or reversals when OBV diverges from price
Why Volume Matters in Technical Analysis
Volume reflects how much conviction sits behind a price move. High-volume moves tend to be more durable; low-volume moves fail more often. Technicians use volume in three main ways:
- Confirm breakouts: A price break above resistance on rising volume signals conviction behind the move.
- Validate trends: Sustained uptrends usually show more volume on up days than on down days.
- Identify exhaustion: Price pushing higher on declining volume can signal weakening demand and a potential reversal.
In markets with heavy institutional participation, such as large-cap equities, OBV is especially revealing, because institutional order flow is large enough to shift cumulative volume patterns before price reacts.
How OBV Is Calculated
OBV updates a cumulative running total each session, based on the current close versus the previous close:
- If today's close is higher than yesterday's, add today's volume to the previous OBV.
- If today's close is lower than yesterday's, subtract today's volume from the previous OBV.
- If today's close equals yesterday's, OBV stays unchanged.
Because OBV is cumulative, its numeric scale depends entirely on the starting point and the length of history. Chart platforms typically start from zero, and only the relative movement of OBV matters. A rising OBV line indicates net accumulation (more volume on up days); a falling line signals net distribution (more volume on down days).
Interpreting Buying and Selling Pressure
OBV treats a session's total volume as net buying pressure when the close is higher than the previous close and as net selling pressure when it is lower. This is an assumption, not a precise measure, but over time it produces a useful directional proxy.
A rising OBV without an equivalent price advance is usually read as stealth accumulation, institutional players building positions gradually without pushing price up immediately. Falling OBV without major price declines can indicate stealth distribution. Both patterns can foreshadow a trend move when price eventually catches up to the volume.
OBV Trading Strategies
Breakout Confirmation Strategy
This is the most widely used OBV application. The process:
- Identify a consolidation range or chart pattern with well-defined support and resistance.
- Watch OBV for a break of its own corresponding resistance or support level alongside price.
- Enter when price closes beyond the range boundary with OBV confirming the move.
- Set the stop-loss at the broken support or resistance zone.
- Measure the target from the height of the prior consolidation range.
OBV acts as a filter here. Breakouts where OBV fails to confirm are skipped, which reduces exposure to whipsaws. Some traders also require the broader OBV trend to align with the trade direction before entry.
Divergence Trading
Divergence strategies aim to anticipate turning points when price and volume flow move in opposite directions. On-balance volume divergence is one of OBV's most-watched signals.
For bullish divergence setups:
- Price prints successive lower lows in a downtrend.
- OBV forms higher lows, signalling that selling pressure is weakening.
- Entry is taken on confirmation, a break above a descending trendline or recent swing high.
- The stop is placed below the most recent swing low.
For bearish divergence setups:
- Price makes higher highs in an uptrend.
- OBV forms lower highs, indicating that buying pressure is fading.
- Entry is taken on confirmation of a price-reversal signal.
- The stop is placed above the most recent swing high.
Divergence works best in mature trends where momentum is likely to fade, and should always be combined with additional confirmation rather than acted on in isolation.
Trend-Following with OBV Slope
OBV's slope can serve as a trend filter in systematic approaches. A rising OBV line, higher highs and higher lows on the OBV chart, confirms an underlying uptrend and supports a long bias. A falling OBV line supports a bearish bias.
Traders sometimes draw trendlines directly on OBV. A break of an OBV trendline can signal a shift in volume dynamics before price breaks its own trendline, giving early warning that a trend may be losing or gaining institutional support. Combining OBV with a moving-average filter, taking positions only when price is above the moving average and OBV is rising, helps reduce noise in sideways markets.
Strengths, Limitations, and How OBV Compares
Where OBV Works Best
OBV performs well under these conditions:
- Clear trends or well-defined ranges with visible support and resistance
- Liquid markets with reliable volume data, such as large-cap equities or exchange-traded futures
- Breakout attempts from established consolidation patterns, where volume confirmation is meaningful
- Daily and higher time frames, where cumulative volume patterns are more stable and less distorted by intraday noise
Where OBV Falls Short
OBV's core assumption, that all volume on an up-close day represents buying pressure, can mislead in several situations:
- Choppy or low-liquidity markets, where short-term noise produces frequent OBV whipsaws
- Gap moves and intraday reversals that distort the cumulative line without meaningful directional information
- Sideways or range-bound markets, where small, untradeable divergences appear frequently
- Spot forex markets, where only tick volume is available rather than actual traded volume
A single large-volume session, a gap open on unusually high volume, say, can distort the OBV line for an extended period. For that reason, use OBV alongside other indicators and price-structure analysis rather than as a standalone decision tool.
How OBV Compares with Other Volume Indicators
Knowing how OBV differs from the Money Flow Index (MFI) and Volume Rate of Change (Volume ROC) helps you pick the right tool for each task.
OBV is best for tracking trend strength and structural accumulation or distribution over time. MFI is more effective for timing reversals from overbought or oversold extremes. Volume ROC complements OBV by pinpointing moments of sudden participation, such as breakout surges, that OBV smooths over in its cumulative calculation.
Who Should Use OBV?
OBV's usefulness varies by trading style and time frame. The table below summarises how different traders apply it:
In the Indian market, OBV is particularly useful on Nifty 50 and Bank Nifty components, where NSE volume data is reliable and reflects genuine participation. Traders commonly apply it on daily charts of large-cap stocks during breakout attempts from multi-week consolidation, using it to separate genuine institutional accumulation from low-conviction, retail-driven moves.
For mid-cap and small-cap stocks, where volumes can be thin and erratic, interpret OBV with more caution. A few large block trades can skew the cumulative line and produce misleading signals in markets with limited liquidity.
Investments in securities markets are subject to market risks. Read all the related documents carefully before investing.
Conclusion
OBV distils a whole session's volume into a single line that tells you whether buyers or sellers are winning the tug-of-war behind price. Used well, to confirm breakouts, spot divergences, and read trend strength on liquid, higher-timeframe charts, it can flag accumulation and distribution before price makes it obvious. Just remember its core assumption is a proxy, not a fact, so pair it with price structure and never trade it alone.
To apply OBV on live charts, you can open a free Demat account with SMC and access its charting and market-data tools.

 1800 11 0909
 smc.care@smctradeonline.com