
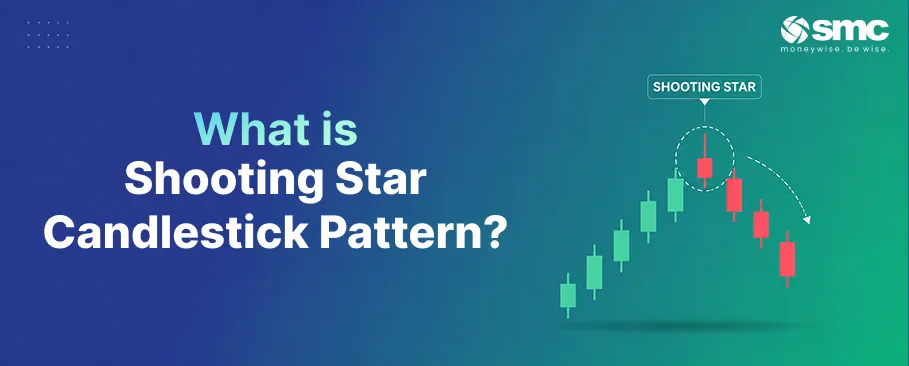


In trading, understanding candlestick patterns can help investors identify potential changes in market direction. One such pattern is the shooting star candlestick pattern. It typically appears after an uptrend and can signal that the bullish momentum is weakening, with a possible bearish reversal ahead.
In this guide, we’ll explain the meaning of the shooting star candlestick, how to identify the pattern, and how traders can use it when making trading decisions.
Understanding the Shooting Star Candlestick Pattern
The shooting star candlestick pattern is a bearish reversal pattern that generally appears after an uptrend. It suggests that buyers pushed the price higher during the trading session, but sellers stepped in and brought the price back near the opening level by the close.
The pattern has a small real body near the lower end of the candle, a long upper shadow, and little or no lower shadow. Ideally, the upper shadow should be at least twice the size of the real body.
In simple terms, the shooting star indicates that buyers initially had control, but sellers pushed prices back down before the session ended.
Shooting Star Candlestick Definition
The shooting star candlestick definition refers to a candle that forms after an upward price movement and has three key characteristics:
- Small real body: The opening and closing prices are relatively close, with the body positioned near the lower end of the candle.
- Long upper shadow: The upper wick is typically at least twice the real body, indicating that prices moved significantly higher but failed to sustain those levels.
- Little or no lower shadow: The candle closes near the lower end of the trading range, indicating that sellers regained control.
The colour of the candle is not the defining factor. However, a bearish or red shooting star can provide stronger visual confirmation of selling pressure.
Shooting Star Candlestick Meaning
The shooting star candlestick meaning is mainly associated with a potential bearish reversal after an uptrend. It indicates that although buyers pushed prices higher during the session, they were unable to maintain those levels and sellers took control by the close.
However, the pattern should not be treated as a guaranteed reversal signal. Traders generally look for confirmation from the next candle, trading volume, support levels, or other technical indicators before taking a position.
Identifying the Shooting Star Candlestick Pattern
To identify the shooting star candlestick pattern correctly, traders should look for the following characteristics:
1. Preceding Uptrend
The pattern should appear after a clear upward price movement. Its significance is stronger when the market has been trending higher rather than moving sideways.
2. Candlestick Features
- Small real body: The open and close are relatively close and positioned near the lower end of the candle.
- Long upper shadow: The upper shadow is ideally at least twice the size of the real body.
- Minimal lower shadow: The lower wick should be small or absent.
3. Confirmation
A shooting star is not a standalone sell signal. Traders often wait for the next candle to show bearish confirmation, such as closing below the shooting star’s body or low, depending on their trading strategy. Additional confirmation from volume, support levels or other indicators can also improve the reliability of the setup.
Trading Strategies Using the Shooting Star Candlestick Pattern
The shooting star candlestick pattern can be used as part of a broader trading strategy, but traders should look for confirmation rather than relying on the pattern alone.
1. Entry Point
Traders may consider entering a short position after bearish confirmation following the shooting star. The entry level can vary depending on the trader’s strategy and the confirmation used.
2. Stop-Loss Placement
A stop-loss is generally placed above the high of the shooting star. This helps limit potential losses if the price moves higher instead of reversing.
3. Profit Target
Traders can set profit targets around key support levels or use a suitable risk-reward ratio to determine potential exit levels.
4. Volume Analysis
Higher-than-usual trading volume during the formation of a shooting star can provide additional confirmation that the reversal signal is more strongly supported. However, volume should be considered along with the broader price and market context.
Comparing the Shooting Star with Similar Candlestick Patterns
The shooting star can look similar to several other candlestick patterns. Understanding the differences can help traders interpret them correctly.
- Inverted Hammer: It has a similar shape but generally appears after a downtrend and may signal a potential bullish reversal.
- Gravestone Doji: This pattern has a long upper shadow and little or no real body, with the open and close near the same level. It can indicate rejection of higher prices and possible bearish sentiment.
- Hanging Man: This pattern appears after an uptrend and has a small real body near the top with a long lower shadow. It can signal potential bearish pressure, but confirmation is generally required.
Limitations of the Shooting Star Candlestick Pattern
Although the shooting star can help identify potential reversals, it has some limitations:
- False Signals: The pattern may fail, particularly in volatile or sideways markets.
- Needs Confirmation: Using the shooting star alone can result in premature trading decisions. Other technical indicators or price action can provide additional confirmation.
- Context Matters: Its reliability depends on factors such as the preceding trend, nearby support and resistance levels, volume and overall market conditions.
Enhancing Analysis with Technical Indicators
Traders often combine the shooting star candlestick pattern with other technical tools to strengthen their analysis.
- Relative Strength Index (RSI): If the shooting star appears when RSI indicates overbought conditions, it may provide additional evidence that bullish momentum is weakening.
- Moving Averages: A shooting star forming near an important moving average or a resistance area can provide context for a potential reversal.
- Fibonacci Levels: If the pattern forms near a significant Fibonacci retracement or extension level, traders may use it as additional confirmation.
No single indicator guarantees a successful trade. Combining the pattern with other forms of technical analysis can help traders make more informed decisions.
Conclusion
The shooting star candlestick pattern is a bearish reversal pattern that can indicate weakening bullish momentum after an uptrend. Its long upper shadow shows that buyers pushed prices higher but were unable to sustain those levels, allowing sellers to regain control.
However, the pattern should not be used in isolation. Combining it with price action, volume, support and resistance, and other technical indicators can provide better context and help traders manage risk more effectively.
For traders seeking market insights and trading tools, SMC Global Securities offers access to trading and investment services that support informed decision-making.



 1800 11 0909
 smc.care@smctradeonline.com