
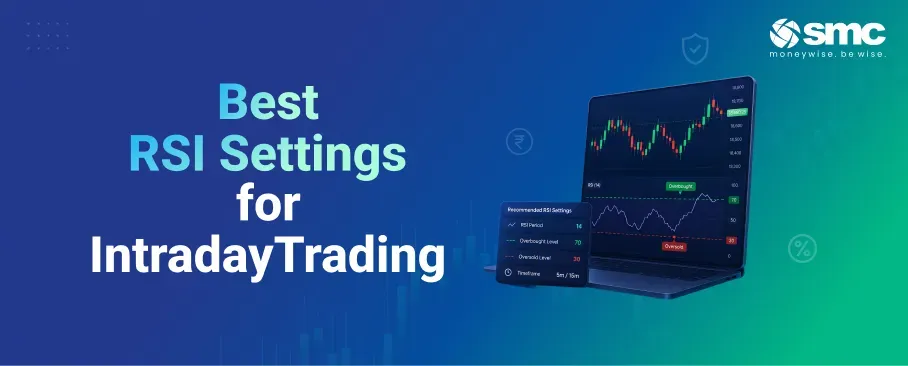


The default RSI setting works well on daily charts, but intraday trading moves faster and needs the indicator to react more quickly. Getting the settings right helps you reduce false signals, time your entries better, and read momentum as it actually behaves during a live session. The ideal numbers depend on your trading style, the timeframe you use, and the stock's volatility.
In this blog, we'll explore the best RSI settings for intraday trading, how to adjust them for different styles and timeframes, and the common mistakes to avoid.
What Is RSI and Why Do Intraday Traders Need to Tune It?
The Relative Strength Index (RSI) is a momentum indicator that measures how fast and how strongly a price has moved recently, on a scale from 0 to 100. It was developed by J. Welles Wilder Jr. and compares average gains to average losses over a set number of candles to show whether a stock is overbought or oversold.
Almost every platform calculates RSI for you, so what really matters is understanding what happens when you change its inputs:
- Shortening the lookback period from 14 to 7 makes RSI react faster to price swings. You get more signals, but also more noise.
- Widening the overbought and oversold levels from 70/30 to 80/20 filters out weaker moves and reduces false signals, but you may miss some genuine reversals.
In intraday trading, leverage magnifies losses, and brokerage adds up across many trades. So even a small rise in false signals can quietly eat into your profits. That is why choosing the right settings matters so much.
Why RSI Settings Matter in Intraday Trading
Three things shape how RSI behaves on an intraday chart: the lookback period, the overbought/oversold levels, and the timeframe you trade on.
- Period length decides how responsive RSI is. Shorter periods react quickly and suit scalping on 1- to 5-minute charts, but they whipsaw more. The standard 14-period setting is smoother and gives fewer, more reliable signals, which suits 15-minute or 60-minute charts where you hold positions longer.
- Threshold levels decide what counts as an extreme. The classic 70/30 works well in range-bound markets. But in strong trends, RSI can remain above 70 or below 30 for extended periods, so treating those as automatic reversal points leads to repeated losses. Shifting to 80/20 on volatile days, or 65/35 in tight ranges, reduces false counter-trend entries.
- The timeframe sets how much data each candle holds. A 5-period RSI on a one-minute chart behaves very differently from a 14-period RSI on a 15-minute chart, even though both are intraday. Matching the RSI period to the noise level of your chart is key.
Standard RSI Settings and Their Limitations
The textbook default is a 14-period RSI with 70 as overbought and 30 as oversold. A reading above 70 suggests the move may be running out of steam, while a reading below 30 suggests a possible bounce. On daily and weekly charts, these levels work well for swing trades.
On intraday charts, the default tends to struggle in two situations.
Trending sessions
In a strong intraday uptrend, RSI can climb above 70 and stay there for most of the day. Shorting just because RSI "looks overbought" means trading against the dominant move. The same applies in reverse during sharp selloffs. What looks overbought is often a sign of trend strength, not a reversal.
Choppy, sideways sessions
In a range-bound session, a 14-period RSI with 70/30 can swing back and forth across the midline, crossing the levels many times without any profitable move. Each mechanical trade just adds brokerage and slippage for little reward.
Think of 70 and 30 as zones that depend on context, not as fixed buy and sell buttons. That single shift in mindset makes RSI far more useful intraday.
Best RSI Settings for Intraday Trading
There is no single best setting, but experience and practice point to a few reliable ranges depending on how you trade.
Scalping (1-5 minute charts)
Use a 5 to 7 period RSI with 80/20 levels. The short period keeps it responsive, while the wider levels filter out marginal moves. Always pair the signal with something else, such as VWAP, a key price level, or a volume spike. On its own, the false-signal rate is too high at this speed.
Regular intraday trading (5-15 minute charts)
A 9 to 11 period RSI with 70/30 or 75/25 levels balances speed and stability. This is the most commonly used range for day trading across stocks and index derivatives, capturing intraday swings with less noise than very short periods.
Slower intraday and trend-following (15-60 minute charts)
The classic 14-period RSI with 70/30 or 80/20 works well for higher-conviction trades held for hours rather than minutes. You get fewer signals, but they are higher quality, and the smoothing helps avoid whipsaws during quieter mid-session hours.
Indices vs individual stocks
Indices such as Nifty and Bank Nifty tend to be smoother than mid- and small-cap stocks, so slightly longer periods (9-14) with standard levels usually work well. Volatile individual stocks often do better with shorter periods (5-9) and wider levels (80/20 or 75/25) to avoid getting pulled in by a single sharp candle.
Adapting to volatility
On high-volatility days, widen the levels to 80/20 or 85/15 and lengthen the period to avoid over-reacting to sharp swings. On calm days, tighten to 65/35 or 60/40 to catch more mean-reversion signals. Checking ATR or recent volatility before you set the period adds a simple, objective reference.
Best Timeframes to Use RSI for Intraday Trading
1-3 minute charts
This is ultra-short scalping territory. A 5 to 7-period RSI is typical here, but the signals are heavily driven by noise. Only experienced scalpers with tight risk control and strong confirmation should rely on RSI at this speed.
5-minute charts
The most popular intraday timeframe for RSI trading. A 7 to 11-period RSI lines up well with meaningful short-term momentum shifts.
15-minute charts
A 9 to 14-period RSI gives fewer but higher-quality signals, which suits traders who prefer two to four trades per session.
30-60 minute charts
Used more for judging direction than for generating entries. A 14-period RSI here confirms whether the broader intraday trend supports the trades you take on lower timeframes.
Multi-timeframe approach
Using a higher-timeframe RSI (60-minute or daily) as a direction filter improves your lower-timeframe entries. Favour long trades when the higher-timeframe RSI is above 50 and short trades when it is below 50, then enter on lower-timeframe pullbacks where RSI turns from an extreme in line with the main trend.
Common RSI Mistakes Intraday Traders Make
1. Treating 70/30 as automatic reversal triggers
In strong trends, overbought and oversold readings show strength, not an imminent reversal. Shorting when RSI drops below 70 during a powerful rally usually means fighting the dominant move. Look instead for pullbacks where RSI dips to 40-50 in an uptrend, ideally with price action backing it up.
2. Ignoring the market condition
Using the same RSI reading in a trend and in a sideways market is one of the most common errors. In a range, swings between 30 and 70 support mean-reversion trades. In a strong trend, RSI works better for timing pullbacks and reading the 50 level than for counter-trend entries.
3. Misusing divergence on short timeframes
Small RSI divergences on one to five-minute charts fail, especially during strong trends. Divergence is an early warning, not a signal on its own. Wait for confirmation, such as a break in structure, a shift in volume, or a higher-timeframe level, before acting.
4. Over-optimising the settings
Fine-tuning one very specific combination that happened to work on a single stock is curve-fitting. Stick to broad ranges (5-7, 9-11, 14) and test them across several stocks and time periods. Sound rules and good risk management matter far more than a "magic" number.
5. Applying one setting to everything
A setting tuned for Nifty futures may not work on a volatile small-cap with wide spreads. Keep separate profiles for indices, large-caps, and mid- or small-caps, and test each on its own.
6. Trading every RSI cross without confluence
RSI signals on their own have a poor hit rate. Wait for confluence with at least one of the following: a support or resistance level, a trend filter, a volatility tool such as ATR or Bollinger Bands, or volume confirmation.
7. Ignoring market-open and news-driven volatility
The first 15 to 30 minutes and the period around scheduled events bring volatility spikes that push RSI to extremes and back within minutes. Widen the levels, lengthen the period, or simply wait for things to settle before trusting RSI.
8. Expecting RSI to replace risk management
RSI is a timing tool, not a risk management system. Your stop-losses and position sizes should be based on volatility and your trade plan, not on an indicator reading.
Conclusion
RSI is one of the most useful indicators for intraday trading, but only when its settings match how you actually trade. Shorter periods and wider levels suit fast scalping, while the standard 14-period setting fits slower, higher-conviction trades. The real edge comes from adjusting RSI to the stock, the timeframe, and the day's volatility, and always pairing it with proper risk management.
The right RSI setting works best when backed by the right trading platform and disciplined execution. Open a Free Demat Account with SMC and access advanced charts, real-time market tracking, and tools built for smarter intraday trading.


 1800 11 0909
 smc.care@smctradeonline.com