The MACD (Moving Average Convergence Divergence) is one of the most widely used momentum indicators in technical analysis, but its default settings were designed for daily charts, not fast intraday trading.
On a 5-minute chart, where price movements unfold quickly, the standard 12-26-9 configuration often reacts too slowly, signalling entries after much of the move has already occurred.
Intraday traders, therefore, adjust MACD parameters to make the indicator more responsive to short-term momentum shifts. Faster combinations, such as 5-13-1 for intraday trading and 3-10-1 for aggressive scalping, help capture earlier signals while still tracking trend direction.
Understanding how these settings affect responsiveness, noise, and signal quality is essential when using MACD on lower timeframes.
#Key Takeaways
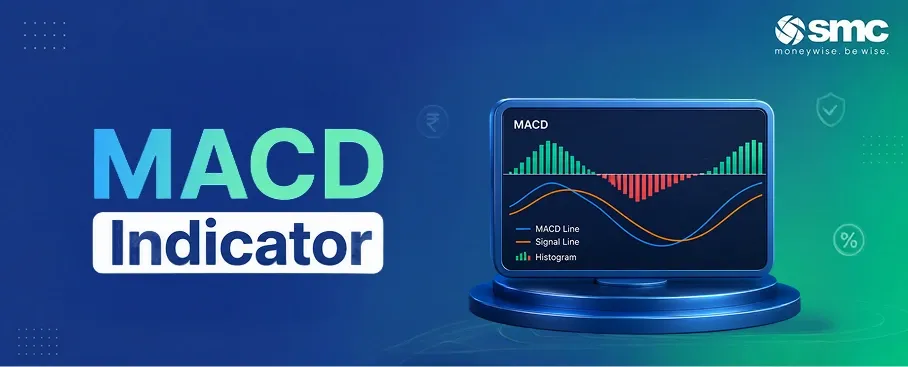
- MACD is built from the difference between two EMAs and a smoothed signal line. The histogram visualises momentum strength.
- Default 12-26-9 settings lag on 5-minute charts. Use 5-13-1 for most intraday trading and 3-10-1 for aggressive scalping.
- There is no universal "best" setting. Align parameters with the asset's volatility, the session's character, and the intended trade duration.
- MACD works best when trades follow a clear trend confirmed by additional tools - EMAs, RSI, VWAP, support/resistance, and volume.
- Sideways markets produce false MACD signals. Identify the regime before trading crossovers, or stay flat.
- Risk management must match the indicator's speed. Faster settings demand tighter stops and quicker decisions.
#What Is the MACD Indicator?
MACD is a trend-following momentum oscillator that measures the relationship between two exponential moving averages (EMAs) of price. Developed by Gerald Appel in the late 1970s, MACD remains one of the most widely used tools in technical analysis.
Three components make up the indicator:
- #MACD Line - calculated by subtracting the 26-period EMA from the 12-period EMA (MACD = EMA(12) - EMA(26)). The MACD line reflects short-term momentum relative to a longer trend.
- #Signal Line - a 9-period EMA of the MACD line, used as a trigger for buy and sell signals. When the MACD line crosses above the signal line, it generates a bullish signal. A cross below generates a bearish signal.
- #Histogram - the difference between the MACD line and the signal line, plotted as bars around the zero line. Rising bars indicate strengthening momentum; shrinking bars suggest momentum is fading.
#How MACD Generates Trading Signals
#MACD Line and Signal Line Crossovers
- Bullish crossover: MACD line crosses above the signal line, suggesting upward momentum.
- Bearish crossover: MACD line crosses below the signal line, suggesting downward momentum.
#Zero Line Crossovers
- MACD above zero means the 12-period EMA is above the 26-period EMA - bullish momentum.
- MACD below zero means the 12-period EMA is below the 26-period EMA - bearish momentum.
#Divergence
- Bullish divergence: price makes a new low, but MACD forms a higher low - potential upward reversal.
- Bearish divergence: price makes a new high, but MACD forms a lower high - potential downward reversal.
MACD is not a standalone "buy/sell arrow." It is a framework for reading trend direction and momentum strength, best used alongside other tools like RSI, support/resistance levels, and volume.
#Why Do MACD Settings Matter on a 5-minute Chart?
On 5-minute charts, price moves faster and with more noise than on daily or weekly charts. Indicators based on long EMAs, like the default 12 and 26 periods, reflect price action spanning 60 to 130 minutes. For a scalper targeting moves that last 5 to 15-minutes, that is far too slow.
Shorter EMAs (3, 5, 10, or 13 periods) respond to price action over the last 15 to 65-minutes on a 5-minute chart. The MACD becomes more responsive, catching momentum shifts earlier. The trade-off: more noise and more false signals.
A useful way to think about it: shorter EMAs have a "short memory" of the market; they react quickly but overreact to noise. Longer EMAs have a "long memory" - slower but more stable.
The signal line smoothing period (the third number in MACD settings) controls how quickly the trigger responds. Reducing the signal line from 9 to 1 removes almost all smoothing, giving faster crossover signals at the cost of more whipsaws.
The same numerical settings mean different things in different time frames. A 12-period EMA on a daily chart reflects roughly two and a half weeks of price data. On a 5-minute chart, the same 12-period EMA covers only the last 60 minutes.
#What Are the Default MACD Settings and Their Limitations?
The standard MACD configuration on most charting platforms is 12 (fast EMA), 26 (slow EMA), and 9 (signal line). These settings were designed for daily charts.
On 5-minute charts, the default MACD has three specific weaknesses:
#Late signals
The 12 and 26 EMAs cover 60 to 130 minutes of intraday price action. Crossover signals often fire after a large portion of a short-term move is already over, reducing the reward-to-risk ratio for scalpers.
#Whipsaws in range-bound conditions
In choppy, sideways markets, the MACD line and signal line repeatedly cross around the zero line, generating multiple false entries and exits. Each false signal costs spreads, commissions, and psychological capital.
#No overbought/oversold zones
Unlike RSI or Stochastic, MACD does not define extremes. Timing intraday reversals using MACD alone is difficult because there is no built-in "too far, too fast" reading.
Default 12-26-9 MACD can still serve a role on 5-minute charts - as a slower confirmation tool aligned with higher timeframe direction (15-minute or 1-hour trends). But for active 5-minute scalping, faster combinations work better.
#What Are the Best MACD Settings for 5-minute Chart Trading?
No single MACD setting works in all conditions. The right parameters depend on the asset, volatility, and intended trade duration. That said, two configurations appear consistently in intraday trading practice.
#3-10-1 MACD - Fast Scalping
The 3-10-1 configuration is extremely responsive. The 3-period fast EMA covers the last 15-minutes on a 5-minute chart; the 10-period slow EMA covers the last 50 minutes. With a signal line of 1 (essentially no smoothing), crossovers happen almost instantly.
#When to use 3-10-1:
- High volatility environments - crypto (BTC/ETH), aggressive tech stocks around earnings or news, major forex pairs during overlapping sessions (London/New York).
- Trades targeting momentum bursts lasting 5 to 15-minutes.
- Traders are comfortable with higher noise and rapid decision-making.
#5-13-1 MACD - Intraday Sweet Spot
The 5-13-1 setup captures trends forming over 25 to 65-minutes on a 5-minute chart. Slower than 3-10-1 but fast enough to catch meaningful moves without reacting to every minor wiggle.
#When to use 5-13-1:
- Positions held for 15 to 60 minutes.
- Liquid instruments - index ETFs (SPY, QQQ, Nifty ETFs), large-cap stocks, high-volume forex pairs.
- Traders looking for confirmed breakouts and breakdowns rather than first and second entries.
#12-26-9 MACD - Directional Filter
The default settings can still add value on 5-minute charts when used as a directional filter rather than a timing tool. If the 12-26-9 MACD is above zero and trending up on the 5-minute chart, bias long. If below zero and trending down, bias short. Use a faster indicator (or a faster MACD like 3-10-1) for actual entry timing.
#Settings Comparison
#What Are the Best MACD Histogram Settings for 5-minute Charts?
The histogram is not a separate indicator. It is the visual representation of the gap between the MACD line and the signal line (histogram = MACD - signal). Changing MACD settings automatically changes the histogram.
With faster parameters (3-10-1 or 5-13-1), histogram bars expand and contract more quickly, reflecting the rapid momentum shifts typical of intraday trading.
#How to Read the Histogram on a 5-minute Chart
- #Growing bars in the direction of the trend - momentum is strengthening. Hold the position or look for additions.
- #Shrinking bars - momentum is fading. Tighten stops or prepare to exit. Shrinking bars often appear before the MACD line and signal line actually cross, making the histogram an early warning tool.
- #Zero-line flip - histogram crossing from negative to positive (or vice versa) confirms a MACD crossover has occurred.
#A practical pattern: On a 5-minute chart with 5-13-1 MACD, watch for the histogram to make a higher low while price retests support. This can signal a bullish momentum shift before a full MACD crossover confirms it.
Some traders colour-code histogram bars (green for growing, red for shrinking) to make momentum shifts easier to spot in real time. This is a platform display preference, not a change to MACD math.
#What Mistakes Do Traders Make Using MACD on 5-minute Charts?
#1. Using Default Settings Without Adjustment
Many traders keep 12-26-9 on every timeframe because it is the platform default. On 5-minute charts, this means entering trades after the move is underway and exiting too late during fast reversals. Checking whether your MACD parameters match your timeframe and trading style is a prerequisite, not an optimisation.
#2. Trading Every Crossover in Sideways Markets
In range-bound or low-volatility sessions, MACD lines repeatedly cross around zero, generating a stream of false signals. Each triggers a trade, and each loses a small amount to spreads and commissions. Over a session, these losses compound.
Before taking a MACD crossover trade, identify whether the market is trending. If price is oscillating within a tight range, MACD crossovers are unreliable; look for confluence with support/resistance or wait for a breakout.
#3. Relying on MACD Alone
MACD is a lagging indicator built from historical prices. Using it as the sole decision engine ignores price action, volume, support/resistance, news catalysts, and broader market context. Treat MACD as one layer in a complete trade plan.
#4. Ignoring Higher Timeframe Trend
Taking 5-minute MACD buy signals when the 1-hour chart shows a strong downtrend is fading a powerful move. Multi-timeframe analysis: using a higher timeframe to define trend direction and the 5-minute chart for entry timing, filters out a significant portion of losing trades.
#5. Mismatched Risk Management
Fast MACD settings (3-10-1) require tight stops and small position sizes because signals come quickly and can reverse just as fast.
Using swing-style stops with a scalping indicator creates poor risk-reward. Define invalidation points and position size before entering, calibrated to the speed and noise level of the chosen MACD settings.
Intraday setups like MACD rely on timing, discipline, and quick execution. Open a Demat account with SMC to trade seamlessly with real-time market access and research-backed insights.