


In the fast-moving world of trading, every price movement can offer clues about market behavior. One concept that has gained attention among price-action traders is the fair value gap (FVG).
A fair value gap is generally described as a price imbalance that appears when the market moves sharply in one direction, leaving a zone between the price ranges of surrounding candles. Traders use these zones to identify areas where price may potentially retrace or react.
The full form of FVG is Fair Value Gap. In this article, we’ll explain FVG meaning, how to identify an FVG on a chart, why these imbalances occur, and how traders may incorporate them into a trading approach. We’ll also look at their advantages, limitations and the importance of risk management.
What is a Fair Value Gap?
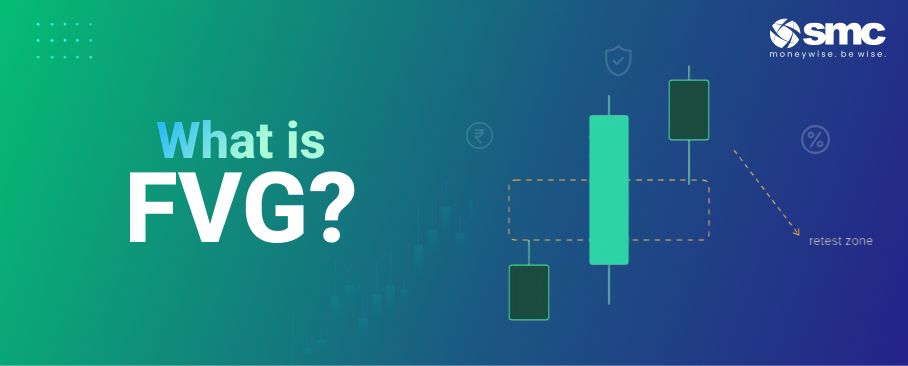
A fair value gap is a three candle price pattern that indicates a potential imbalance or inefficiency in price action. It typically forms when a strong move in the middle candle is large enough that the wicks of the first and third candles do not overlap, leaving a price zone between them.
For example, in a bullish FVG, the low of the third candle is above the high of the first candle. The area between these two price levels forms the bullish FVG zone. In a bearish FVG, the high of the third candle is below the low of the first candle.
This is different from a conventional price gap, where the market opens at a different level from the previous session's close. An FVG is a specific three-candle price-action concept and can occur even when there is no traditional overnight gap.
Why Fair Value Gap Matters
Understanding Market Imbalance
An FVG can highlight an area where price moved rapidly in one direction, suggesting an imbalance between buying and selling pressure. Traders may monitor these areas because price can subsequently retrace into them.
However, an FVG does not prove that the market was literally inactive at every price within the zone. It is better understood as a chart-based representation of an imbalance or inefficiency.
Institutional Activity
Some trading frameworks, particularly Smart Money Concepts and ICT-style analysis, associate FVGs with aggressive institutional buying or selling. Large orders can contribute to sharp price movements and imbalances, but an FVG by itself cannot confirm that institutional traders were responsible for the move.
Therefore, traders should treat institutional activity as one possible explanation rather than a guaranteed interpretation of every FVG.
How to Recognize a Fair Value Gap
One of the most common ways to identify an FVG is through a three-candle pattern:
- Candle 1: The first candle establishes the initial price range.
- Candle 2: A strong directional move occurs, creating significant displacement.
- Candle 3: The move continues in the same direction.
- The gap: If the relevant wicks of Candle 1 and Candle 3 do not overlap, the space between them forms the FVG zone.
Broadly:
- Bullish Fair Value Gap: The third candle's low is above the first candle's high, leaving a zone between those two levels.
- Bearish Fair Value Gap: The third candle's high is below the first candle's low, creating a gap between them.
Traders may then mark this zone on the chart and observe how price behaves if it returns to the area.
What Makes a Fair Value Gap Valuable?
Price Retracement
One reason traders watch FVGs is that price can revisit these zones after the initial move. Such a retracement may bring the price back into the imbalance before the original trend resumes. However, not every FVG gets filled, and a return to the zone should never be treated as guaranteed.
Practical Usage
Traders may use an FVG to:
- Identify potential areas of price imbalance
- Monitor possible retracements into the gap
- Look for additional confirmation before entering a trade
- Define potential stop-loss and target levels based on their broader trading setup
An FVG can therefore serve as one component of an overall trading strategy, rather than a standalone buy or sell signal.
Causes Behind a Fair Value Gap
Several factors can contribute to the sharp price movement associated with an FVG.
1. Big News Events
Central bank decisions, inflation data, employment reports, earnings announcements, and other major events can cause rapid repricing as market participants respond to new information. Such sharp moves can create price imbalances.
2. Large Orders and Market Participation
Large buying or selling pressure can consume available liquidity and contribute to a rapid directional move. While traders often associate such moves with institutional activity, an FVG alone does not establish who caused the move.
3. Liquidity Imbalance
When buying or selling pressure becomes heavily one-sided, prices can move quickly through multiple levels. This can leave behind a three-candle imbalance that traders identify as an FVG.
Best Practices for Trading Fair Value Gaps
Using an FVG effectively requires more than simply identifying a three-candle pattern. Traders should consider the broader market context and use appropriate risk management. Here are some best practices for trading fair value gaps.
1. Choose Your Timeframe with Care
FVGs can appear across different timeframes. Lower timeframes such as M5 and M15 may produce more setups but can also contain more short-term market noise. Higher timeframes, such as H4 and Daily, may produce fewer setups and help traders focus on broader price movements.
There is no single timeframe that is universally more reliable. Traders should choose one that matches their trading style and then test the approach before using it with real capital.
2. Mark Your Gap Area
Once an FVG has been identified, traders can mark the relevant price zone on the chart. For a bullish FVG, this is generally the area between Candle 1's high and Candle 3's low. For a bearish FVG, it is the area between Candle 3's high and Candle 1's low.
3. Wait for Retracement
Some traders wait for the price to return to the FVG before considering an entry. However, a retracement into an FVG is not guaranteed, and price can continue moving without revisiting the zone.
4. Use Additional Confirmations
An FVG is generally more useful when considered alongside other forms of analysis. Traders may combine it with support and resistance, trend structure, volume, RSI, moving averages or other technical indicators to seek additional confirmation.
5. Manage Risk
Risk management should remain an important part of any FVG-based approach.
- Entry: Consider an entry only after the FVG setup and any additional confirmation meet the trading plan.
- Stop-loss: Place the stop based on the trade setup and risk tolerance, rather than assuming it must always be just outside the FVG.
- Target: Potential targets can be based on support, resistance, previous highs or lows, or other predefined levels.
There is no guaranteed low-risk setup simply because a trade is based on an FVG.
Pros and Cons of the Fair Value Gap Strategy
Like any trading approach, using the fair value gap method has its strengths and limitations. It can provide a structured way to study price imbalances, but it should not be treated as a standalone prediction tool.
Pros
- Clear setups: FVGs can provide clearly defined price zones that traders can monitor for potential entries or reactions.
- Structured analysis: Marking an FVG can help traders organise potential entry, stop-loss and target areas as part of a broader trading plan.
- Versatility: FVGs can be identified across different asset classes and timeframes, although the quality and frequency of setups can vary.
- Supports disciplined trading: Using predefined conditions and risk limits can encourage traders to follow a structured approach rather than make decisions purely on emotion.
Cons
- Not all gaps fill: Price does not necessarily return to every FVG. Some zones may remain untested, particularly during strong directional moves.
- False signals: An FVG can fail to produce the expected reaction, particularly when market conditions change or the broader trend is misread.
- Subjectivity: Traders may differ in how they identify, define or prioritise FVGs, especially when assessing the strength of the surrounding price action.
- Patience required: Traders who wait for price to revisit an FVG may have to accept that some setups will never trigger.
Overall, FVG in trading works best when it is combined with broader market analysis, confirmation and proper risk management rather than used as an isolated signal.
Conclusion
A fair value gap is a price-action concept used to identify potential imbalances created during a sharp market move. By learning FVG meaning, recognising the three-candle structure and understanding how price behaves around these zones, traders can add another tool to their technical-analysis process.
Whether you are studying FVG in trading, identifying potential setups or developing an FVG-based strategy, it is important to remember that these patterns do not guarantee a reversal, retracement or profitable trade. Combining FVG analysis with market context, confirmation and disciplined risk management can provide a more balanced approach.
If you are interested in learning about trading tools and market analysis, you can explore the resources available from SMC Global Securities.



 1800 11 0909
 smc.care@smctradeonline.com