


If you spend time analysing stock charts, certain candlestick patterns stand out because of what they reveal about market sentiment. The hammer candlestick pattern is one such signal. It forms after sellers push the price lower, only for buyers to step in and drive it back up before the trading session ends. The result is a candle with a small real body near the top and a long lower shadow.
In this guide, written for traders in India, we will explain what the hammer candlestick pattern is, how to identify it, how traders use it, the common mistakes to avoid, and how it differs from similar candlestick patterns.
#What is a Hammer Candlestick Pattern?
A hammer candlestick pattern appears after a downtrend and signals that selling pressure may be weakening. It is characterised by:
- A small real body near the top of the trading range.
- A long lower shadow, showing that sellers pushed prices lower before buyers regained control.
- Little or no upper shadow.
The colour of the candle is less important than its shape. A green (bullish) hammer is often considered slightly stronger than a red (bearish) hammer. Still, both can indicate a potential bullish reversal when they appear after a downtrend and are confirmed by the next candle.
#The Psychology Behind the Hammer Pattern
The hammer reflects the battle between buyers and sellers during a trading session.
- Sellers initially push prices lower.
- Buyers absorb the selling pressure, driving prices back towards the session's high.
- The close near the upper end of the candle suggests that buyers regained control before the session ended.
Although the hammer may indicate that bearish momentum is fading, traders usually wait for confirmation from the next candle before assuming a reversal.
#Types of Hammer Candlestick Patterns
The hammer has a few closely related variations. Understanding them helps traders interpret price action more accurately.
#1. Classic Hammer
The classic hammer appears after a downtrend. It has a small real body near the top, a long lower shadow, and little or no upper shadow. Traders view it as a potential bullish reversal signal, to be confirmed by the next candle.
#2. Inverted Hammer
The Inverted Hammer also appears after a decline, but it has a long upper shadow rather than a lower shadow. It suggests that buyers attempted to push prices higher during the session, although confirmation from the following candle is still important.
#3. Bullish and Bearish Hammer
A hammer can have either a green (bullish) or red (bearish) body. While many traders consider a green hammer slightly more reliable, the overall structure, preceding trend, and confirmation candle are more important than the candle's colour.
#4. Hanging Man
The Hanging Man has the same shape as a hammer but appears after an uptrend instead of a downtrend. It may indicate weakening buying momentum and a possible bearish reversal, provided the next candle confirms the signal.
#5. Shooting Star
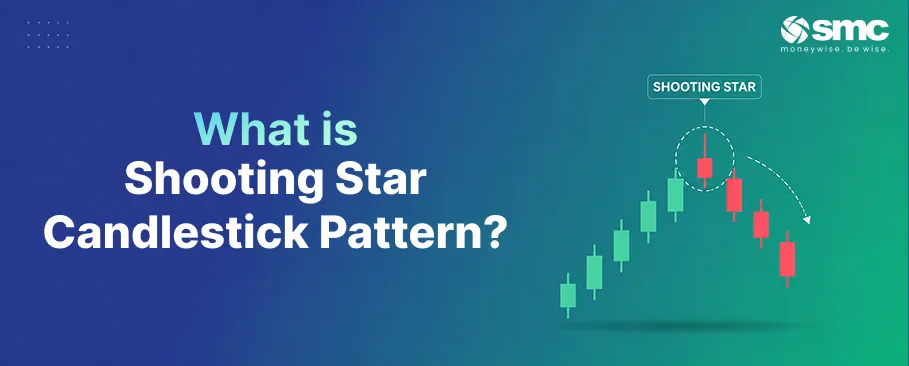
The Shooting Star is the bearish counterpart of the Inverted Hammer. It forms after an uptrend and has a small body near the candle's low, with a long upper shadow. It may indicate that buyers are losing momentum.
#6. Double Hammer
A #Double Hammer is an informal term used when two hammer-like candles appear close together after a decline. Some traders interpret this as continued buying interest, although confirmation from subsequent price action remains essential.
#Hammer vs Doji: Spot the Difference
Although both are single-candle patterns, they communicate different market conditions.
#Where a Hammer Matters Most
A hammer is most meaningful when:
- It appears after a clear downtrend rather than during a sideways market.
- It forms near a significant support level.
- Trading activity or volume increases around the reversal.
- The following candle confirms buying strength.
A hammer should always be interpreted in the context of the prevailing trend rather than as a standalone trading signal.
#How to Trade the Hammer Candlestick
A disciplined trading approach can help improve the reliability of hammer-based setups.
#1. Check the Trend
Ensure the hammer forms after a meaningful decline. Without a preceding downtrend, the pattern loses much of its significance.
#2. Identify the Pattern
Confirm that the candle has:
- A small real body near the top.
- A long lower shadow.
- Little or no upper shadow.
Mark the candle's high and low before planning the trade.
#3. Wait for Confirmation
Look for a bullish confirmation candle after the hammer. Strong buying interest following the hammer increases the probability of a reversal.
#4. Plan Your Entry
Some traders enter after the price moves above the hammer's high, while others wait for a minor pullback that respects the hammer's range. Choose one approach and apply it consistently.
#5. Define Your Risk
A common stop-loss level is below the hammer's low. If the price decisively breaks below this level, the reversal setup may no longer be valid.
#6. Plan Your Exit
Potential profit targets can be based on nearby resistance levels, previous swing highs, or a trailing stop-loss. Let price action guide your exit rather than relying on arbitrary price targets.
#7. Manage Position Size
Ensure your position size aligns with your risk tolerance and the distance between your entry price and stop-loss.
#8. Maintain a Trading Journal
Record screenshots of the setup, your entry and exit points, and the trade outcome. Reviewing past trades can help you identify which hammer setups perform best over time.
#Common Mistakes to Avoid
Even a reliable candlestick pattern like the hammer can produce false signals if used without context. Here are some common mistakes traders should avoid:
#Treating Every Small-Bodied Candle as a Hammer
Not every small-bodied candle qualifies as a hammer. The lower shadow should be significantly longer than the real body, and the pattern should appear after a clear downtrend.
#Skipping Confirmation
Entering a trade immediately after spotting a hammer can lead to false signals. Waiting for a confirming bullish candle helps improve the setup's reliability.
#Trading in Sideways Markets
A hammer that forms within a range or a sideways market is generally less reliable than one that appears after a sustained decline.
#Ignoring Volume
A hammer supported by higher trading volume often carries greater significance than one formed on weak participation. While volume is not mandatory, it can strengthen the overall signal.
#Ignoring the Stop-Loss
A common stop-loss is placed below the hammer's low. If the price closes decisively below this level, it may invalidate the bullish setup.
#Is a Hammer Bullish or Bearish?
A hammer is generally considered a potential bullish reversal pattern when it appears after a downtrend and is followed by a confirming bullish candle.
Although a hammer can have either a green or red body, the candle's colour is less important than its structure, the preceding trend, and the confirmation that follows. Traders should avoid relying on the hammer alone without considering the broader market context.
#Understanding the Inverted Hammer
The Inverted Hammer also appears after a decline, but it has a long upper shadow rather than a lower shadow. It suggests that buyers attempted to push prices higher during the session, even though sellers regained some control before the close.
Like the classic hammer, the Inverted Hammer becomes more meaningful when followed by a strong bullish confirmation candle.
#What is a Double Hammer Pattern?
A Double Hammer is an informal term used to describe two hammer-like candles that appear close together after a downtrend. Some traders interpret this as a sign of continued buying interest at lower levels.
However, it is not a separate candlestick pattern in classical technical analysis. As with a single hammer, confirmation from subsequent price action and proper risk management remain essential.
#Conclusion
The hammer candlestick pattern is a simple yet effective price action signal that can help traders identify potential bullish reversals after a downtrend. However, the pattern is most reliable when it forms near an important support level, appears after a sustained decline, and is confirmed by the next candle.
Rather than relying on the hammer alone, combine it with support and resistance levels, volume analysis, or other technical indicators to improve decision-making. A disciplined trading plan, sound risk management, and consistent trade review are equally important for long-term success.



 1800 11 0909
 smc.care@smctradeonline.com