
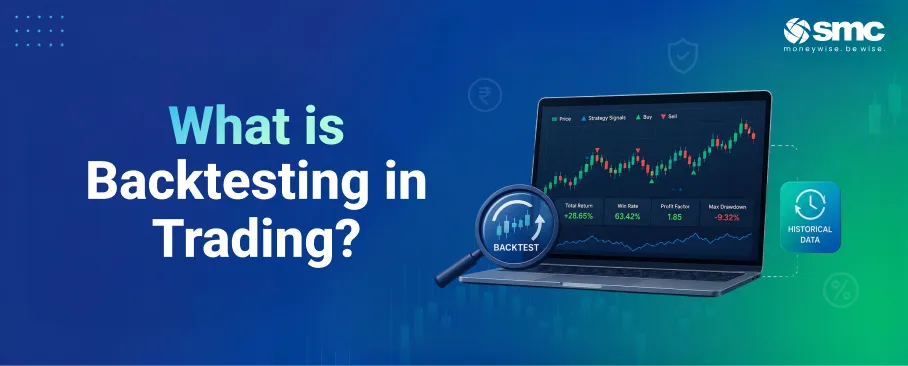


A trading strategy can look convincing on paper and still fall apart in a live market, where price swings, volatility, and execution costs all work against it. Backtesting is how you find out before you risk any money: you run the strategy against historical data to see where it holds up and where it breaks down. Whether you trade manually or run an algo, this one step separates a tested edge from a hopeful guess.
The sections ahead explain how backtesting works, how to evaluate a strategy using historical data, and how to produce more realistic and reliable results.
#What Is Backtesting in Trading?
Backtesting runs a clearly defined strategy, its entry rules, exit conditions, position sizing, and risk limits, against historical price data as if each trade had been placed live, then calculates the profits, losses, drawdowns, and other risk metrics from the resulting trade log.
The point is objectivity. Instead of relying on gut feel, you measure a strategy's edge across hundreds or thousands of simulated trades, compare approaches side by side, and see which combinations of indicators, timeframes, and thresholds produce more stable risk-adjusted returns.
#How backtesting helps validate trading strategies
A well-structured backtest serves as a validation layer between your idea and live trading. It shows how the strategy would have responded to bull markets, bear selloffs, and sideways phases, exposing win rate, average profit and loss per trade, maximum drawdown, and the shape of the equity curve.
Positive results make it easier to follow your rules during the inevitable losing streaks. Weak or negative results tell you to revise or scrap the idea before it costs real money. Just as importantly, a backtest reveals fragility: if performance collapses when a moving-average length shifts by two bars, the strategy is probably too delicate for live conditions.
#Why Backtesting Is Important
#Reducing risk before live trading
Simulating trades on historical data exposes worst-case scenarios before you commit any capital. Peak-to-trough drawdowns, prolonged losing streaks, and high-volatility episodes all show up in the report, which then informs your position sizing and capital allocation.
This matters most for leveraged strategies, options structures, and intraday systems, where losses can escalate quickly without pre-set limits. Stress-testing on past crisis periods and event-driven selloffs shows how resilient the strategy is when conditions turn hostile.
#Understanding performance across market regimes
A backtest turns an abstract idea into a track record spanning several years and market conditions. You can check the equity curve for smoothness, see whether profits cluster in a few exceptional periods, and judge whether active trading is worth its costs against a passive benchmark.
Looking at returns, drawdowns, and volatility together is far more useful than absolute profit alone. A strategy earning 40% with a 35% drawdown tells a very different story from one earning 25% with a 10% drawdown.
#Identifying strengths and weaknesses
Slicing results by market regime shows where a strategy thrives and where it struggles. A trend-following system may perform strongly in directional markets but give back profits when the market goes range-bound. A mean-reversion approach might shine in choppy conditions but bleed during sustained trends.
These insights guide targeted fixes: a volatility filter to sidestep bad conditions, adjusted stop-loss logic, or more realistic expectations about how long drawdowns last.
#Key Components of Backtesting
#Historical price data and data quality
Historical OHLCV (open, high, low, close, volume) data is the foundational input: daily bars for swing systems, intraday bars for day trading. Data quality directly controls how reliable your results are: missing bars, wrong prices, survivorship bias from excluding delisted stocks, and ignored corporate actions like splits and dividends all distort the numbers.
#Trading rules and conditions
- The strategy must be defined as a strict, mechanical set of rules with no ambiguity.
- Signal generation (indicator crossovers, pattern triggers, option structures), entry and exit conditions, and position sizing must all be explicit.
- The simulation should model realistic execution: order types, assumed fill prices, slippage, commissions, and margin rules.
- For Indian equity and F&O traders, factoring in brokerage, STT, exchange fees, and historically realistic lot sizes is essential for honest results.
#Performance metrics and evaluation criteria
Key metrics include total and annualised return, win rate, average win and loss sizes, profit factor (gross profit divided by gross loss), maximum drawdown, and risk-adjusted ratios such as Sharpe and Sortino ratios. Equity-curve smoothness, time in the market, and trade frequency complete the picture.
A high win rate alone can mislead if the average loss dwarfs the average win. Conversely, a 35% win-rate system can be highly profitable if winners are three to four times as large as losers. Reading these metrics together prevents the selective interpretation that leads to overconfidence.
#How Do You Backtest a Trading Strategy?
#Step 1: Define entry and exit rules
- Turn your trading idea into clear, objective rules with no room for interpretation.
- Define the exact entry and exit conditions, including profit targets, stop-losses, trailing stops, and position sizing.
#Step 2: Choose the historical period and data set
- Use historical data that covers bull, bear, and sideways markets.
- Test over a large enough sample, ideally at least 100 trades, to reduce the impact of random outcomes.
- Match the data frequency to your strategy, such as minute-level data for intraday trading or daily and weekly data for swing trading.
- Ensure the data accounts for corporate actions, missing data, and other quality issues that could affect results.
#Step 3: Run the simulation and evaluate the results
- Execute the strategy using backtesting software or your own code with realistic assumptions for brokerage, slippage, and other costs.
- Analyse the trade log, equity curve, drawdowns, returns, and other key metrics to determine whether the strategy is robust enough for live trading.
#Evaluating Backtesting Results
- #Win rate and expectancy: Win rate alone does not reflect true performance; a system can win often and still lose money if losses exceed gains. Combine win rate with average win, average loss, and profit factor to see real expectancy.
- #Drawdown and risk tolerance: Maximum drawdown and drawdown duration indicate how much loss a strategy can inflict and how long recovery may take; both determine whether you can realistically stick with it.
- #Risk-adjusted comparison: Return-to-drawdown, Sharpe, and exposure time let you compare strategies beyond headline returns.
- #Overfitting and over-optimisation: Overfitting happens when a strategy is tuned so tightly to historical data that it captures noise rather than a real edge, often visible as overly complex rules or unstable results across datasets. Endless tweaking adds complexity without improving live performance, so disciplined, data-driven iteration beats constant parameter adjustment.
- #Validation and parameter sensitivity: Splitting data into in-sample and out-of-sample periods, running walk-forward tests, and limiting the number of parameters help confirm the strategy is robust. If performance swings sharply on small input changes, the edge probably depends on specific past conditions rather than something durable.
#What Mistakes Should You Avoid When Backtesting?
#Using unrealistic assumptions
Assuming perfect execution is the classic error: instant fills at the bar's close, no slippage, unlimited liquidity, no partial fills. Letting future information leak into the simulation, using a day's high or low before it has formed, also distorts results.
#Ignoring trading costs and slippage
Bid-ask spreads, brokerage, exchange fees, STT, and price impact all eat into profitability. Leaving them out usually overstates performance, especially for high-frequency and options strategies.
#Overlooking liquidity constraints
A backtest that assumes any size can be traded at any price without moving it produces unrealistic outcomes. Limited market depth or low volume affects real fills.
#Relying on limited historical data
Short windows or testing only favourable periods lead to misleading conclusions. Evaluating a strategy across corrections and different phases improves reliability and reduces regime bias.
#Best Practices for Successful Backtesting
#Testing across multiple market conditions
Deliberately include crisis periods and event-driven selloffs in your window. Segmenting performance by volatility regime, trend direction, or macro environment shows where the strategy is most and least effective. A single return figure can hide variance that only this kind of conditional analysis exposes.
#Keeping the strategy simple and robust
Strategies built on a few well-reasoned rules tend to survive live trading better than heavily parameterised systems fitted to historical noise. A robust strategy stays reasonably stable when you nudge parameters up or down, rather than collapsing outside a narrow sweet spot.
#Documenting results and learning continuously
Record each backtest's rules, parameters, timeframe, instruments, and key metrics. This research log stops you repeating mistakes and tracks how your ideas evolve. Backtesting is not a one-time exercise; strategies that work under one regime can degrade as volatility, liquidity, and participant behaviour shift, so periodic re-evaluation keeps a system aligned with the current market.
Investments in securities markets are subject to market risks. Read all the related documents carefully before investing.
#Conclusion
Backtesting gives you a clearer picture of how a trading strategy would have performed before you risk real money. While it cannot guarantee future profits, it helps you measure consistency, identify potential risks, and understand how a strategy performs across different market conditions. Use realistic assumptions, account for trading costs and slippage, and review your results objectively.
When you're ready to apply a tested strategy, you can open a free Demat account with SMC and access the charts, tools, and market data needed to analyse and execute your trades.

 1800 11 0909
 smc.care@smctradeonline.com