
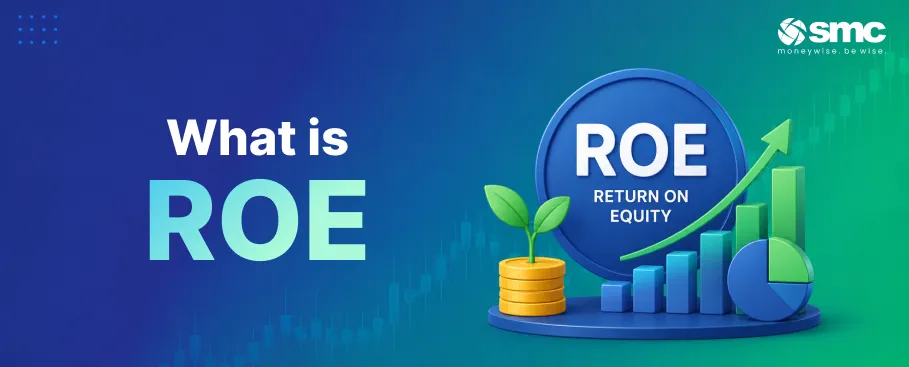


Think of return on equity the way a tenant farmer thinks about land. The land is the shareholders' equity, the harvest is net profit, and ROE asks how much harvest each rupee of land produced this season. That part is easy. The harder part is that two farmers can produce the same harvest from very different soil, rainfall, and borrowed equipment, and two companies can post identical 18% ROEs while doing entirely different things to get there. The DuPont decomposition is what tells them apart: it splits ROE into net margin, asset turnover, and financial leverage, so you stop asking whether an ROE is high and start asking why it is high, which tells you whether the answer is durable or borrowed time.
In this blog, we'll look at how ROE is computed, the DuPont breakdown, how it compares to ROCE and ROA, Indian sector benchmarks, and how to judge ROE quality.
What ROE Measures, the DuPont Decomposition, and How It Compares to ROCE and ROA
ROE measures how efficiently a company converts shareholders' equity into profit. The standard formula is net income attributable to equity shareholders divided by average shareholders' equity (opening plus closing, divided by two). Average equity is used because profits are earned throughout the year. Three calibration choices matter: use net profit after tax, excluding preference dividends; use equity attributable to equity shareholders (not total capital employed); and match the numerator period to the denominator period. The key discipline is consistency.
The DuPont three-factor decomposition rewrites ROE as:
ROE = Net margin × Asset turnover × Equity multiplier
where:
- Net margin (net profit ÷ sales) measures paise of profit per rupee of revenue, high in FMCG and IT services, low in retail and metals.
- Asset turnover (sales ÷ average total assets) measures rupees of sales per rupee of assets; it is high in fast-turning retail and FMCG distributors and low in power, infra, and heavy manufacturing.
- Equity multiplier (average total assets ÷ average equity) measures leverage, very high in banks and NBFCs, so even modest margins and turnover can produce mid-teens ROE.
A simple illustration: net margin 15%, asset turnover 1.5x, equity multiplier 2x produces an ROE of 45% (modest leverage, strong underlying economics). Replace the equity multiplier with 5x, and the same business shows 112% ROE, a warning sign rather than an attractive signal.
Picking the right return metric: ROE has cousins, and the choice matters more in capital-intensive businesses.
- ROE (Return on Equity): best for asset-light sectors (FMCG, IT, consumer) where leverage is broadly similar across peers.
- ROA (Return on Assets): useful where asset intensity is central, NBFCs, real estate, logistics. A bank can show a mid-teens ROE on an RoA of only 1-1.5% because leverage is very high.
- ROCE (Return on Capital Employed): preferable for capital-intensive non-financials (cement, steel, utilities, infra), because it tests whether operations generate returns above the cost of capital, independent of funding. The NSE-EY Cost of Capital Survey puts India's equity-cost estimates at around 13-14%, which anchors the ROE-as-value-creation question.
What ROE ignores: ROE does not reflect the cost of equity; a 15% ROE is only attractive if the cost of equity is materially lower. It ignores the absolute size of the equity base, so thin equity with lots of debt can produce a high ROE on fragile solvency. And it doesn't show capital intensity: a company needing massive incremental capital for growth looks identical on ROE to an asset-light compounder. ROCE and ROA paired with capex fill that gap.
Indian Sector Benchmarks and Common Misconceptions
- FMCG (staples and branded consumer): 25-40%
A peer-reviewed study of Nifty FMCG constituents from FY2011 to FY2022 found an industry-average ROE of 32.18% over 12 years, with Nestlé India at 63.30% and Hindustan Unilever at 78.82%. High structural ROE here is margin-driven and brand-powered, not leverage-driven.
- IT services: 20-35%
TCS posted a consolidated ROE of 51.04% in FY2023-24. For large Indian IT, mid-teens is acceptable, 20-25% is solid, and above 30% indicates an elite franchise, provided margins aren't eroding.
- Banks and financials: 13-18%
The RBI Report on Trend and Progress of Banking in India reports RoE at 13.5% in FY25, and the Ministry of Finance banking dashboard shows major PSBs in the 14-17% range in FY23 and FY24. This ROE sits on very high leverage, so scrutinise asset quality, capital ratios, and RoA alongside it.
- Capital-intensive non-financials: mid-single to low-teens
Typical for utilities, infrastructure, and heavy manufacturing; a sustainably above-12-15 % level is relatively strong. Compare on ROCE versus cost of capital, not headline ROE.
Six common misconceptions
- High ROE is always good: ROE can be high from genuine business strength or from very small equity relative to debt. Flipping the equity-debt mix can double ROE even if profit and total capital are unchanged.
- Debt doesn't matter if ROE is high: Higher leverage mechanically boosts ROE but raises the interest burden and default risk, especially in cyclical sectors.
- Buybacks always create genuine ROE improvement: Buybacks shrink equity, lifting ROE even if profits are flat. That's fine when retiring shares below intrinsic value; otherwise it's cosmetic.
- Negative equity means the company is super-efficient: When accumulated losses or aggressive buybacks drive equity near or below zero, ROE becomes meaningless or wildly volatile.
- One amazing year means ROE has structurally improved: One-off gains (asset sales, tax settlements) can spike PAT and ROE. Multi-year averages and normalised earnings are safer.
- ROE is comparable across any sectors: Asset-light FMCG or IT will almost always beat capital-intensive utilities on ROE, even if both are equally attractive on a risk-adjusted basis.
Judging ROE Quality and Sustainability: A Worked Example
A five-step practical checklist
- Look at a 5- to 10-year ROE history, not a single year: Stable or gently rising ROE over cycles beats spiky behaviour.
- Run a quick DuPont scan: Margin-driven high ROE in FMCG or IT is usually higher quality; leverage-driven high ROE in financials or over-levered industrials is acceptable only if asset quality and interest coverage are strong.
- Cross-check against sector benchmarks: FMCG and IT above 25-30% is impressive but weigh it against valuation; banks in the mid-teens with strong RoA are healthy; an outlier above 20% ROE warrants scrutiny of provisioning. For capital-intensive names, focus on ROCE rather than the cost of capital.
- Relate ROE to reinvestment and growth: Sustainable growth roughly equals ROE × retention ratio, so check whether the company actually has avenues to reinvest at that ROE.
- Overlay capital structure and risk: For non-financials, read net debt/equity, interest coverage, and maturity profile alongside ROE; for financials, combine ROE with RoA, CRAR, and NPA metrics.
Worked example: two companies, both at 18% ROE
Company A is a mid-cap consumer brand: net margin 12%, asset turnover 1.5x, equity multiplier 1.0x → 12% × 1.5 × 1.0 = 18%. The ROE comes entirely from operating margin and asset productivity, with no leverage. Free-cash-flow conversion is strong and the balance sheet is debt-free.
Company B is a mid-tier NBFC: net margin 18%, asset turnover 0.10x, equity multiplier 10x → 18% × 0.10 × 10 = 18%. Identical headline ROE, but built on thin asset productivity multiplied by significant leverage. The business is sensitive to credit cycles, interest-rate moves, and regulatory capital requirements in a way Company A is not.
Without DuPont, both look identical. With DuPont, the right valuation discount and risk premium become visible; the metric stops being a screen for "good companies" and becomes a diagnostic for what kind of good company is in front of you, and whether that kind is worth owning at today's price.
Investments in securities markets are subject to market risks. Read all the related documents carefully before investing.
Conclusion
ROE tells you how hard a company works each rupee of shareholder equity, but the single number hides as much as it reveals. Decompose it using DuPont into margin, turnover, and leverage; compare it against the right sector benchmark; and check a 5- to 10-year trend before trusting it. A margin-driven ROE in an asset-light business is a different animal from the same ROE built on leverage, and knowing which one you're looking at is what turns a screen into a judgement.
To run this analysis across your holdings, you can open a Demat account with SMC.

 1800 11 0909
 smc.care@smctradeonline.com