
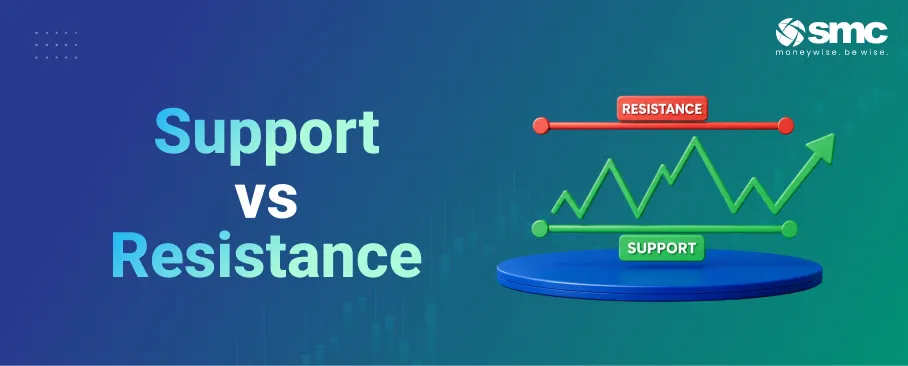


Support and resistance are price zones where buying or selling pressure has repeatedly been strong enough to slow, stop, or reverse a market move. Support forms where buying interest tends to emerge as prices fall, while resistance forms where selling pressure tends to increase as prices rise. Traders use these levels to plan entries, exits, stop-losses, and potential breakout trades.
The strength of a level depends on factors such as prior price action, trading volume, time frame, and whether the market has confirmed a breakout or reversal.
In this blog, we'll look at how to identify support and resistance, what makes certain levels stronger, how traders use them for bounce and breakout setups, and how these levels behave in the Indian market.
What is support and resistance?
Support is a price zone where a falling stock tends to stop and bounce back because buying interest grows strong enough to absorb the selling pressure. Resistance is the reverse: a price zone where a rising stock tends to stall, because sellers step in and cap the advance. It helps to treat both as zones rather than exact lines, since price usually reacts around a level rather than at a precise number.
These levels form for a few practical reasons. Large buy and sell orders often cluster at specific prices, which can slow or reverse a move when price arrives there. Traders also remember where a stock turned before and place fresh orders around those points. And because so many people watch the same published levels, their orders can produce the reversal on their own.
How to identify support and resistance levels
The most common way to mark support and resistance is to study recent swing points on the chart. Recent swing highs and lows can provide potential resistance and support levels, particularly when price has reacted around them more than once. Prior consolidation zones work similarly: when a stock moves sideways in a tight band for a while, the upper and lower edges of that band often become resistance and support once price finally breaks out of the range.
Round numbers matter too. Levels such as Nifty 50 at 24,000, 24,500, or 25,000 tend to attract order flow simply because traders prefer round figures, so price often reacts around them even without any other signal.
A few methods track levels that move with price:
- #Moving averages: A moving average plots the running average of recent prices, so it tends to slope with the trend. Prices approaching the average from above or below often react as they would at a fixed level, which is why traders watch popular averages closely.
- #Pivot points: These are calculated from the previous session's high, low, and close, using the formula P = (High + Low + Close) / 3, with the first support and resistance derived from that pivot. Traders use them mainly for intraday levels, which are recalculated each day.
- #Volume profile: Volume profile plots how much volume traded at each price rather than over time. The price with the highest traded volume, called the Point of Control, tends to act as a magnet and a strong reference level.
What makes a level strong
Not every level carries the same weight. The more times a level has been tested and held, the more traders pay attention to it, and the more likely it is to react again. Levels on higher-timeframe charts, such as daily or weekly, are watched by more participants than a level on a five-minute chart. Heavy trading volume around a level underscores its importance, as it indicates genuine participation at that price.
One useful idea follows from this. Once a level breaks, it often swaps its function: old resistance becomes new support, and old support becomes new resistance. This role reversal between resistance and support is one of the oldest principles in charting, described as far back as Edwards and Magee's 1948 work. It gives you a practical way to find your next level after a breakout.
Support and resistance trading strategies
Most support and resistance trading falls into two approaches. In a bounce trade, you enter when price reacts off a level in the direction of the trend, placing your stop-loss just beyond the far side of the level so the trade is closed if the level truly gives way. In a breakout trade, you enter once price closes clearly beyond a level, placing your stop back inside the range you just left, since a quick return usually means the breakout is failing.
Your position size in both cases is determined by the distance to your stop-loss. Decide how much you are willing to risk on the trade, then size the position so that a stop being hit costs only that amount, which means a tighter stop allows a larger position for the same risk.
False breakouts are common, so confirmation matters before you commit. Three filters help:
- #Wait for a close: Some traders wait for a candle to close beyond the level rather than treating an intraday move through it as a confirmed breakout.
- #Wait for a retest: Let price pull back to the broken level and hold before you enter, which fits the role-reversal idea.
- #Check volume: Higher-than-average volume can provide additional confirmation for a breakout, although it does not guarantee that the move will hold.
Support and resistance in the Indian market
A few features of the Indian market shape how these levels behave. SEBI applies daily price bands, or circuit limits, of 2%, 5%, 10%, or 20% on individual cash-segment stocks. Stocks that have listed futures and options are exempt from these individual filters. So a non-F&O stock can get stuck at its circuit limit for the day rather than genuinely testing a chart level, worth knowing before you plan a trade around one.
At the index level, separate market-wide circuit breakers apply to the Nifty 50 and Sensex at 10%, 15%, and 20% moves from the previous close, halting trading across the market for a set period. On the chart itself, round-number index levels such as 24,000 and 25,000 on the Nifty 50 have repeatedly acted as psychological support and resistance that traders watch closely. These index levels are shared here to explain the concept and are not trading recommendations.
Conclusion
Support and resistance won't tell you the exact price at which a stock will turn, but they give you a clear framework for where to act and where to place a stop. Start by marking a few levels on the charts you follow and watch how price behaves around them, adding confirmation before you trade a break.
As your reading of these zones improves, you can open a demat account with SMC and put the levels to work on your own trades.
Investments in securities markets are subject to market risks. Read all the related documents carefully before investing.



 1800 11 0909
 smc.care@smctradeonline.com