
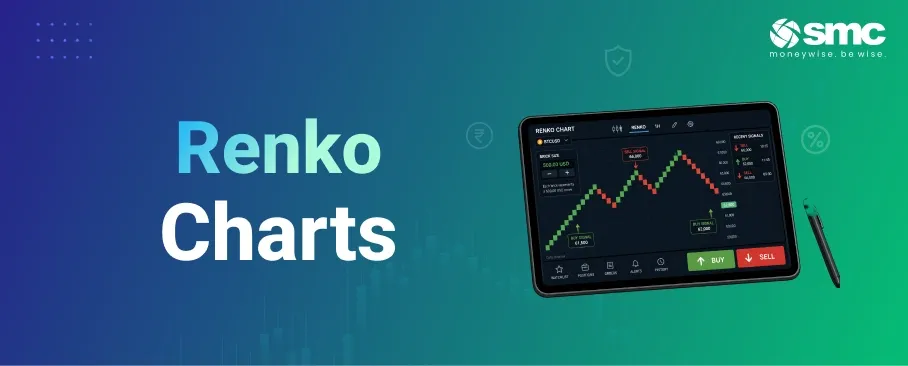


Charts are important for traders to understand price movements and make informed trading decisions. Among the different types of charts available, Renko charts are known for their simple, visually clear representation of price movements. Unlike conventional candlestick or bar charts, Renko charts focus primarily on price movement rather than fixed time intervals, helping filter out smaller price fluctuations.
Whether you are a new or experienced trader, understanding what a Renko chart is, how it is constructed and how to interpret its patterns can help you analyse market trends more effectively.
#What is a Renko Chart?
A Renko chart is a price chart constructed based on a predetermined amount of price movement rather than a fixed time interval. Unlike candlestick or bar charts, Renko charts are made up of “bricks”, with each brick representing a specified amount of price movement.
For example, if the brick size is set to 10 points, a new upward brick is formed when the price moves up by the required amount. Similarly, a downward brick is formed when the price moves by the specified amount in the opposite direction.
The exact rules for forming a new brick and reversing direction can vary depending on the platform and the Renko settings used. In many traditional Renko implementations, a reversal requires a larger move than a continuation brick.
The primary purpose of Renko charts is to make broader price trends easier to identify by filtering out smaller movements. This can help traders focus on the direction and magnitude of price movement rather than every short-term fluctuation.
#Renko Chart Patterns
Similar to candlestick charts, Renko chart patterns can help traders interpret market behaviour. Some commonly observed patterns include:
- #Trend Continuation Bricks: A sequence of bricks moving in the same direction can indicate that the prevailing trend has momentum.
- #Reversal Bricks: A new brick moving in the opposite direction may indicate a potential trend reversal. Traders should confirm the move rather than treating a single reversal brick as a guaranteed signal.
- #Support and Resistance: Renko charts can help highlight areas where price repeatedly changes direction, which may act as potential support or resistance.
Understanding these patterns can help traders assess the prevailing trend and potential changes in market direction.
#Renko Chart Strategy
A Renko chart strategy is often used to filter out smaller price movements and focus on broader trends. Some commonly used approaches include:
- #Trend Following Strategy: Traders may look to enter in the direction of an established trend when a new Renko brick confirms continued movement.
- #Breakout Strategy: When Renko bricks begin forming beyond an established support or resistance area, traders may interpret this as a potential breakout and look for confirmation before entering a trade.
- #Moving Average with Renko: Moving averages can be used alongside Renko charts to identify the broader trend and provide additional confirmation for potential entries or exits.
- #Swing Trading Strategy: Traders may use changes in Renko direction around key support and resistance levels to identify potential swing trading opportunities.
The appropriate Renko trading strategy depends on the asset, brick size, trading timeframe and the trader's risk-management approach. Renko charts can be applied across markets such as equities, currencies and commodities, although their usefulness and construction can vary across platforms and instruments.
#Renko Chart Analysis
Analysing Renko charts can be relatively straightforward because the chart focuses on price movement rather than displaying a new brick at every fixed time interval. Traders can primarily assess whether the price structure is moving upward, downward or within a range.
Here is a typical approach to Renko chart analysis:
- #Consecutive Green Bricks: A series of upward bricks can indicate an uptrend, while consecutive red bricks can indicate a downtrend.
- #Identifying Reversals: A change in the direction of the bricks can signal a potential trend reversal. However, the brick size and reversal rules should be considered before interpreting the signal.
- #Providing Confirmation: Traders may use Renko charts alongside indicators such as RSI, MACD or moving averages to seek additional confirmation for potential entry and exit points.
- #Filtering Smaller Movements: By requiring a specified price movement before a new brick appears, Renko charts filter out smaller fluctuations. However, this does not mean they eliminate false signals or market risk.
One of the main advantages of Renko charts is that they can present price trends in a visually simplified manner. At the same time, filtering price movements means some information available on conventional charts is not displayed.
#Benefits of Renko Charts
These features make Renko charts useful for traders who prefer a simplified view of price trends.
#1. Filters Market Noise
Renko charts filter out price movements that are smaller than the selected brick size. This can make broader trends easier to identify.
#2. Simple and Easy to Read
The brick-based structure makes it relatively easy to identify the broad direction of price movement without focusing on every individual candle.
#3. Clear Trend Identification
Renko charts can provide a cleaner visual representation of sustained trends than conventional candlestick or bar charts.
#4. Works Well with Indicators
Moving averages, RSI and MACD can be used alongside Renko charts as additional analytical tools. These indicators should be treated as confirmation tools rather than guarantees of a trading outcome.
#5. Can Reduce Short-Term Noise
Because a new brick requires a specified price movement, smaller fluctuations may not appear as separate bricks. This can make some short-term price movements less prominent on the chart.
#6. Useful Across Markets
Renko charts can be used to analyse different asset classes, including equities, currencies and commodities. Their availability and specific construction can depend on the trading platform.
#7. Useful for Different Experience Levels
The straightforward visual structure can make Renko charts easier to understand for beginners, while experienced traders can incorporate them into more advanced technical-analysis approaches.
#Tips for Using Renko Charts
Choosing the right settings is important when using Renko charts, as the brick size can significantly affect how the chart looks and how quickly signals appear.
- #Choose an appropriate brick size: A smaller brick size captures more price movements but can make the chart more sensitive to short-term fluctuations. A larger brick size filters out more movement but can result in fewer, potentially later, signals.
- #Use Renko with other indicators: Combining Renko charts with tools such as moving averages, RSI, or MACD can provide additional confirmation rather than relying on a single chart pattern.
- #Practise before trading with real money: Traders new to Renko can first test their approach in a demo or paper-trading environment to understand how different brick sizes and strategies behave.
- #Understand the role of time: Renko charts are primarily price-based and do not display price movement in the same time-based manner as candlestick charts. This means traders should be careful when interpreting trading frequency, timing and indicator signals from a Renko chart.
- #Keep the strategy simple: Renko charts' main strength is their visual simplicity. A straightforward approach combined with appropriate risk management can make the chart easier to use and interpret.
#Limitations of Renko Charts
While Renko charts can simplify trend analysis, traders should also understand their limitations.
#1. Time Information Is Limited
Unlike candlestick charts, Renko charts do not represent a fixed period per brick, such as one minute, one hour, or one day. A brick may form quickly during a volatile market or take much longer during a quiet period.
#2. Some Price Information Is Filtered Out
Because Renko charts only form bricks after the specified price movement is reached, smaller price fluctuations are not represented in the same detail as they are on conventional charts.
#3. Brick Size Matters
The choice of brick size can significantly influence the chart and the signals generated from it. A brick size that is too small may make the chart more sensitive to price fluctuations, while a very large brick size can filter out too much information.
#4. Signals Can Still Be False
Renko charts can help filter short-term market noise, but they do not eliminate false breakouts, reversals or other misleading signals. Traders should use risk management and, where appropriate, additional confirmation.
#5. Platform Calculations May Differ
Different trading platforms can use different methods or data sources to construct Renko charts. Traders should understand how their platform calculates Renko bricks before using them for analysis or trading decisions.
#6. Renko Bricks Are Constructed Price Representations
Renko bricks are constructed from price data rather than representing every actual price movement. Their appearance and signals can therefore differ from conventional charts and may vary depending on the platform, data source and construction method.
#Conclusion
Renko charts provide a simple way for traders to focus on significant price movements and identify broader market trends. By filtering smaller fluctuations and presenting price action through bricks, they can make certain trends and potential reversals easier to visualise.
Whether you are learning Renko chart patterns, exploring a Renko chart strategy, or testing a Renko trading strategy, it is important to understand how brick size, price movements and platform settings affect the chart. Renko charts can be a useful technical-analysis tool, but they should not be viewed as a standalone method for making trading decisions.
If you are interested in learning about trading tools and market analysis, you can explore the resources available from SMC Global Securities.






 1800 11 0909
 smc.care@smctradeonline.com