


When you look at the stock market, individual stocks move up and down every day, but what often matters more to traders is the overall market sentiment. One tool that helps measure this sentiment is the Advance-Decline Ratio (ADR). It shows whether more stocks are moving higher or lower on a given day, helping traders gauge overall market participation. Traders and analysts often rely on this indicator because it provides quick insights into market breadth.
In this blog, let us explore what is ADR in the stock market, how to calculate it, its significance, and the different ways traders interpret this widely used indicator.
What is the Advance Decline Ratio (ADR)?
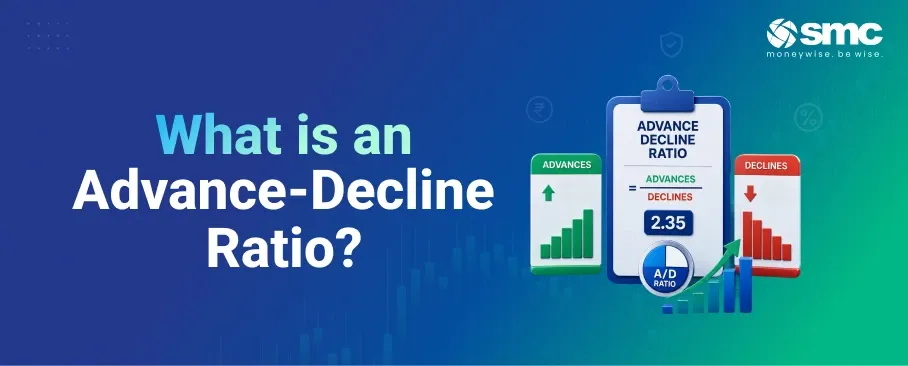
The AdvanceDecline Ratio (ADR) is one of the most commonly used market breadth indicators in technical analysis. It compares the number of advancing stocks to the number of declining stocks in a market.
Advancing stocks are those that closed higher than their previous day's closing price.
Declining stocks are those that closed lower than their previous day's closing price.
ADR answers a simple question: Are more stocks rising or falling?
Once you know the number of advancing and declining stocks, calculating the ratio is straightforward:
ADR = Number of Advancing Stocks ÷ Number of Declining Stocks
By expressing market activity as a ratio rather than absolute numbers, ADR provides a quick snapshot of overall market breadth.
How Does the Advance-Decline Ratio Work?
For example, suppose a market session has 150 advancing stocks and 75 declining stocks.
ADR = 150 ÷ 75 = 2
This means that twice as many stocks rose as fell. Since the ratio is above 1, it indicates positive market breadth, with more stocks participating in the upward move.
Traders often use ADR to:
Check whether a rally is broad-based or driven by only a few large stocks.
Spot early signs of weakening momentum when the ratio falls, even though the index remains strong.
Monitor potential shifts in trend when ADR values consistently move in one direction.
Some traders also compare the NSE advanced-decline ratio with the performance of major indices to determine whether the rally reflects genuine market strength or is being driven by a handful of heavyweight stocks.
AdvanceDecline Indicator and Market Sentiment
Another widely used market breadth indicator is the Advance-Decline Line (A/D Line). Unlike the Advance-Decline Ratio, the A/D Line tracks the cumulative difference between advancing and declining stocks over time. Analysts use it to validate price movements in major market indices.
A rising Advance-Decline Line shows increasing participation in upward moves.
A falling AdvanceDecline Line signals weakening market participation, with more stocks moving lower.
If the market index climbs while the A/D Line weakens, the divergence may indicate a possible trend reversal.
By analysing the AdvanceDecline Line across different timeframes, daily, weekly, or monthly, investors can better understand the strength of the broader market trend.
Types of Advance-Decline Ratios
There are two main ways traders use ADR.
1. As a Standalone Number
High ADR: Suggests more stocks are advancing and is often associated with strong market momentum.
Low ADR: Suggests more stocks are declining and is often associated with weak market sentiment.
2. By Studying Trends
Increasing ADR over time may indicate improving market sentiment.
Decreasing ADR over time may suggest weakening market participation.
This flexibility makes ADR useful for both short-term traders and long-term market analysts.
Advance-Decline Line Formula
Another popular market breadth tool is the AdvanceDecline Line (A/D Line).
Instead of using a ratio, it measures the cumulative difference between advancing and declining stocks.
Formula:
A/D Line = Previous A/D Line + Net Advances
Where,
Net Advances = Advancing Stocks − Declining Stocks
The A/D Line provides a visual representation of whether the majority of stocks are trending upward or downward over time.
Let’s understand this with an example.
Suppose on a given trading day:
200 stocks advanced.
100 stocks declined.
Net Advances = 200 − 100 = 100
If yesterday's A/D Line value was 2,500:
Today's A/D Line = 2,500 + 100 = 2,600
How to Calculate the Advance-Decline Line
You can calculate the A/D Line by following these steps.
Step 1. Count the number of advancing stocks.
Step 2. Count the number of declining stocks.
Step 3. Calculate Net Advances by subtracting declining stocks from advancing stocks.
Step 4. Add the Net Advances to the previous day's A/D Line value.
Step 5. Repeat this process daily to build a continuous line.
Over time, the A/D Line helps show whether market participation supports the overall trend.
What Can You Learn from the Advance-Decline Line?
The Advance-Decline Line helps confirm whether market rallies or declines are supported by broad participation.
- If the A/D Line rises alongside the market index, it suggests broad market participation.
- If the market index rises while the A/D Line declines, it indicates narrowing participation and may signal weakening momentum.
- Divergences between the market index and the A/D Line often prompt traders to watch for potential trend reversals.
ADR vs Arms Index (TRIN)
Although both are market breadth indicators, they serve different purposes.
AdvanceDecline Ratio (ADR): Compares the number of advancing and declining stocks.
Arms Index (TRIN): Combines the advanced-decline ratio with advancing and declining trading volumes, providing a more comprehensive view of market breadth.
Many traders use both indicators together to understand market conditions better.
Limitations of the Advance-Decline Ratio
Like any technical indicator, ADR has certain limitations:
- It gives equal weight to every stock, regardless of market capitalisation.
- Exchanges with many small-cap stocks may produce more volatile readings.
- ADR should not be used in isolation and works best alongside other technical indicators and price analysis.
- It provides a snapshot of a single trading session rather than a long-term trend.
Conclusion
The Advance-Decline Ratio is a simple yet effective way to measure market breadth. Comparing advancing and declining stocks helps traders assess whether a market trend is supported by broad participation or driven by only a handful of stocks.
While ADR and the Advance-Decline Line offer valuable insights into market strength and potential trend reversals, they work best when used alongside other technical indicators and price analysis.
To apply market breadth indicators like ADR in real trading scenarios, you can open a Demat account with SMC Global Securities and begin your investing journey with confidence.







 1800 11 0909
 smc.care@smctradeonline.com