


When it comes to investing, earning high returns is only one part of the equation. It is equally important to understand how much risk you are taking to generate those returns. This is where the Sharpe ratio can help.
The Sharpe ratio is a widely used risk-adjusted performance measure that helps investors understand how much excess return an investment has generated relative to the volatility taken to earn that return. It can be useful when evaluating mutual funds, portfolios, ETFs, and other investments.
In this article, we'll understand what the Sharpe ratio is, how the Sharpe ratio formula works, how to interpret it, and how investors can use it when comparing investments.
#What Is Sharpe Ratio?
The Sharpe ratio is a financial metric used to measure the risk-adjusted performance of an investment. In simple terms, it shows how much excess return an investment has generated for each unit of total risk or volatility.
The ratio was developed by William F. Sharpe, who received the Nobel Memorial Prize in Economic Sciences in 1990 for his work in financial economics.
A higher Sharpe ratio generally indicates that an investment has generated greater excess returns relative to its volatility. However, the ratio should not be viewed in isolation. It is most useful when comparing similar investments over the same period and using a consistent calculation methodology.
For example, if two mutual funds belong to the same category and have been evaluated over the same period, the fund with the higher Sharpe ratio has generally delivered better risk-adjusted performance during that period.
#Sharpe Ratio Formula
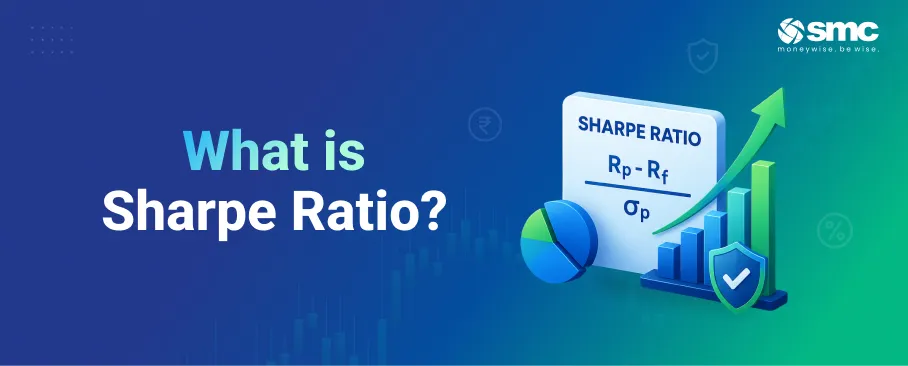
The standard Sharpe ratio formula is:
#Sharpe Ratio = (Investment Return − Risk-Free Rate) ÷ Standard Deviation of Investment Returns
Let's understand the components:
#Investment Return
This is the return generated by the investment or portfolio over the period being analysed.
#Risk-Free Rate
The risk-free rate represents the return that could theoretically be earned from an investment with minimal credit risk. In practice, government securities are commonly used as a reference for the risk-free rate.
#Standard Deviation
Standard deviation measures the variability of investment returns. A higher standard deviation indicates greater fluctuations in returns and therefore higher total volatility.
The Sharpe ratio therefore compares the investment's excess return with the volatility experienced to generate that return.
#Example to Understand the Sharpe Ratio
Suppose a mutual fund generates an annual return of 10%. Assume the applicable risk-free rate is 3%, while the standard deviation of the fund's returns is 7%.
Using the Sharpe ratio formula:
#Sharpe Ratio = (10% − 3%) ÷ 7%
#= 7% ÷ 7%
= 1
Therefore, the Sharpe ratio is 1.
This means the investment generated one unit of excess return for every unit of volatility measured by standard deviation.
However, a Sharpe ratio of 1 should not automatically be labelled as "good" or "bad." Its interpretation depends on factors such as the investment category, time period, benchmark, and the Sharpe ratios of comparable investments.
#What Is a Good Sharpe Ratio?
There is no universally accepted Sharpe ratio level that makes an investment good or bad.
You may come across general rules of thumb suggesting that a Sharpe ratio above 1 is good, above 2 is very good, and above 3 is excellent. However, these should not be treated as fixed industry standards.
For a meaningful comparison, you should consider:
- Whether the investments belong to the same category
- Whether the same time period is being considered
- Whether the calculation methodology is consistent
- The prevailing market conditions
- The investment's objective and risk profile
For example, if two equity mutual funds have Sharpe ratios of 1.5 and 0.9 over the same period, the first fund has generated a higher excess return relative to its total volatility during that period. This does not, by itself, mean that the fund is guaranteed to perform better in the future.
#Importance of Sharpe Ratio in Mutual Funds
The Sharpe ratio in mutual funds can help investors evaluate performance beyond absolute returns.
Suppose Fund A and Fund B both generate an annual return of 12%. At first glance, both funds appear equally attractive. However, if Fund A has a higher Sharpe ratio than Fund B over the same period, it indicates that Fund A generated its excess return with lower volatility relative to the return generated.
This can provide additional information when comparing mutual funds within the same category.
The Sharpe ratio can therefore help investors:
- Compare risk-adjusted performance
- Understand the relationship between returns and volatility
- Evaluate funds beyond their absolute returns
- Compare similar funds using a common risk-adjusted measure
However, it should be considered alongside other factors such as investment objective, portfolio composition, consistency of performance, expense ratio, downside risk, and the fund's overall suitability for the investor.
#How Investors Can Use Sharpe Ratio to Compare Mutual Funds
Suppose you are comparing five mutual funds from the same category and over the same period:
Fund C has the highest Sharpe ratio among these five funds. This indicates that it generated the highest excess return relative to its total volatility during the period considered.
However, investors should not select Fund C solely because it has the highest Sharpe ratio. They should also examine the fund's investment objective, portfolio quality, consistency, expense ratio, downside risk, and suitability for their financial goals.
Most mutual fund fact sheets and investment research platforms provide risk measures such as the Sharpe ratio, allowing investors to compare funds without calculating the ratio themselves.
#Limitations of the Sharpe Ratio
Although the Sharpe ratio is useful, it has several limitations.
#1. It Relies on Historical Data
Sharpe ratio calculations generally use historical returns and volatility. Past performance does not guarantee future results.
#2. It Does Not Distinguish Between Good and Bad Volatility
The Sharpe ratio uses standard deviation as its measure of risk. This means both positive and negative fluctuations contribute to volatility.
For investors specifically concerned about downside risk, the Sortino ratio may provide additional information, as it focuses on downside volatility.
#3. It Can Be Affected by the Time Period
The Sharpe ratio can vary depending on the return period and frequency used in the calculation. Therefore, comparisons should ideally use the same time frame and methodology.
#4. It May Be Less Informative for Non-Normal Return Patterns
Standard deviation may not fully capture the risk of investments with returns that are significantly skewed or exhibit extreme outcomes. In such cases, investors may need to consider additional risk measures.
#5. It Should Not Be Used in Isolation
A high Sharpe ratio does not automatically make an investment suitable for every investor. The fund's investment objective, portfolio composition, liquidity, downside risk, costs, and the investor's risk appetite should also be considered.
#Sharpe Ratio vs Other Risk-Adjusted Ratios
The Sharpe ratio is not the only measure used to evaluate risk-adjusted performance. Two other commonly used measures are the Sortino ratio and Treynor ratio.
The Sharpe ratio considers both upward and downward fluctuations because it uses standard deviation. The Sortino ratio focuses specifically on downside volatility, while the Treynor ratio considers systematic or market-related risk.
Therefore, investors can use these measures together rather than relying on a single ratio.
#How to Use Sharpe Ratio When Selecting a Mutual Fund
The Sharpe ratio can be useful when comparing mutual funds, but it should be treated as one of several factors in the investment decision.
Before selecting a fund, consider the following:
#1. Compare Funds Within the Same Category
Comparing an equity fund with a debt fund based solely on their Sharpe ratios may not yield a meaningful conclusion, as their risk and return characteristics differ.
#2. Use the Same Time Period
Compare Sharpe ratios calculated over the same period and, ideally, using the same methodology.
#3. Look Beyond the Ratio
Check the fund's investment objective, portfolio composition, expense ratio, consistency of performance, downside risk and benchmark performance.
#4. Consider Your Risk Profile
A fund with a high historical Sharpe ratio may still be unsuitable if its investment strategy does not match your financial goals or risk tolerance.
#5. Don't Treat It as a Return Forecast
The Sharpe ratio describes historical risk-adjusted performance. It does not predict future returns.
#Sharpe Ratio in Mutual Fund Analysis
Mutual fund investors can find the Sharpe ratio in fund fact sheets and performance reports. It is generally presented alongside other risk measures such as standard deviation, beta and other portfolio-related information.
Using these metrics together can provide a more complete picture of a fund's historical risk and performance.
For example, a fund may have generated strong returns but also experienced significant volatility. Looking only at returns could make the fund appear attractive, while its Sharpe ratio provides additional context about the risk taken to generate those returns.
#Key Points to Remember About Sharpe Ratio
- The Sharpe ratio measures risk-adjusted performance.
- It compares excess return with total volatility.
- A higher ratio generally indicates better historical risk-adjusted performance, all else being equal.
- There is no universally applicable threshold for what constitutes a "good" Sharpe ratio.
- Comparisons are more meaningful between similar investments and over the same period.
- It does not guarantee future performance.
- It should be used alongside other investment and risk measures.
#Conclusion
The Sharpe ratio is a useful tool for understanding how much excess return an investment has generated relative to the volatility taken to achieve it. It helps investors look beyond headline returns and compare the historical risk-adjusted performance of similar mutual funds or portfolios.
However, the Sharpe ratio should not be used as a standalone measure when selecting an investment. Factors such as investment objective, portfolio composition, consistency, costs, downside risk, benchmark performance and personal risk tolerance also matter.
By combining the Sharpe ratio with other financial metrics and a clear understanding of your investment goals, you can make more informed investment decisions.
Investors can explore mutual funds and other investment options through SMC Global Securities while considering their individual financial objectives and risk appetite.






 1800 11 0909
 smc.care@smctradeonline.com