2020 : Issue 718, Week : 13th - 17th January
A Weekly Update from SMC (For private circulation only)
WISE M NEY
NEY

2020 : Issue 718, Week : 13th - 17th January
A Weekly Update from SMC (For private circulation only)
NEY


| Equity | 4-7 |
| Derivatives | 8-9 |
| Commodity | 10-13 |
| Currency | 14 |
| IPO | 15 |
| FD Monitor | 16 |
| Mutual Fund | 17-18 |
I
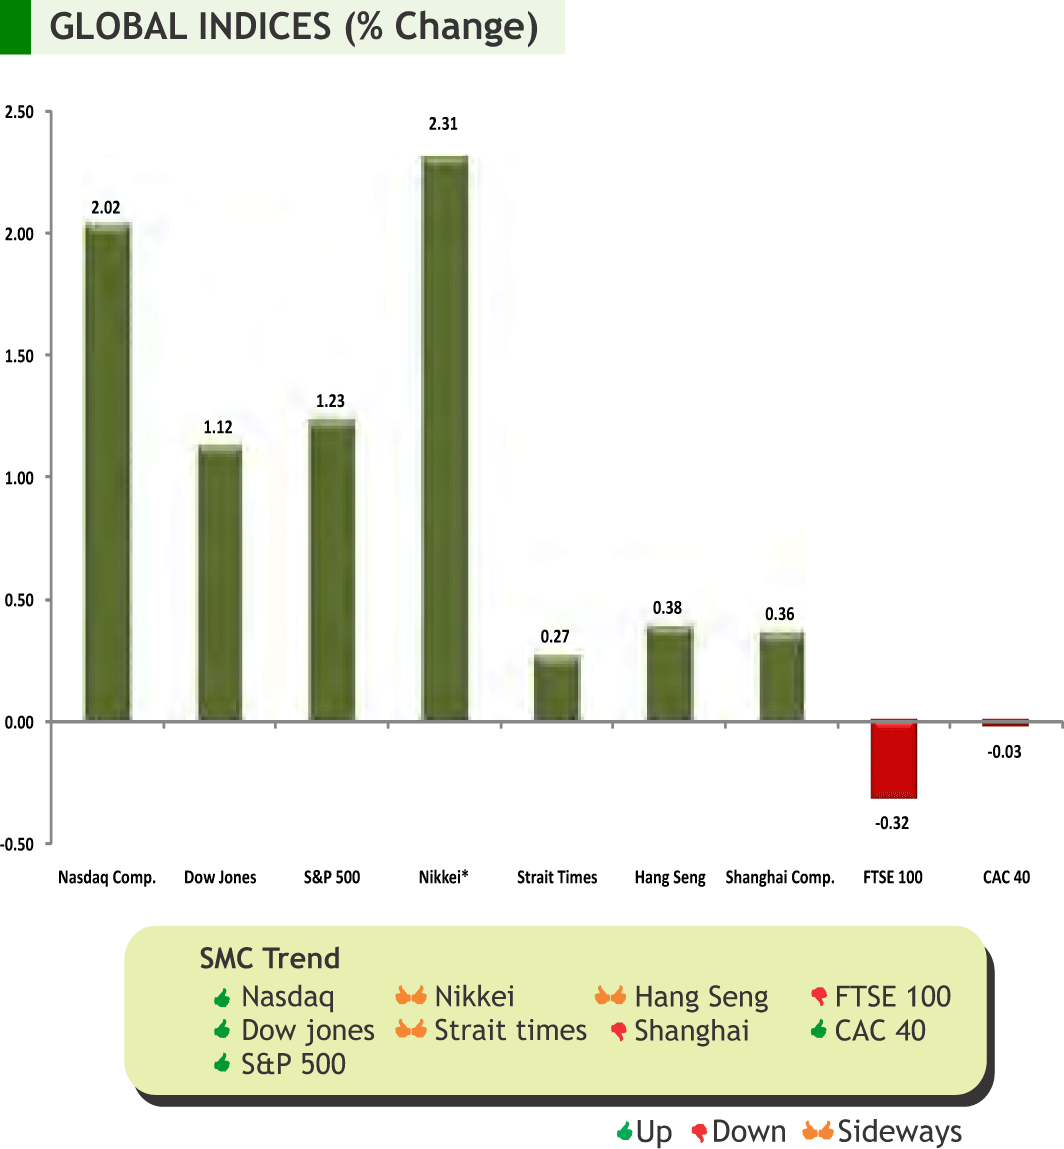
n the week gone by, global markets witnessed a volatile trade but in the later part I of the week markets continued to rally after the United States and Iran appeared to step away from the edge of war and optimism about a U.S.-China trade deal firmed . Undoubtedly, it was a sharp turnaround from earlier days, when markets tumbled on the threat of war after the United States killed a top Iranian general in a drone strike. Meanwhile, Japanese household spending fell for a second straight month in November suggesting that higher sales taxes may weigh on private consumption for some time.
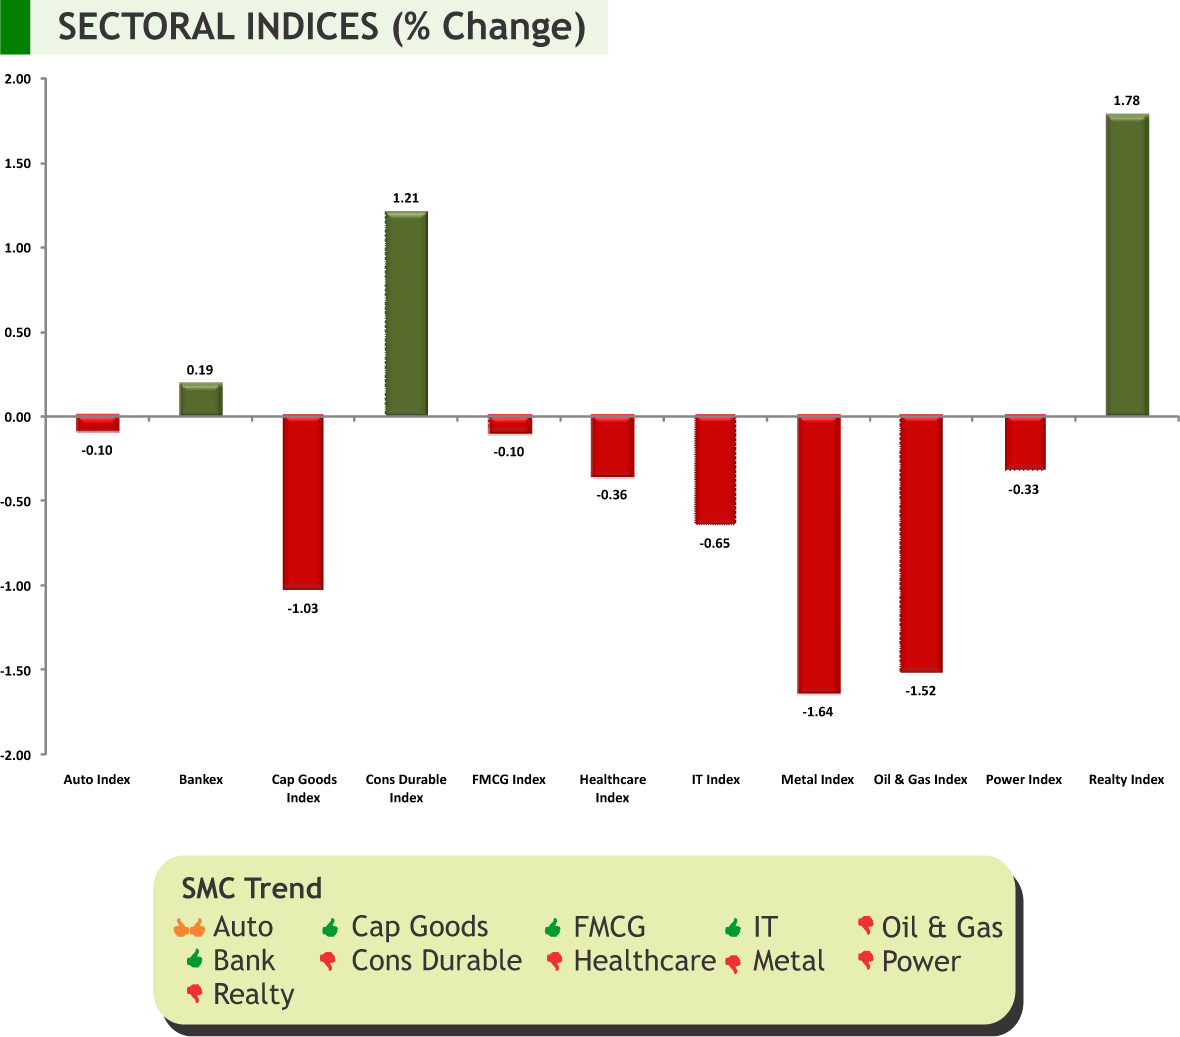
Back home, domestic markets, despite volatility, moved higher tracking overseas trend amid no further fresh escalation in geopolitical conflicts in the Middle East. The US President Donald Trump’s soothing tone in an address from the White House helped the sentiments back home. A plunge in oil prices in the international markets cheered domestic investors. Market also moved higher on expectation that the government would announce some bolder announcement in the upcoming budget to spur the growth in the economy. Meanwhile, it could be seen that steel, power and mining sector got boosted after the government opened up coal mining to non-coal companies and removed restriction on end-use of the fuel. The rupee too advanced as global markets stabilised after the US and Iran toned down their war rhetoric. With the onset of the earnings season, investors are betting on the December quarter results to benefit from the cut in corporate tax. Investors looked hopeful of better quarterly earnings especially from sectors like banking, IT and FMCG. The current quarter earnings are important as a lot of companies have been betting on a better earnings environment in the second half of Fy20.
On the commodity market front, the year 2020 started with bang; knee jerk reaction was witnessed everywhere as financial market reacted on US and Iran war tension. For the time being, market ignored the positive economic data and scheduled sign on first phase of trade deal. Bullion counter is witnessing huge volatility amid the geopolitical tensions in Middle East. Gold may further dip towards 39200 levels by facing resistance near 41000 levels whereas silver may decline towards 46000 levels while taking resistance near 48500 levels. Crude oil prices may witness further selling pressure as the threat of war in the Middle East, a major oil producing region receded and investors switched their attention to economic growth prospects and demand for crude. Base metal counter may remain on positive path on easing of geopolitical tensions and as US and China are expected to sign phase 1 trade deal this week. New Yuan Loans and GDP of China¸ CPI and Consumer Price Index Ex Food, Energy, Retail Sales Advance and U. of Mich. Sentiment of US, German GDP, CPI of UK, etc are few important triggers for commodity trade.

SMC Global Securities Ltd. (hereinafter referred to as “SMC”) is a registered Member of National Stock Exchange of India Limited, Bombay Stock Exchange Limited and its associate is member of MCX stock Exchange Limited. It is also registered as a Depository Participant with CDSL and NSDL. Its associates merchant banker and Portfolio Manager are registered with SEBI and NBFC registered with RBI. It also has registration with AMFI as a Mutual Fund Distributor.
SMC is a SEBI registered Research Analyst having registration number INH100001849. SMC or its associates has not been debarred/ suspended by SEBI or any other regulatory authority for accessing /dealing in securities market.
SMC or its associates including its relatives/analyst do not hold any financial interest/beneficial ownership of more than 1% in the company covered by Analyst. SMC or its associates and relatives does not have any material conflict of interest. SMC or its associates/analyst has not received any compensation from the company covered by Analyst during the past twelve months. The subject company has not been a client of SMC during the past twelve months. SMC or its associates has not received any compensation or other benefits from the company covered by analyst or third party in connection with the research report. The Analyst has not served as an officer, director or employee of company covered by Analyst and SMC has not been engaged in market making activity of the company covered by Analyst.
The views expressed are based solely on information available publicly available/internal data/ other reliable sources believed to be true.
SMC does not represent/ provide any warranty express or implied to the accuracy, contents or views expressed herein and investors are advised to independently evaluate the market conditions/risks involved before making any investment decision.
DOMESTIC NEWS
Economy
• The Indian government released its advance economic growth estimate for the fiscal year ending in March, that showed the pace of expansion slowing sharply. Gross domestic product growth is set to come in at 5.0 percent in the 2019-20 fiscal year versus 6.8 percent in the 2018-19 period.
Information Technology
• Tata Consultancy Services has extended partnership with Vipps AS, Norway's leading player in the payments and identification segment, to leverage TCS' Machine First™ Delivery Model (MFDM™) and cloud services to accelerate the latter's growth and digital journey.
• Tata Consultancy Services has been recognized as a Leader in the NelsonHall NEAT for Agile DevOps and Automated Development services. TCS' organization-wide focus on instilling agile principles, end-to-end DevOps platforms, and large, distributed scaled agile delivery experience, were cited as strengths.
Cables
• Sterlite Global Venture (Mauritius), a wholly owned subsidiary of Sterlite Technologies, has entered into definitive agreements to acquire 12.8% stake (on issued and outstanding basis) in Israel based ASOCS, developer of open, disruptive and virtualized Radio Access Network (vRAN) solutions, delivering 4G and 5G for cellular networks.
Automobile
• Ashok Leyland and ABB Power Products and Systems India have signed a Memorandum of Understanding (MoU) in the public e-mobility space, to expand the ecosystem for efficient and greener electric bus transportation systems in India. The MoU outlines a partnership to develop a pilot electric bus based on ABB's innovative flash-charge technology, TOSA, which tops up the battery in just seconds while passengers get on and off the bus. This avoids the need to take the vehicle out of service for recharging every few hours or having a replacement bus ready, thus minimizing the size of the fleet while increasing passenger carrying capacity.
• Mahindra & Mahindra (M&M) is looking to introduce an affordable electric vehicle priced below Rs 9 lakh to expand its offerings in the shared mobility segment.
Finance
• Housing Development Finance Corporation has completed the acquisition of 50.80% share of Apollo Hospital Group, in Apollo Munich Health Insurance Company (Apollo Munich) for Rs 1485.14 crore and 0.36% shareholding held by employees for Rs 10.67 crore. The acquisition was approved by the Competition Commission of India, the Reserve Bank of India, and the Insurance Regulatory and Development Authority of India. Subsequent to the approval, Apollo Munich has been renamed as HDFC ERGO Health Insurance and will operate as a subsidiary of HDFC.
Bank
• State Bank of India announced Residential Builder Finance with Buyer Guarantee (RBBG) to safeguard home buyers financially by issuing guarantee for completion of projects to customers availing SBI Home Loans.
Pharmaceuticals
• Glenmark Pharmaceuticals has got final approval from the US health regulator for Deferasirox tablets for oral suspension. The tablet is used to treat high levels of iron in the body caused by multiple blood transfusions.
• Sun Pharmaceuticals is now looking at new markets to fire the company's growth engine. The Gujarati businessman started his entrepreneurial journey from Kolkata with about Rs 10,000 nearly four decades ago.
INTERNATIONAL NEWS
• US initial jobless claims dropped to 214,000, a decrease of 9,000 from the previous week's revised level of 223,000. Economists had expected jobless claims to edge down to 220,000 from the 222,000 originally reported for the previous week.
• US factory orders fell by 0.7 percent in November after inching up by a downwardly revised 0.2 percent in October. Economists had expected orders to drop by 0.8 percent compared to the 0.3 percent increase originally reported for the previous month.
• US trade deficit narrowed to $43.1 billion in November from a revised $46.9 billion in October. The trade deficit shrank to its smallest since hitting $42.0 billion in October 2016. Economists had expected the deficit to narrow to $43.8 billion from the $47.2 billion originally reported for the previous month.
• China's Consumer prices advanced 4.5 percent year-on-year in December. The 4.5 percent inflation was the highest since January 2012. The rate was forecast to rise to 4.7 percent in December.
• Japan's consumer confidence index rose to a seasonally adjusted 39.1 in December from 38.7 in November. Economists had expected a score of 39.5.
| Stocks | *Closing Price | Trend | Date Trend Changed | Rate Trend Changed | SUPPORT | RESISTANCE | Closing S/l |
|---|---|---|---|---|---|---|---|
| S&P BSE SENSEX | 41600 | UP | 08.02.19 | 36546 | 36300 | 35300 | |
| NIFTY50 | 12257 | UP | 08.02.19 | 10944 | 10900 | 10600 | |
| NIFTY IT | 15960 | UP | 21.07.17 | 10712 | 15200 | 14800 | |
| NIFTY BANK | 32097 | UP | 30.11.18 | 26863 | 27700 | 27000 | |
| ACC | 1511 | DOWN | 04.10.19 | 1488 | 1520 | 1540 | |
| BHARTIAIRTEL | 457 | UP | 15.03.19 | 338 | 410 | 390 | |
| BPCL | 470 | UP | 30.08.19 | 355 | 470 | 450 | |
| CIPLA | 474 | UP | 25.10.19 | 460 | 450 | 440 | |
| SBIN | 332 | UP | 01.11.19 | 314 | 315 | 305 | |
| HINDALCO | 212 | UP | 13.12.19 | 208 | 200 | 194 | |
| ICICI BANK | 540 | UP | 20.09.19 | 418 | 510 | 500 | INFOSYS | 738 | UP | 20.12.19 | 732 | 710 | 700 |
| ITC | 238 | DOWN | 31.05.19 | 279 | 260 | 270 | |
| L&T | 1325 | DOWN | 15.11.19 | 1378 | 1370 | 1390 | |
| MARUTI | 7331 | UP | 27.12.19 | 7345 | 7000 | 6900 | |
| NTPC | 120 | DOWN | 16.08.19 | 118 | 120 | 124 | |
| ONGC | 124 | DOWN | 06.12.19 | 127 | 136 | 141 | |
| RELIANCE | 1548 | UP | 16.08.19 | 1278 | 1530 | 1500 | |
| TATASTEEL | 486 | UP | 01.11.19 | 396 | 440 | 425 | |
Closing as on 10-01-2020
NOTES:
1) These levels should not be confused with the daily trend sheet, which is sent every morning by e-mail in the name of "Morning Mantra ".
2) Sometimes you will find the stop loss to be too far but if we change the stop loss once, we will find more strength coming into the stock. At the moment, the stop loss will be far as we are seeing the graphs on weekly basis and taking a long-term view and not a short-term view.
| Meeting Date | Company name | Purpose |
|---|---|---|
| 14/01/2020 | Wipro | Quarterly Results,Interim Dividend |
| 14/01/2020 | IndusInd Bank | Quarterly Results |
| 14/01/2020 | Mindtree | Quarterly Results |
| 14/01/2020 | Wipro | Quarterly Results,Interim Dividend |
| 17/01/2020 | HCL Technologies | Quarterly Results,Interim Dividend |
| 17/01/2020 | L&T Fin.Holdings | Quarterly Results |
| 18/01/2020 | HDFC Bank | Quarterly Results |
| 20/01/2020 | Kotak Mah. Bank | Quarterly Results |
| 21/01/2020 | ICICI Pru Life | Quarterly Results |
| 22/01/2020 | Asian Paints | Quarterly Results |
| 22/01/2020 | Larsen & Toubro | Quarterly Results |
| 22/01/2020 | Axis Bank | Quarterly Results |
| 22/01/2020 | RBL Bank | Quarterly Results |
| 23/01/2020 | Cholaman.Inv.&Fn | Quarterly Results |
| 23/01/2020 | Canara Bank | Quarterly Results |
| 23/01/2020 | PVR | Quarterly Results |
| 23/01/2020 | Biocon | Quarterly Results |
| 24/01/2020 | JSW Steel | Quarterly Results |
| 24/01/2020 | Bank of Baroda | Quarterly Results |
| 24/01/2020 | UltraTechCem. | Quarterly Results |
| 25/01/2020 | ICICI Bank | Quarterly Results |
| 27/01/2020 | H D F C | Quarterly Results |
| 27/01/2020 | Dr Reddy's Labs | Quarterly Results |
| 28/01/2020 | M & M Fin. Serv. | Quarterly Results |
| 29/01/2020 | The Ramco Cement | Quarterly Results |
| 29/01/2020 | Tata Power Co. | Quarterly Results |
| 29/01/2020 | PidiliteInds. | Quarterly Results |
| 29/01/2020 | Jubilant Food. | Quarterly Results |
4
5
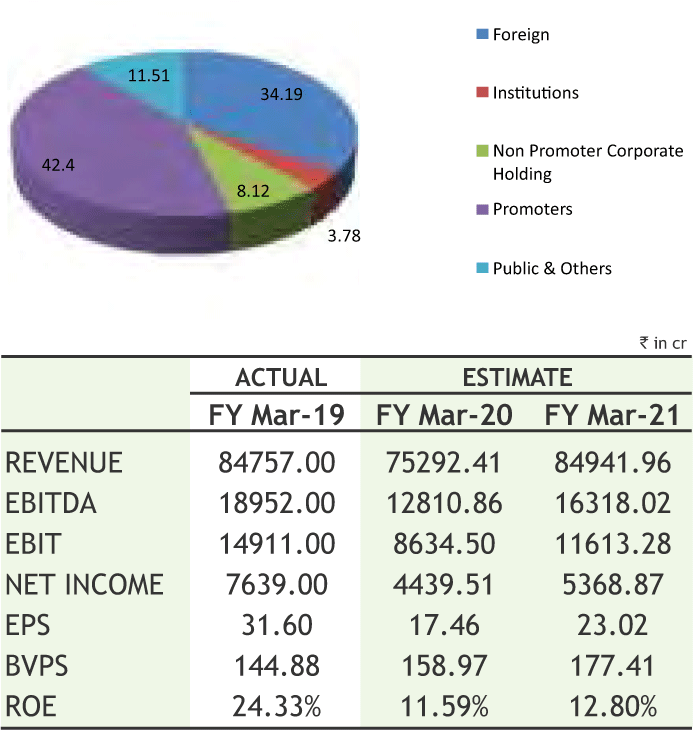
SW STEEL LIMITED
CMP: 278.10
Target Price: 323
Upside: 16%
| Face Value (Rs.) | 1.00 |
| 52 Week High/Low | 313.40/201.90 |
| M.Cap (Rs. in Cr.) | 67222.90 |
| EPS (Rs.) | 27.68 |
| P/E Ratio (times) | 10.05 |
| P/B Ratio (times) | 1.82 |
| Dividend Yield (%) | 1.46 |
| Stock Exchange | BSE |
Investment Rationale
• JSW Steel Ltd. (JSW Steel), the flagship company of the $14 billion JSW Group, is integrated steel major. The Company has an installed capacity of 18 MTPA across seven state-of-the-art manufacturing facilities in India.
• The Company also develops and markets marginaccretive, value-added and special products (VASP), such as Galvanised and Colour Coated products, Special Bars and Special TMT, among several others. They find increasing applications in automobile, construction and appliances industries. The Company also has a strong domestic retail presence, with over 9,500 direct and indirect outlets, and exports to over 100 countries across five continents.
• The management of the company expects steel demand to grow 5% in FY20 and should pick-up in H2FY20 on account of measures announced by Government. Moreover, it expects spreads for H2FY20 to be better on the back of lower input prices and bottomed-out steel prices.
• On the development front, its Dolvi works in Maharashtra has received an in principle approval for eligibility from the Government of Maharashtra for incentives on its investment for expansion from 3.3 MTPA to 5 MTPA. Accordingly, the company has recognized the grant income (investment linked incentive) of Rs. 512 crore during the quarter ended September 30, 2019. The management of the company is targeting capacity expansion to 10MT and expects to commission by March 2020.
• The Odisha government has put 20 mines in the auction out of which five mines are for captive purposes. The company plans to participate in the auction and use the captive sources.
• The Debt/Equity ratio of the company is 1.36:1 in Q2FY20 which is reduced from 1.46:1 in Q2FY19. The management has ensured to reduce the debt in coming quarters and continue further expansions through acquisition of steel units. Moreover, it has capex plan of Rs 48,715 crore by FY 2021-22 to increase installed capacity to 24 MTPA from the current 18 MTPA.
Risk
• Governance and regulatory issues
• Global slowdown in demand
Valuation
The management of the company expects expansion in the international market by diversifying its product portfolio. It has plans to reduce debt which would improve margins against its peers. Moreover, the management has ensured that demand in automotive sector and domestic sales would rebound the returns with healthy top line growth. Thus, it is expected that the stock will see a price target of Rs.323 in 8 to 10 months time frame on a one year average P/Bvx of 1.82x and FY21 BVPS of Rs.177.41.
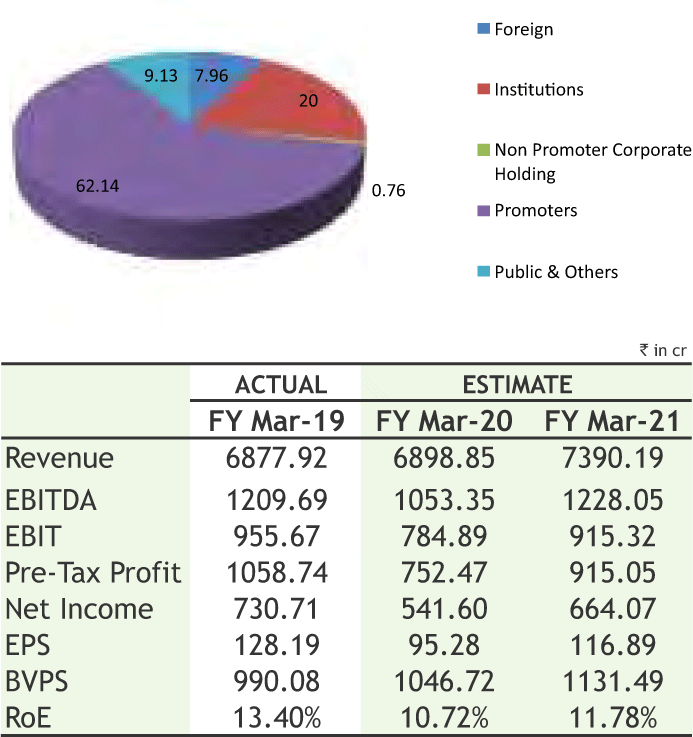
VARDHMAN TEXTILE LIMITED
CMP: 382.90
Target Price: 1151
Upside: 19%
| Face Value (Rs.) | 10.00 |
| 52 Week High/Low | 1154.00/849.20 |
| M.Cap (Rs. in Cr.) | 5576.73 |
| EPS (Rs.) | 105.67 |
| P/E Ratio (times) | 9.18 |
| P/B Ratio (times) | 0.98 |
| Dividend Yield (%) | 1.80 |
| Stock Exchange | BSE |
Investment Rationale
• V ardhman Textiles Limited, is the flagship company of the Vardhman Group, is an integrated textile manufacturer. The Company is engaged in manufacturing of cotton yarn, synthetic yarn, woven fabric, sewing thread, acrylic fiber, tow and garments. The Company's segments include Textiles and Fibre.
• It is one of the largest textile companies of India, manufacturing cotton yarns and fabrics with a capacity of over 1.1 million spindles, constituting about 2% of the country’s yarn production; 1,482 looms for weaving of fabrics; and 146 lakh metres per month of fabric processing capacity. It has in place a strong, capable and experienced management team delivering results that drive the company ahead.
• VTL is currently implementing a capex of Rs. 2,000 crores with a target of completing it by 2020. This capex involves, on the yarn front, setting up of about 100,000 spindles and on the fabric side, setting up of its third processing line at Budhni and 275+ looms.
• In spite of being in a capital intensive business, Vardhman has continuously maintained debt equity ratio below 1 and it has also a strong balance sheet that would enable it to pursue calibrated growth opportunities.
• Its Research and Development (R&D) units situated at all manufacturing centres work towards development of new products along with improvement in the existing production process and quality of products.
• It has also collaborated with some of the best technology players in the world and developed a strong in-house technical team that plays an instrumental role in helping the company emerge
as a ‘technology forward’ entity
• The company has constantly strived to improve operational efficiency, increase internal wellbeing and actively contribute to community while reducing environmental footprint to sustain business for the long term.
Risk
• Trade uncertainties
• Highly competitive
Valuation
The management of the company is planning to increase market share with larger clients by expanding product offerings over long term. Its investments in R&D enable to build a portfolio that takes into consideration the demand of the customers as well as cost advantage. The company has been formulating its strategic priorities in tune with global market trends and future requirements. Thus, it is expected that the stock will see a price target of Rs.1151 in 8 to 10 months time frame on three year average P/Ex of 9.85x and FY21 earnings of Rs.116.89.
Source: Company Website Reuters Capitaline
Above calls are recommended with a time horizon of 8 to 10 months.
6
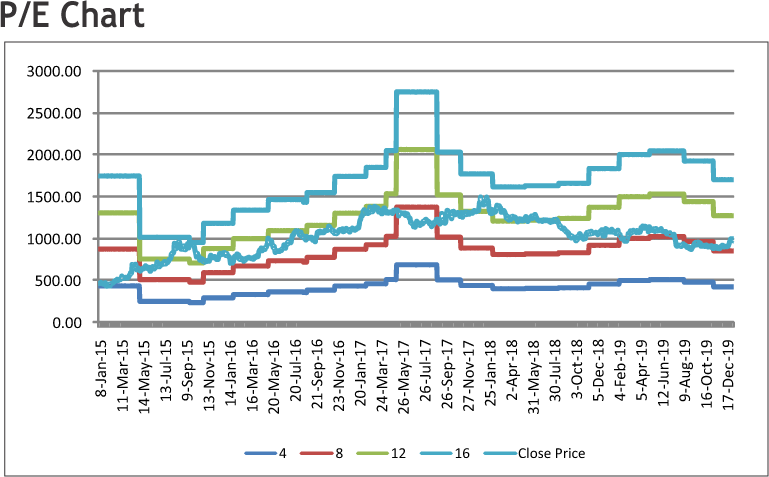
The stock closed at Rs 466.85 on 10th January 2020. It made a 52-week low of Rs 357.55 on 16th May 2019 and a 52-week high of Rs. 487.70 on 16th November 2019. The 200 days Exponential Moving Average (DEMA) of the stock on the daily chart is currently at Rs 438.82
As we can see on chart, the stock has formed a “Bull Flag” pattern on weekly charts and has given the breakout of same during last week. So, buying momentum is expected to continue for coming days. Apart from this, technical indicators such as, RSI and MACD are also suggest buying for the stock so one can initiate long in the range of 460-463 levels for the upside target of 500-510 levels with SL below 440.
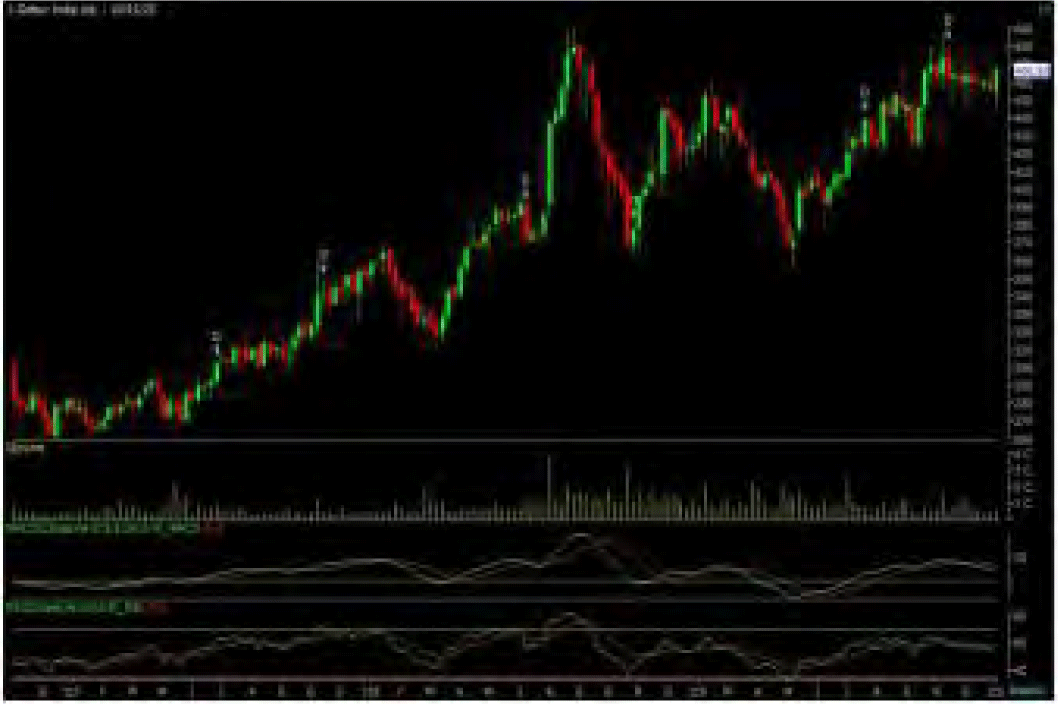
The stock closed at Rs 738.25 on 10th January, 2020. It made a 52-week low at Rs 575.0 on 04th September 2019 and a 52-week high of Rs. 804.95 on 25th January 2019. The 200 days Exponential Moving Average (DEMA) of the stock on the daily chart is currently at Rs 687.26
Short term, medium term and long term bias are looking positive for the stock as it is trading in higher highs and higher lows on weekly charts. From past few weeks, it has been consolidating in narrow range and has formed a “Continuation Triangle” on weekly charts, which is bullish in nature. Last week, the stock has given the breakout of same and has managed to close above the same along with high volumes. So, follow up buying is expected to persist in coming days. Therefore, one can buy in the range of 722-730 levels for the upside target of 770-790 levels with SL below 685.
Disclaimer : The analyst and its affiliates companies make no representation or warranty in relation to the accuracy, completeness or reliability of the information contained in its research. The analysis contained in the analyst research is based on numerous assumptions. Different assumptions could result in materially different results.
The analyst not any of its affiliated companies not any of their, members, directors, employees or agents accepts any liability for any loss or damage arising out of the use of all or any part of the analysis research.
SOURCE: CAPITAL LINE
Charts by Spider Software India Ltd
Above calls are recommended with a time horizon of 1-2 months
7
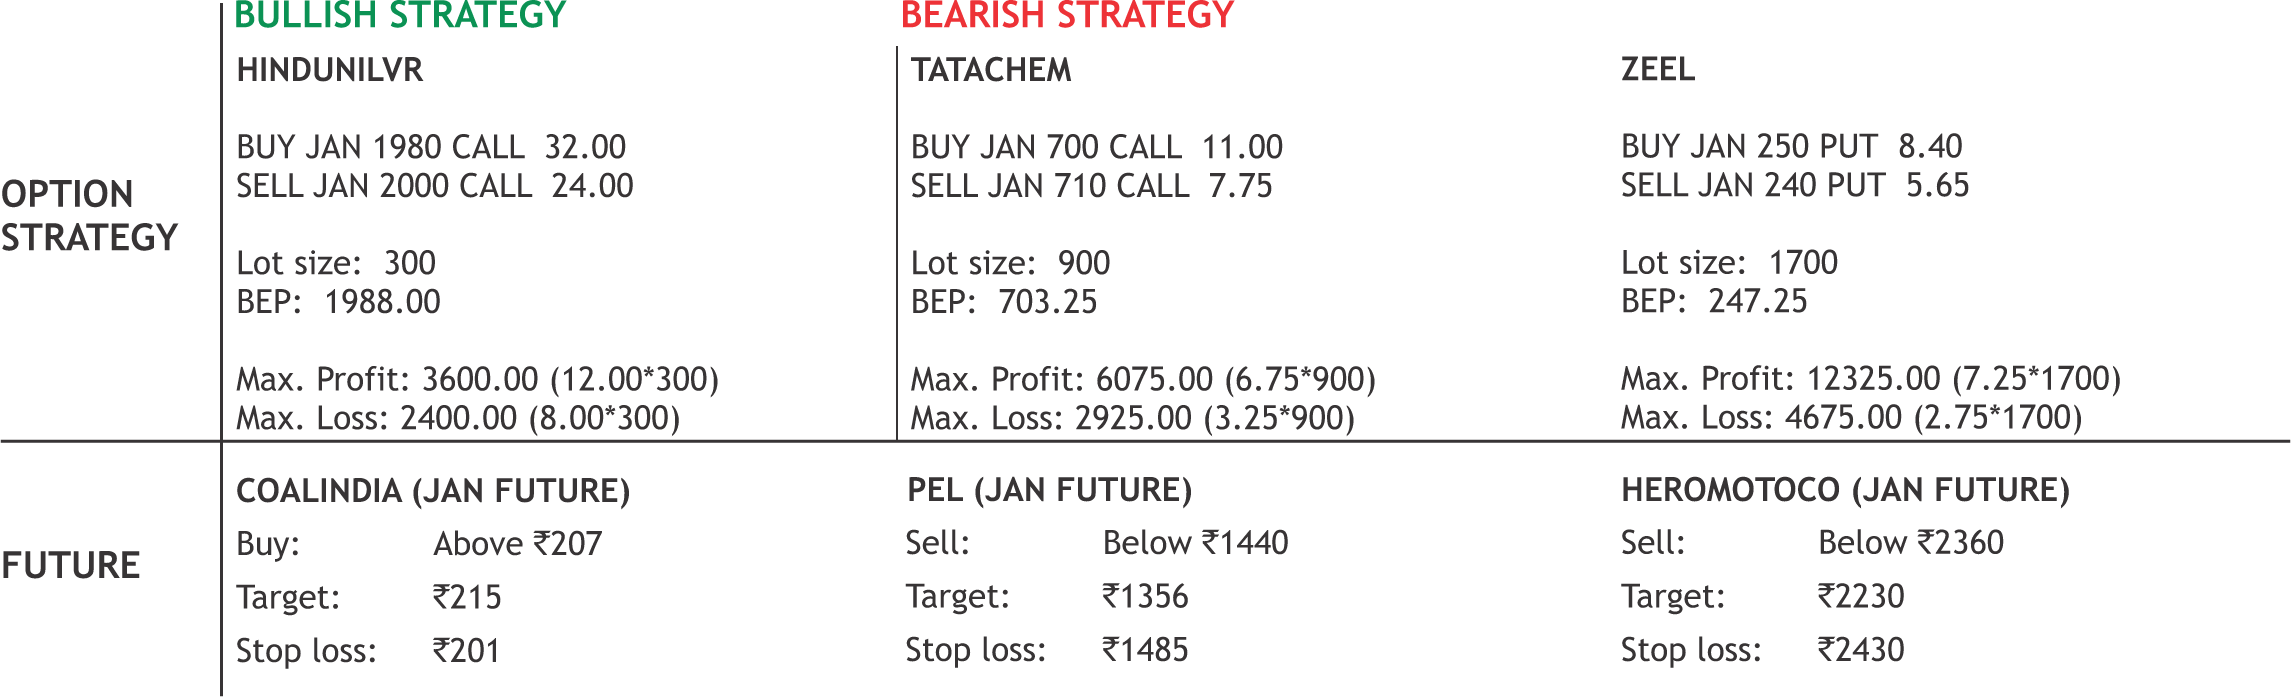
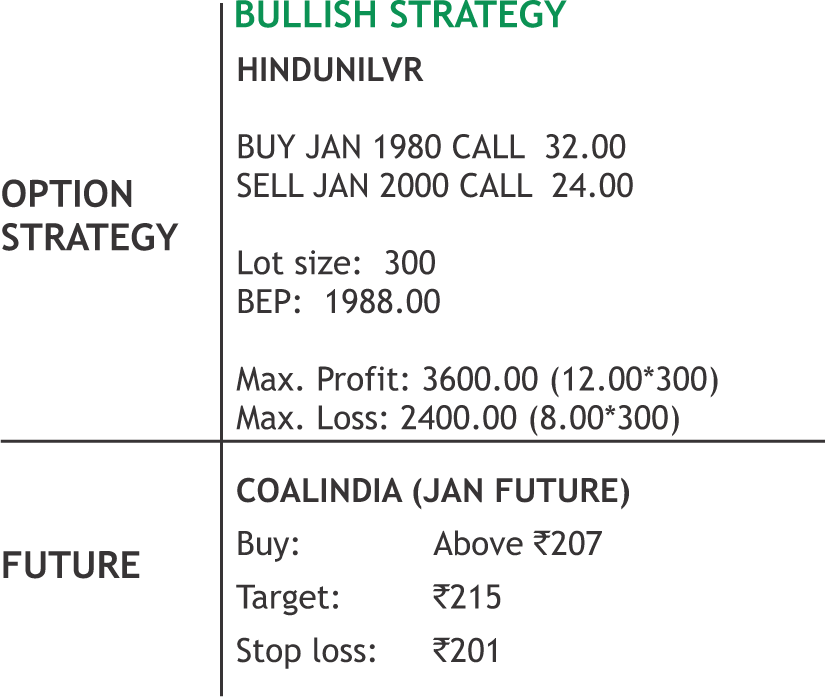
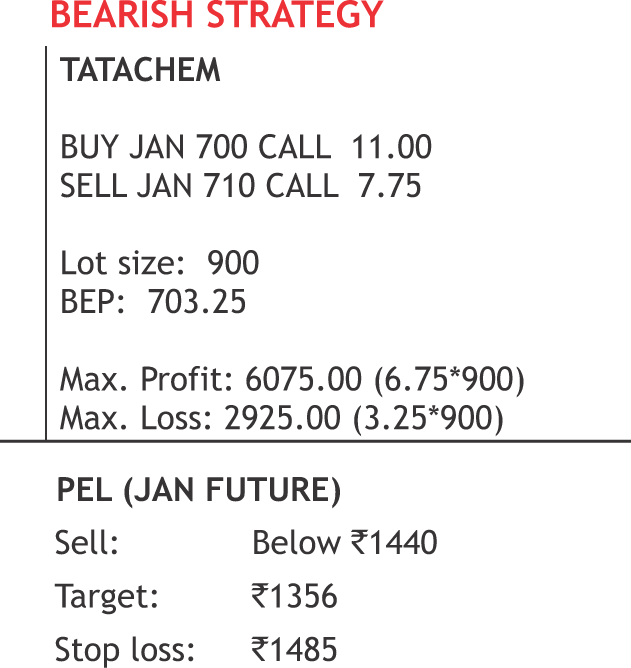
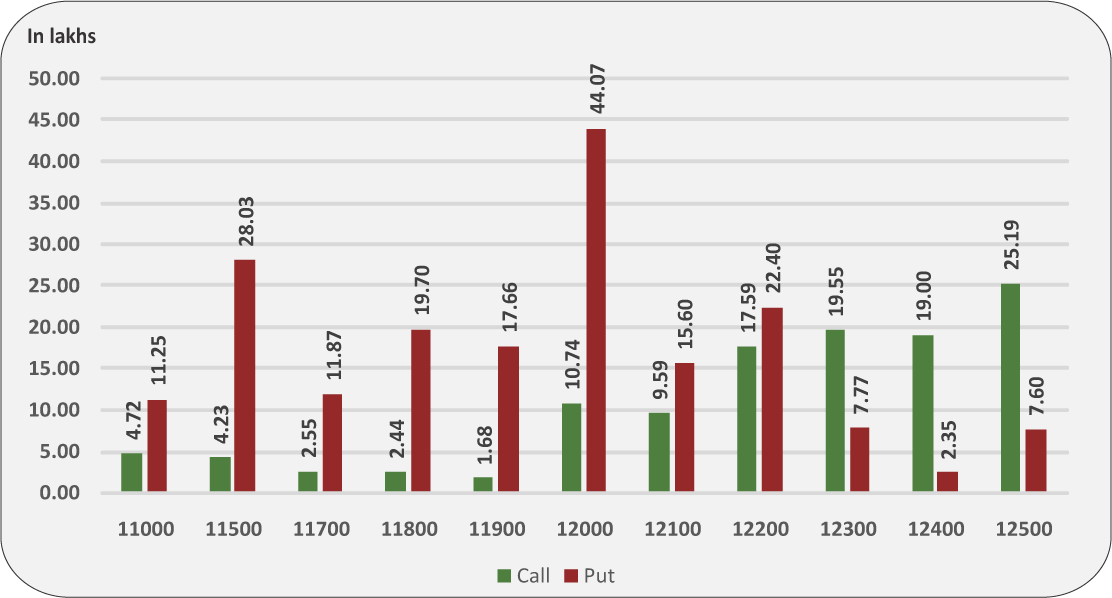
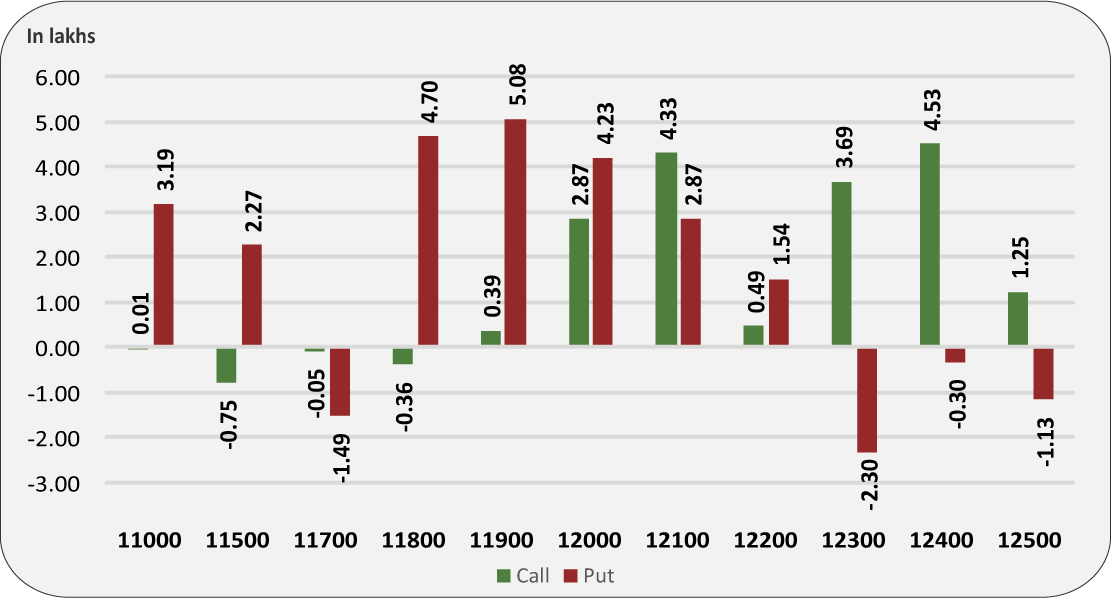
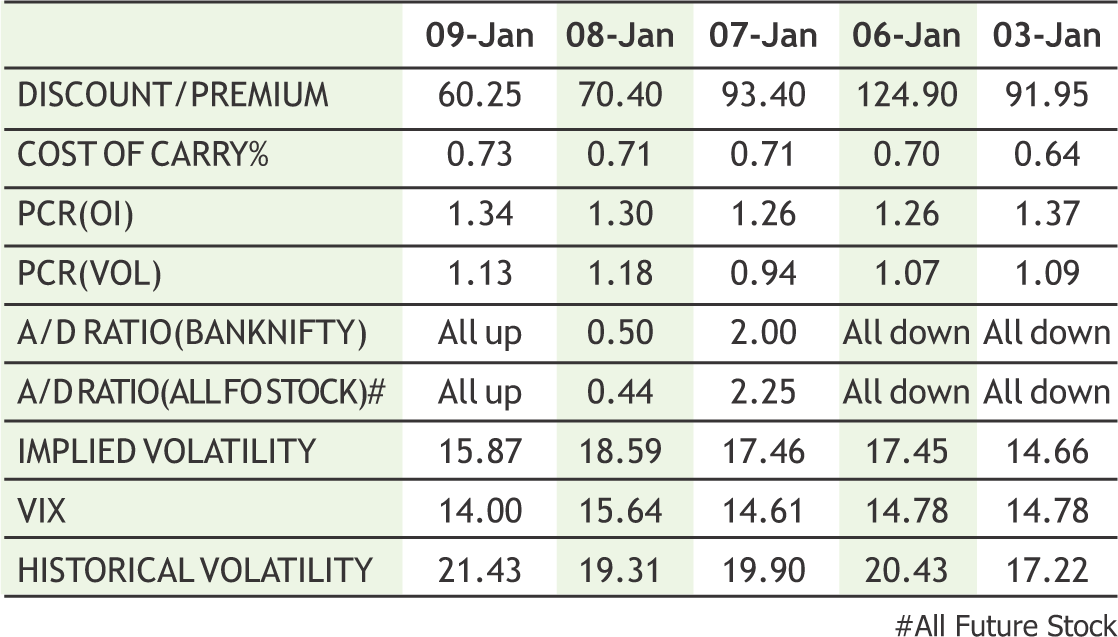
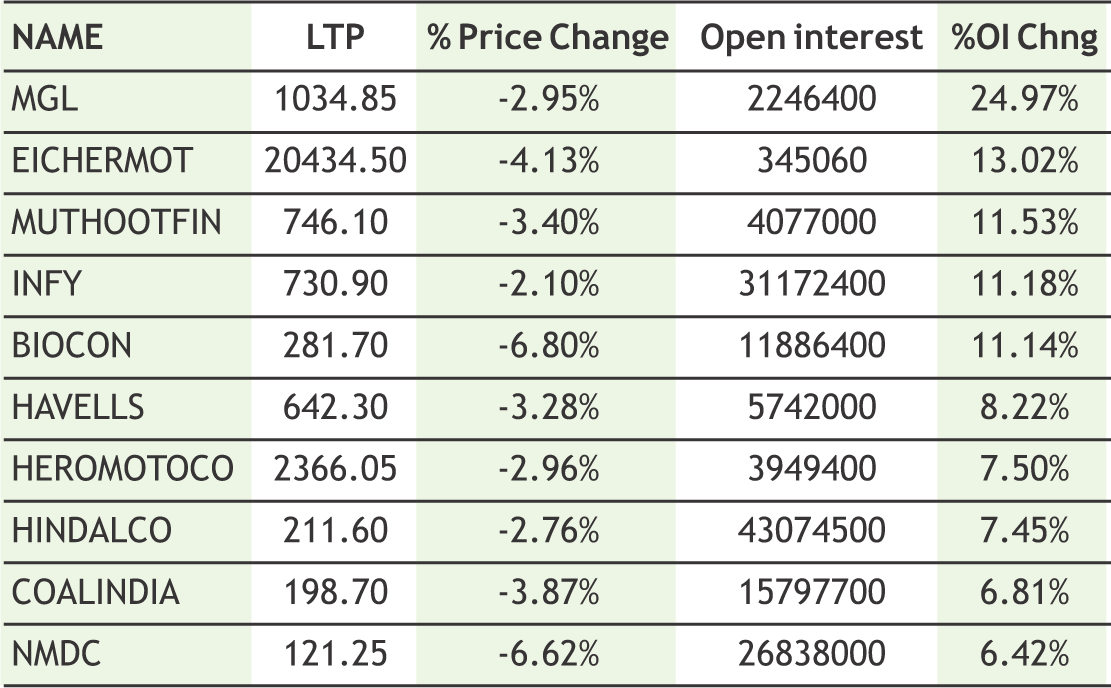
Nifty has again closed near weekly highs, data reflects that at current levels still there is lot of outstanding short position in Nifty and Index calls and we can expect another round of short covering. As per current derivative data Nifty can move towards 12350-12400 mark this week as the market undertone remains bullish with support of consistent short covering. Derivative data indicates bullish scenario to continue with Nifty having multiple strong supports at lower levels, around 12200 & 12100 spot. Currently Nifty is moving up, with decent addition in open interest and options put writing which indicates strength in the current trend. Option writers were seen active in recent rally as we have seen put writing in 12200 & 12100 strike puts along with unwinding in calls. Among Nifty Call options, the 12500 strike call has the highest open interest of more than 30 lakh shares, while in put options 12200 strike hold the maximum open interest of more than 35 lakh shares. The Implied Volatility (IV) of calls closed at 11.90% while that for put options closed at 12.20%. The Nifty VIX for the week closed at 14.00% and is expected to remain volatile. The PCR OI for the week closed at 1.38 which indicates put writing. On the technical front 12150-12200 spot levels is strong support zone and current trend is likely to continue towards 12350-12400.
8
|
|
|
|
**The highest call open interest acts as resistance and highest put open interest acts as support.
# Price rise with rise in open interest suggests long buildup | Price fall with rise in open interest suggests short buildup
# Price fall with fall in open interest suggests long unwinding | Price rise with fall in open interest suggests short covering
9
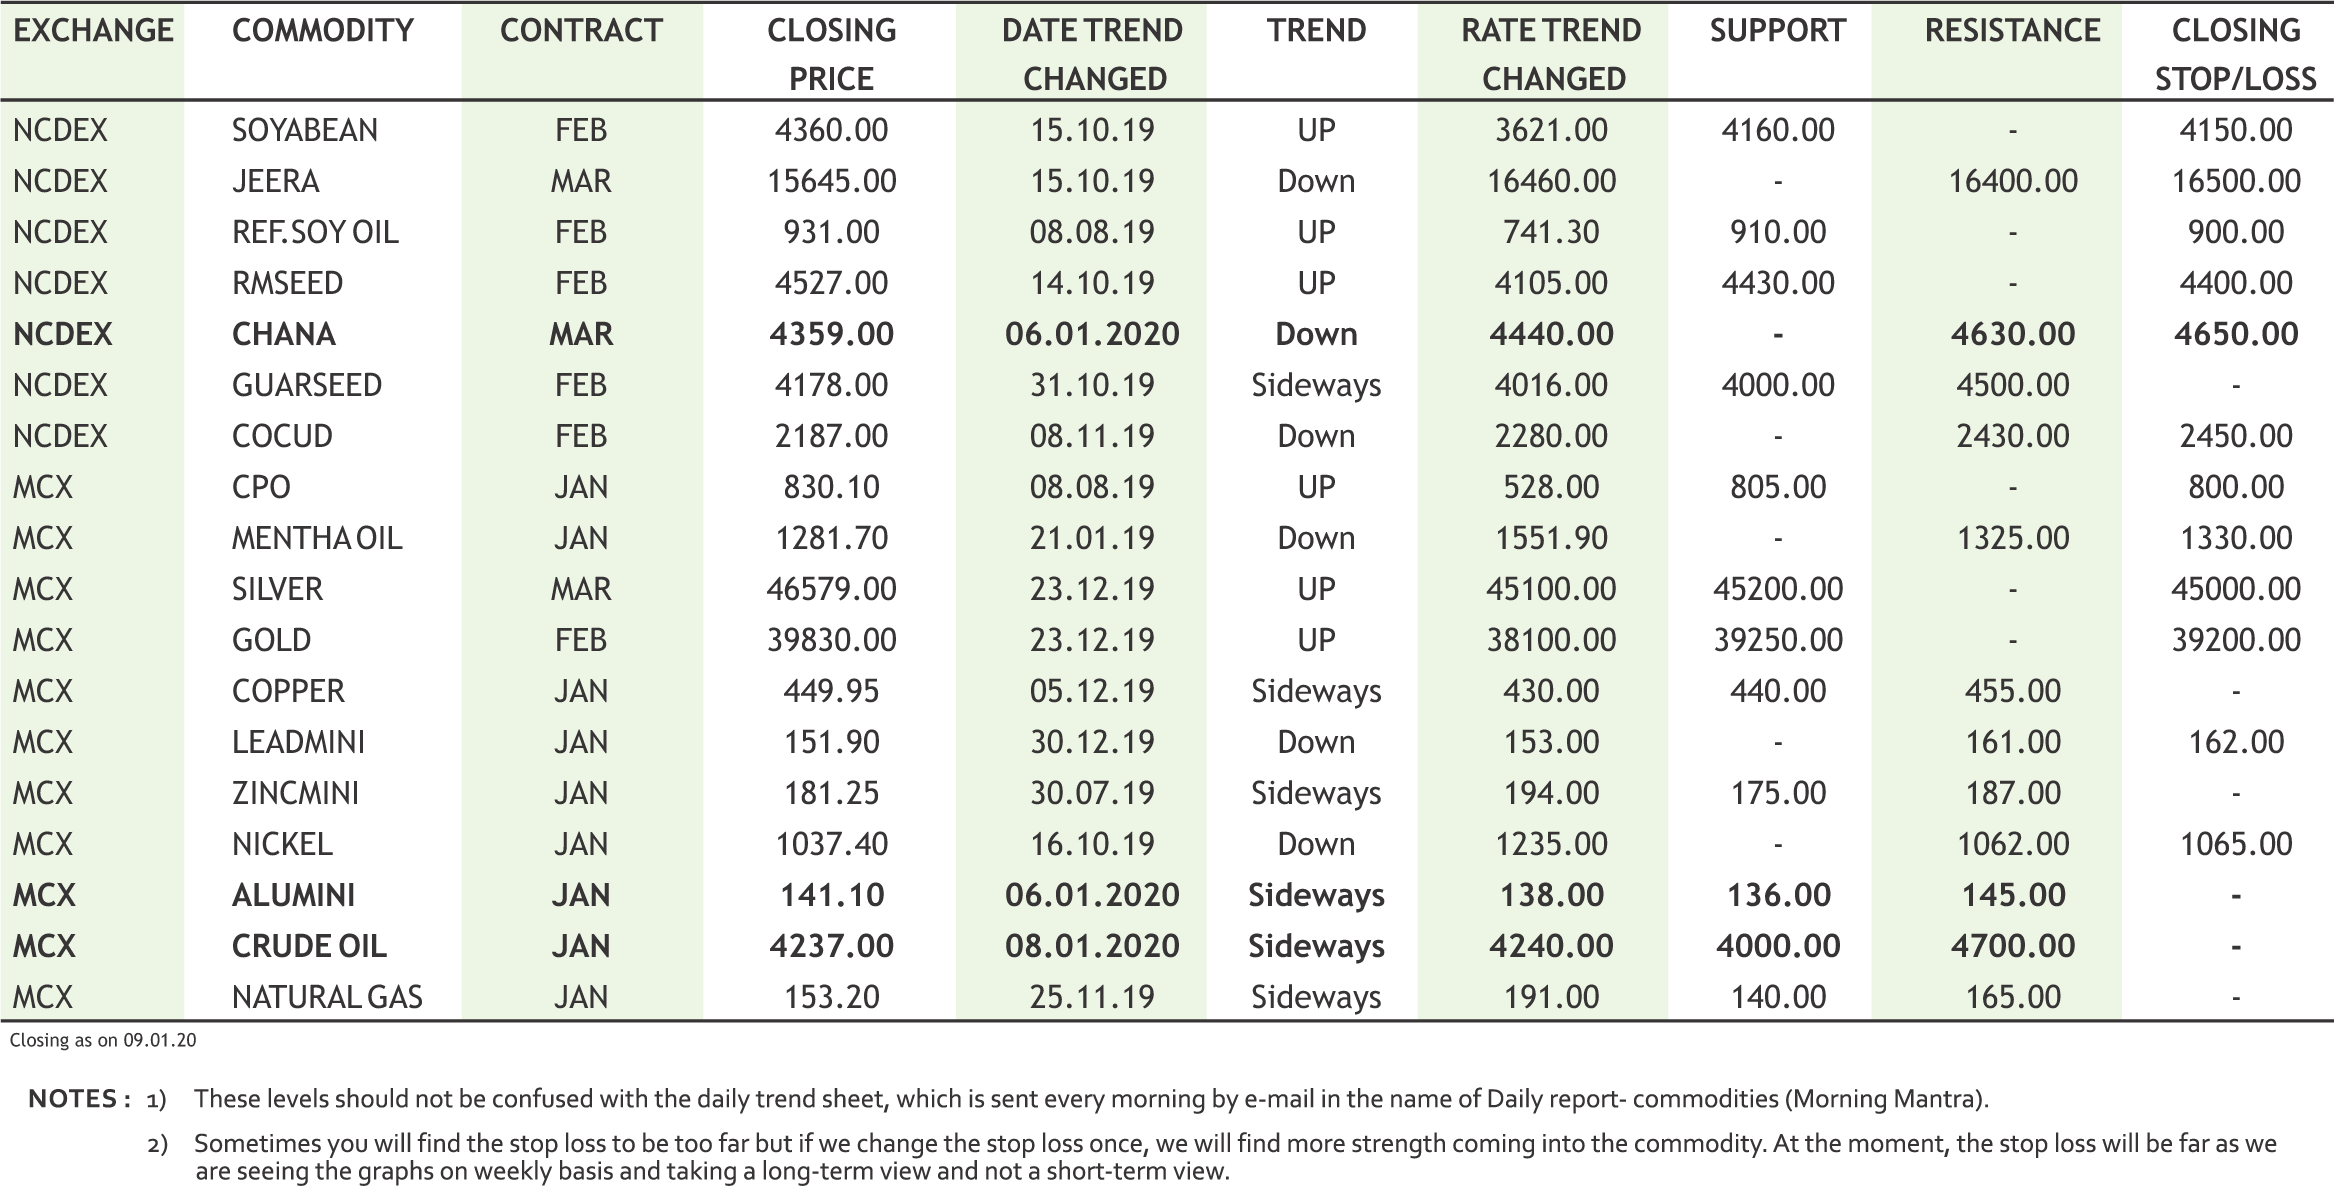
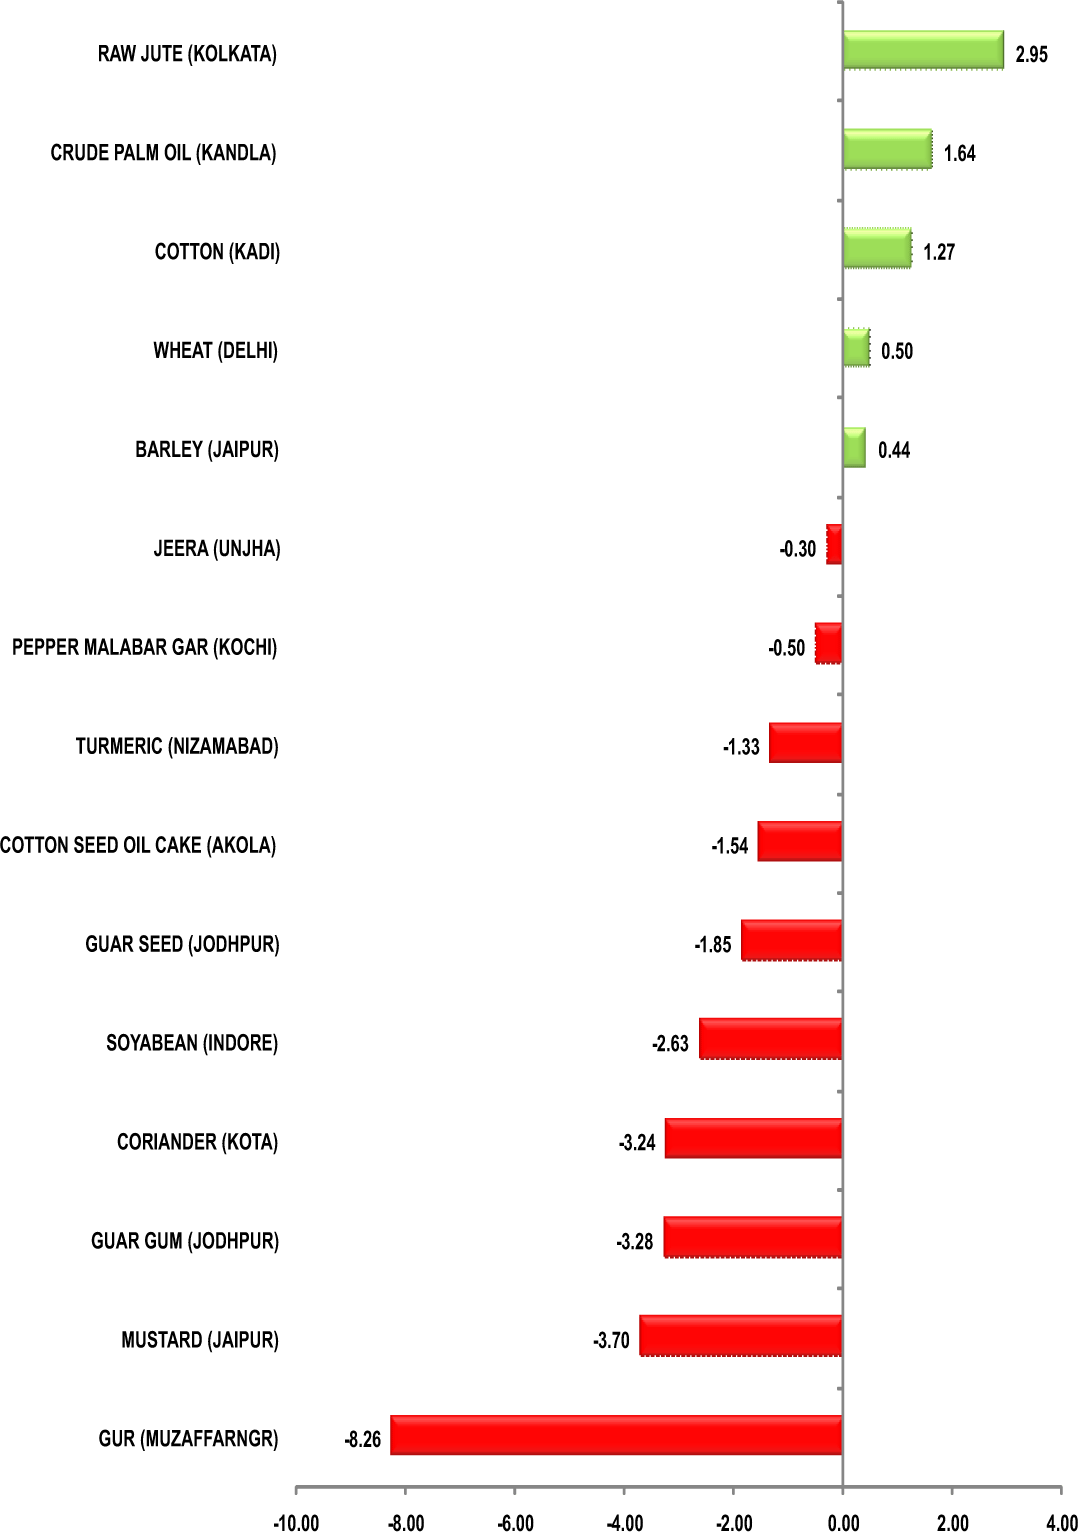
Turmeric futures (Mar) is expected to witness a major downside of 6100-5900 levels. The reason is that the new crop has started arriving in the markets of Nizamabad in Telangana. Against this, the demand is sluggish as the supply is coming from the six-month crop and has a moisture level of 20-30%, as compared to the normal of 7%. Due to delayed fortnight rains & poor weather conditions, the drying of the crop is taking time than usual & increasing the moisture level. The arrivals of finger and bulb varieties in Nizamabad market are fetching Rs.4000-4800 per 100 kg and 4,000 rupees & the old bulb variety is available for Rs.6,000 rupees per 100 kg, while the finger variety is sold for 6,100 rupees, respectively. Jeera futures (Mar) can crash towards 15200- 15000 levels. The favourable climatic conditions and improved water availability following good monsoon rains have brightened crop prospects. In Gujarat, the weather conditions are favorable & if it remains same for the next ten days then there will be a very good crop. As Per the latest data in Gujarat there is a 36% rise in area under cultivation of this spice over last year. Overall, the market participants are expecting crop size of about 5 lakh tonnes as compared to 4.1 lakh tonnes in the previous year. Dhaniya futures (Apr) will possibly continue to witness selling pressure in the range of 7100-7150 & correct towards 6565-6500 levels. This season, for coriander the area under cultivation in Gujarat is multiple times higher at 82,105 hectares (29,630 hectares) & weather conditions are favoring the crop’s growth.
Bullion counter is witnessing huge volatility amid the geopolitical tensions in Middle East. Gold hit life time high of above 41000 levels in MCX last week on fear that increased tensions between US and Iran could lead to war. But sharp profit booking was seen recently which can continue further as de-escalation in U.S.-Iran tensions reduced safe haven demand. Markets received a respite after U.S. President Donald Trump responded to Iran’s missile attacks with sanctions instead of military action. The U.S. House of Representatives passed a resolution on Thursday to stop Trump from further military action against Iran, days after he ordered a drone strike that killed a top Iranian commander and raised fears of war. Gold may further dip towards 39200 by facing resistance near 41000 whereas silver may decline towards 46000 while taking resistance near 48500. Meanwhile investors are now focused on a ‘Phase 1’ trade deal signing between Washington and Beijing this week. Trump stated that his administration will start negotiating the 'Phase 2' agreement soon but that he might wait to complete any deal until after November's U.S. presidential election. The World Bank trimmed its global growth forecasts for 2020 due to a slower-than-expected recovery in trade and investment despite cooler trade tensions between the United States and China. India's gold imports in 2019 fell 12% from a year ago to the lowest level in three years, as retail buying faltered in the second half after local prices rallied to a record high. Perth Mint's gold product sales in December rose to their highest in more than three years, citing higher demand from Germany.
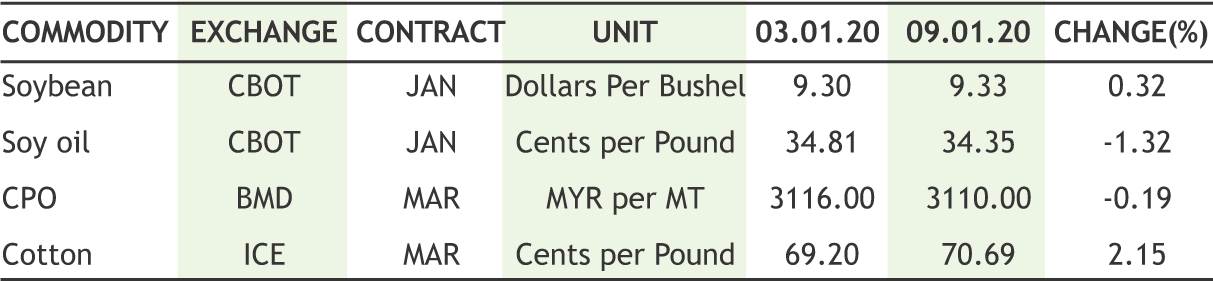
Soybean futures (Feb) is likely to trade with a downside bias in the range of 4450-4250 levels. The stockists & exporters are refraining from fresh purchase at such higher levels & waiting for a volatility to cool down. In the present scenario, there is a lot of fundamental news impacting the price movement from both the sides. The export of oilmeals has taken a sharp hit as lack of export incentives is hurting the interests of exporters. Mustard futures (Feb) may witness a good amount of correction & test the support of 4420, facing resistance near 4570. The sentiments are bearish as the supply is higher even during the ongoing lean period because of a bigger crop in 2018-19 (Jul-Jun). Further, the oilseeds acreage remained almost at last year's level. The mustard crop will benefit greatly in areas where there has been rain, because this crop will be strengthened by this rain. The latest statistics cited that the progressive area as on 3rd January for the season 2019-20 was 66.62 lh, as compared to 67.03 during the 2018.19 lh 2018-19 season. CPO futures (Jan) may continue to rule higher & test 850-870 levels. The decision of restricting imports of RBD Palm Oil and RBD Palmolein may create dis-equilibrium between demand-supply. While, soy oil futures (Feb) may take an attempt to break the near term resistance near 950 & escalate further towards 965-975 levels. There are talks that the Centre has also been looking at options such as limiting import of refined edible oils to 5-kg consumer packs, and restricting shipments to a few ports, in order to stem the rise in shipments.
Crude oil prices may witness further selling pressure as the threat of war in the Middle East, a major oil producing region receded and investors switched their attention to economic growth prospects and demand for crude. Crude oil may move further lower as it can test 4000 while facing resistance near 4450. Meanwhile according to US President Trump “Iran was "standing down" after the missile attacks that left no casualties”, with Tehran say the strikes "concluded" its response to the Soleimani killing. Meanwhile prices downside may be capped from higher compliance among the Organization of the Petroleum Exporting Countries (OPEC) on meeting production quota curbs aimed at reducing supply. Prices got support as US Iran war could disrupt shipping in the world's busiest sea route for oil, the Strait of Hormuz. Around a fifth of global oil supply passes through the strait which connects the Gulf with the Arabian Sea. Natural gas can witness some short covering at lower levels as it can test 165 by taking support near 148 on forecast of colder weather in US. U.S. natural gas futures edged up from a near four-month low on forecasts calling for a little colder weather in late January as meteorologists projected the weather in the Lower 48 states will turn to colder-than-usual from Jan. 16-18 before returning to normal through Jan. 24. U.S. Energy Information Administration (EIA) stated that utilities pulled 44 billion cubic feet (bcf) of gas from storage during the week ended Jan. 3, lower than the 53 bcf as forecasted.
Cotton futures (Jan) is looking bullish & it has the potential to test 20170- 20380 levels on the higher side. The exports of cotton from India is gaining momentum due to depreciation in the rupee and prompting Asian buyers such as China, Bangladesh and Vietnam to raise Indian purchases. As per the latest statistics, the balance of 32 lakh bales export shipments are expected to be shipped during the period from 1st January 2020 to 30th September. Regarding international market, the participants of the cotton market will keep a close watch on the historic event of the signing event of the U.S-China deal, which will give a boost to sentiments of agro commodities on Jan. 15. In days to come, we may see chana futures (Mar) going down further to 4295-4200 levels as the selling pressure is about to increase in the spot markets. The new chana crop has started arriving in Kalaburagi, a key market in Karnataka. It also has few takers as higher moisture content of around 20% as compared with the normal moisture content of 7-8%, restricting demand from dal millers and domestic stockists. Adequate rainfall in the period of Sep-Oct has left enough moisture in the soil required for growing chana. Rain during this time is like nectar for pulses crop and will increase the yield. Guar gum futures (Feb) is expected to trade firm in the range of 7200-7700 levels. The crude prices moving northwards could lead to a surge in exports of guar gum to US in the coming weeks. The industry is expecting to export 330,000 tonnes of guar gum this financial year.
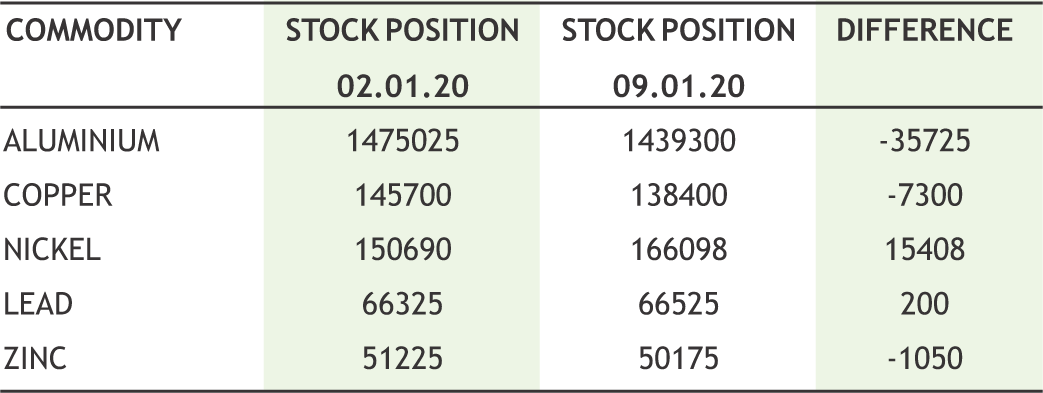
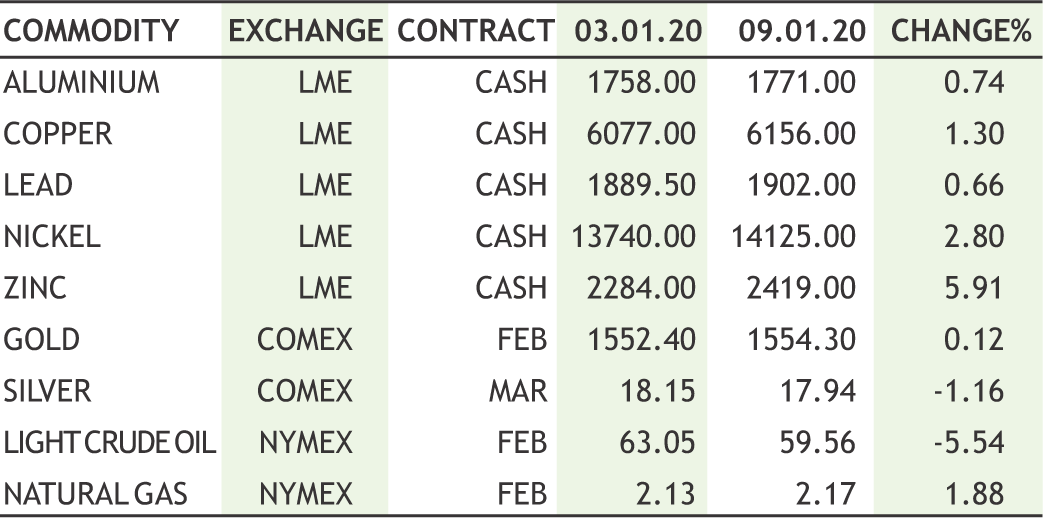
Base metal counter may remain on a positive path on easing of geopolitical tensions and as US and China are expected to sign phase 1 trade deal this week. U.S. President Donald Trump, announced last month that the Phase 1 trade deals with China would be signed on Jan. 15. Meanwhile China will keep its inflation target unchanged this year at about 3%, sources told Reuters, suggesting policymakers will roll out more economic support measures while avoiding aggressive stimulus. Copper may take support near 440 levels and recover towards 460 levels. Copper inventories in warehouses monitored by the LME to 138,400 tonnes, the lowest since March 2019. Copper production in Democratic Republic of Congo rose 15.9% year-on-year to 1.308 million tonnes for the period from January to November 2019. Copper output slumped at Chile's state miner Codelco and BHP's BHP.AX sprawling Escondida mine in November, according to Chile state copper agency Cochilco. Meanwhile, lead may remain sideways as it can move in the range of 150-157 levels. Zinc may take support near 175 levels and can recover towards 187. Nickel prices can move with sideways path as it may face resistance near 1050 while taking support near 1000 levels. Indonesia has approved environmental impact studies for factories to produce battery-grade nickel chemicals in Morowali. Aluminium prices can recover towards 146 levels by taking support near 137 levels. China's Henan Shenhuo Group is set to commence production at the first 150,000 tonne per annum of its Aluminium smelting capacity in Wenshan prefecture, Yunnan province.
10
|
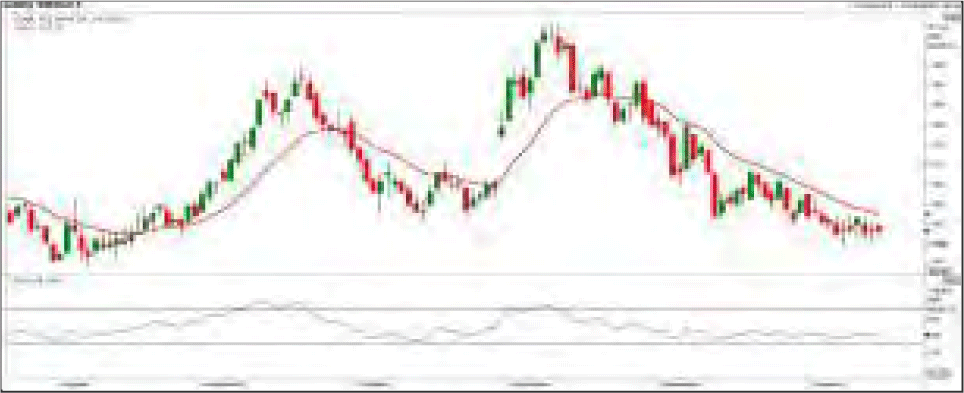
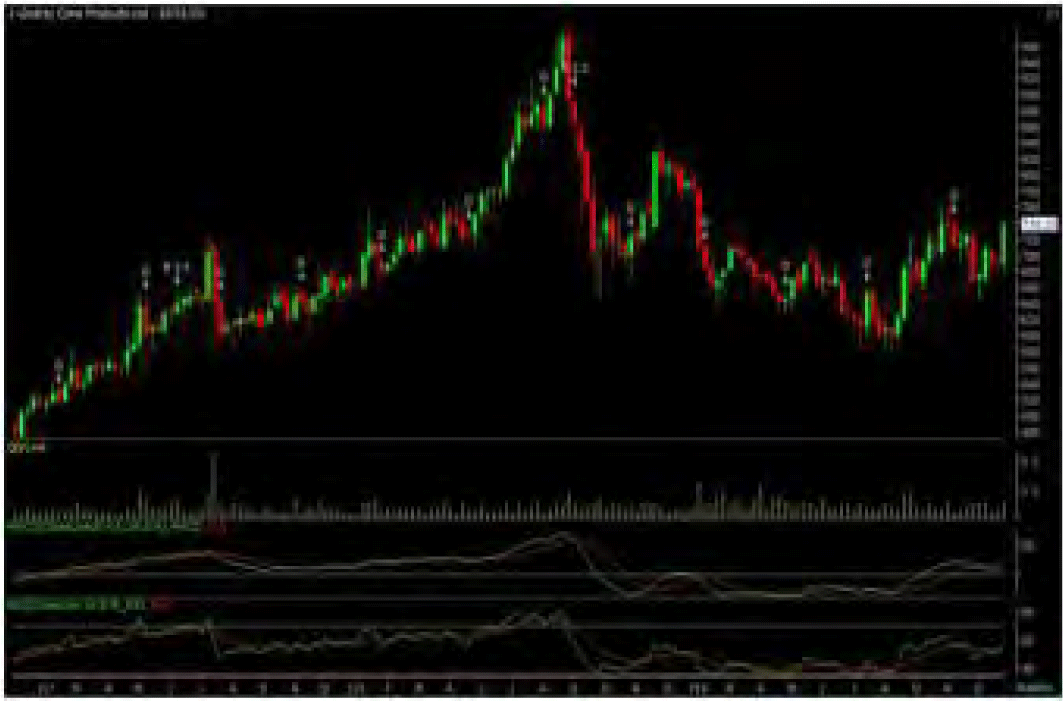
NATURAL GAS MCX (JAN) contract closed at Rs. 153.20 on 09th Jan’2020. The contract made its high of Rs. 209.90 on 06th Nov’19 and a low of Rs. 148.90 on 03rd Jan’2020. The 18-day Exponential Moving Average of the commodity is currently at Rs. 157.77. On the daily chart, the commodity has Relative Strength Index (14-day) value of 39.671.
One can buy above Rs. 158 for a target of Rs. 178 with the stop loss of Rs. 148.
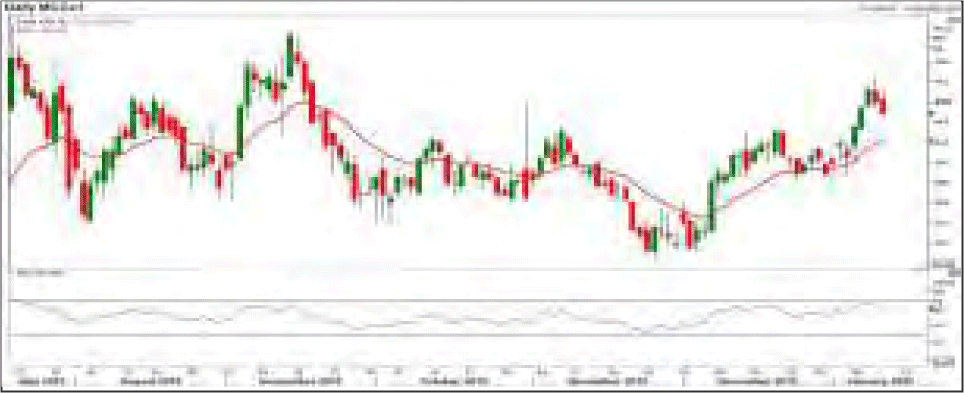
COPPER MCX (JAN) contract closed at Rs. 449.95 on 09th Jan’2020. The contract made its high of Rs. 454.05 on 07th Nov’19 and a low of Rs. 432.70 on 04th Dec’19. The 18-day Exponential Moving Average of the commodity is currently at Rs. 446.24. On the daily chart, the commodity has Relative Strength Index (14-day) value of 54.638.
One can buy above Rs. 454 for a target of Rs. 465 with the stop loss of Rs. 449.
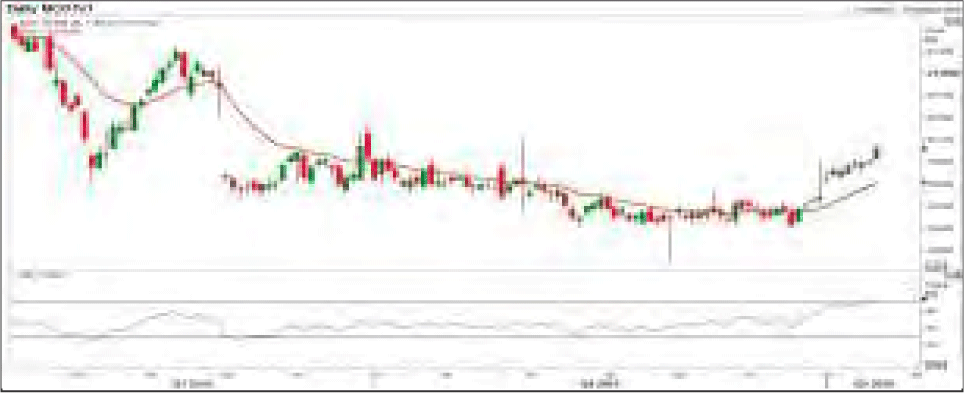
COTTON MCX (JAN) contract was closed at Rs. 19800.00 on 09th Jan’2020. The contract made its high of Rs. 20030.00 on 10th Jan’19 and a low of Rs. 18900.00 on 11th Nov’19. The 18-day Exponential Moving Average of the commodity is currently at Rs. 19610.87. On the daily chart, the commodity has Relative Strength Index (14-day) value of 73.925.
One can buy near Rs. 19840 for a target of Rs. 20400 with the stop loss of Rs 19560.
11
Ÿ The "import policy" is amended from "free to restricted" for refined bleached deodorised palm oil and refined bleached deodorised palmolein. - Directorate General of Foreign Trade (DGFT)
Ÿ The overall export of oilmeals during April-Dec., 2019 is reported at 1,802,434 tons compared to 2,411,248 tons in April-Dec., 2018 i.e. down by 25%. - Solvent Extractors’ Association of India.
Ÿ Ÿ US will immediately impose punishing economic sanctions against Iran. These sanctions will remain till Iran's Behavior Improves. – U.S President.
Ÿ China’s Vice Premier Liu He, head of the country’s negotiation team in Sino-US trade talks, will sign a “Phase 1” deal in Washington next week, the commerce ministry said.
Ÿ BSE has suspended futures trading in soybean, castor seed and chana contracts.
Ÿ Additional Margin of 1% with effect from January 13, 2020 and further additional margin of 1% (total 2%) with effect from January 20, 2020 to be levied on Gold (all variants) & Crude Oil contracts.
ŸŸ The trading turnover at India’s largest commodity exchange MCX jumped to a nearly seven-year high at Rs 62,318 crore.
Ÿ I ndia's gold imports in 2019 fell 12% from a year ago to the lowest level in three years.
Ÿ Venezuela's oil exports plummeted 32% last year to 1.001 million barrels per day
Japan's services sector saw its deepest contraction in more than three years in December.
Canadian miner First Quantum Minerals Ltd is weighing investment of around $1 billion to lift output at Africa's biggest copper mine in Zambia.
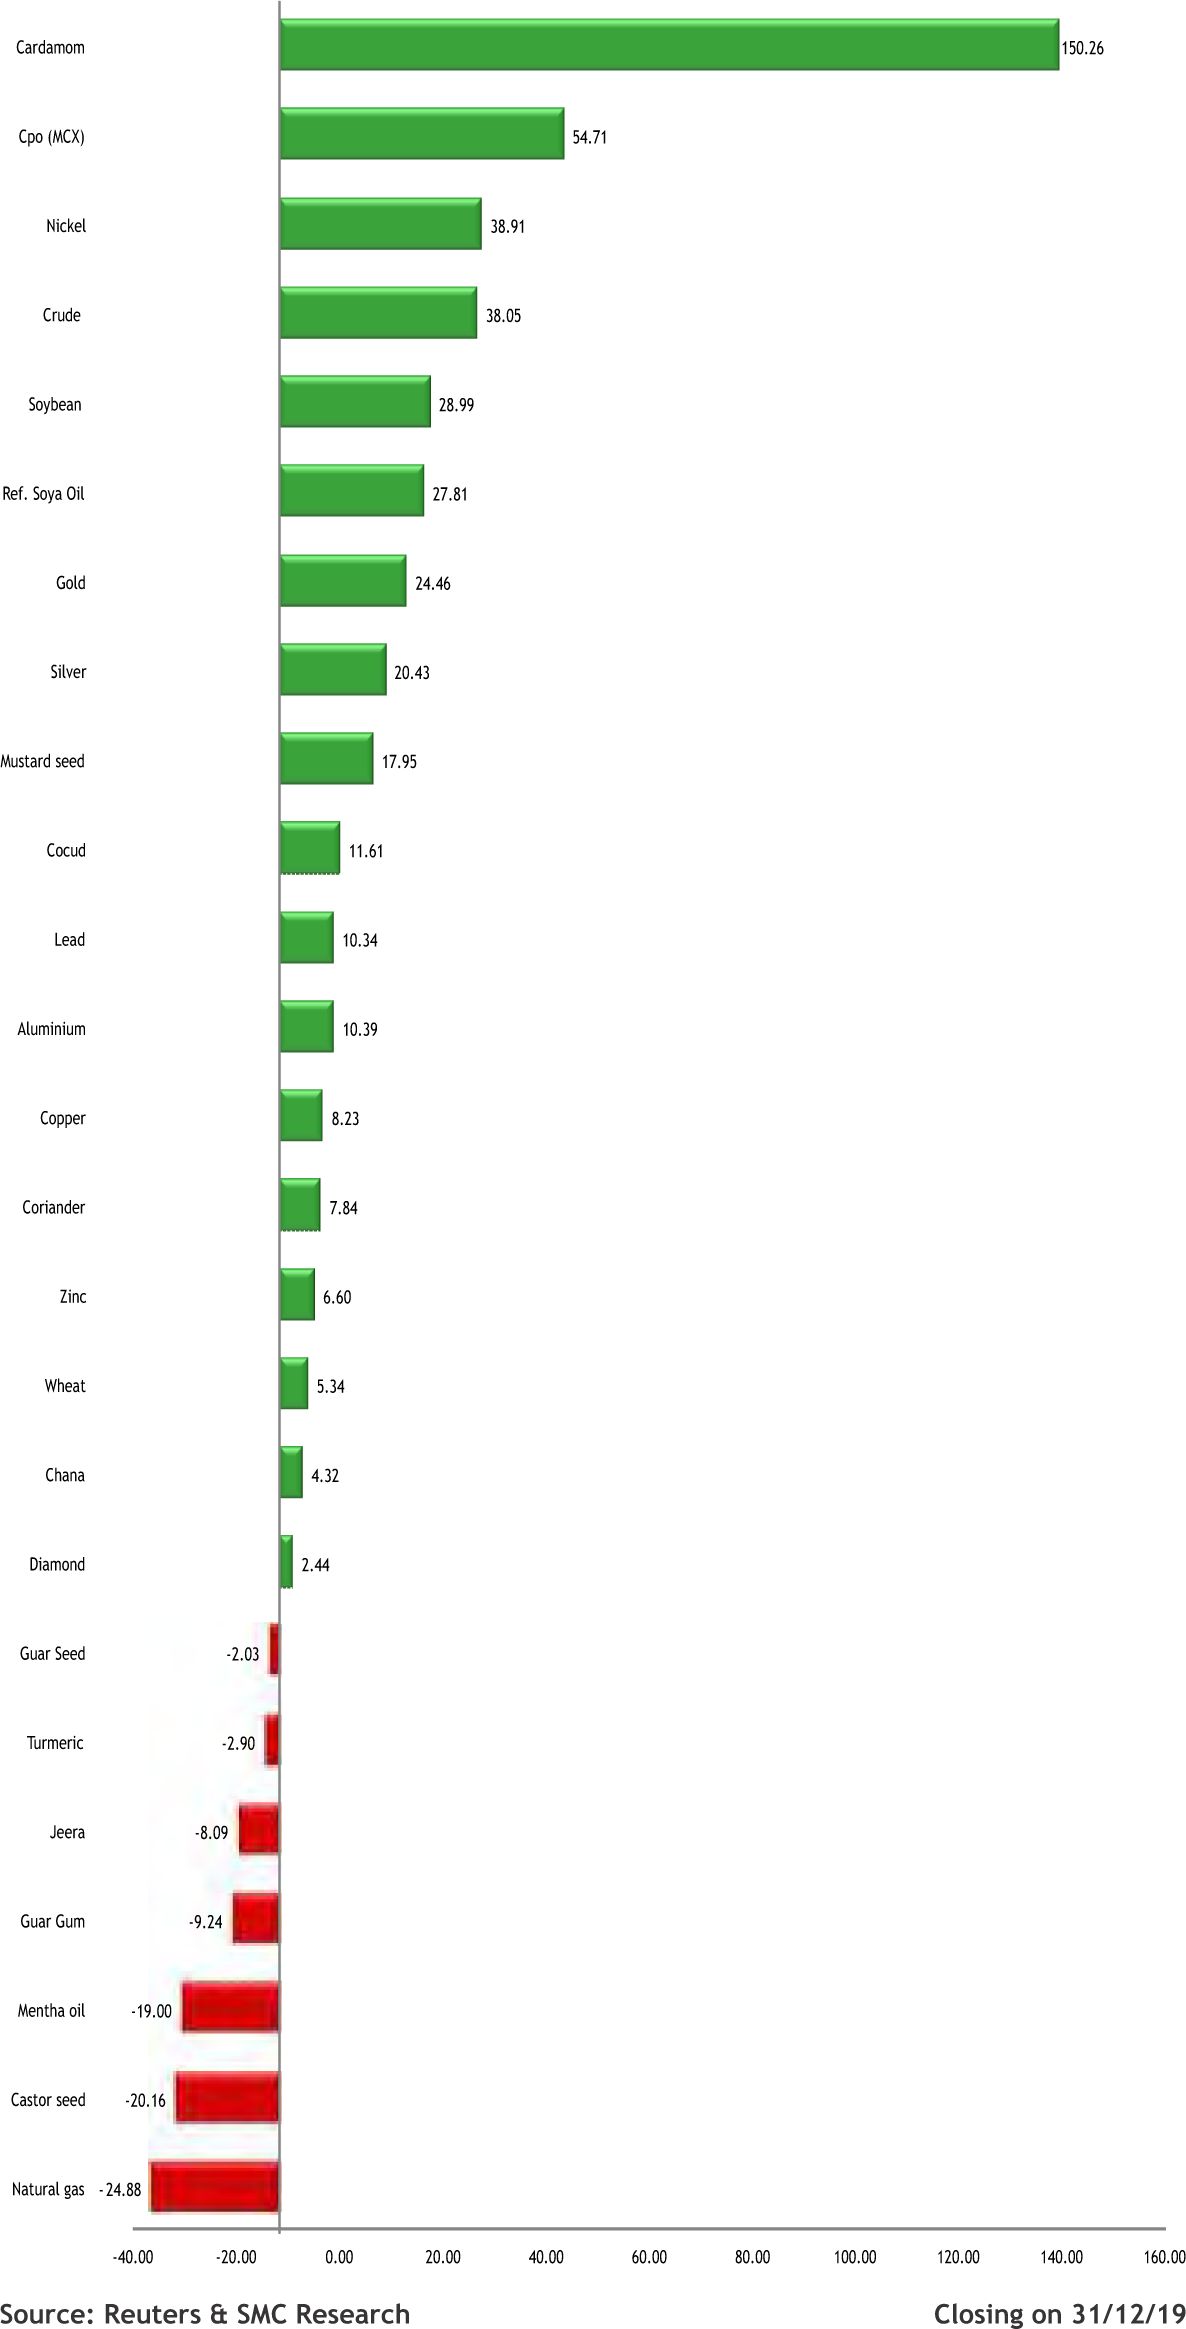
2020 started with bang; knee jerk reaction was witnessed everywhere as financial market reacted on US and Iran war tension. For the time being, market ignored the positive economic data and scheduled sign on first phase of trade deal. Gold came into insurance role once again and prices skyrocketed on first two days. On Wednesday, gold prices soared to $1,611, a sevenyear high, after Iran fired ballistic missiles at two Iraqi air bases housing U.S. forces. Later on when Trump assured “All is Well” and US is not going to retaliate fueled hope and rally has been seen in stock market and gold and silver gave up their previous gains on waning effect of war. In India, gold made fresh high of 41293 levels and in comex it hit the $1615 levels. Silver saw good upside across the board though closed the week in negative after nonstop four week upside. Crude prices also ignited in the beginning on fear of supply cut if war intense. Overall it settled in negative as the threat of war in the Middle East receded and investors switched attention to economic growth prospects and the rise in U.S. crude oil and product inventories. US stocks rallied to fresh record highs with receding possibilities of war amid some improvement in US economic releases viz ADP employment. It gave some hope to the industrial metals counter and amid all adversities most of them saw marginal upside. Aluminum saw good upside in recent weeks on surge in crude prices. China reports that CPI remained steady in Dec at 4.5% y/y, while producer price deflation eased to -0.5% y/y - analysts suggest this leaves room for the PBOC to loosen monetary policy.
We saw profit booking in oil seeds and edible oil counter though the downside was limited on Government decision to restrict RBD import from Malaysia. The sentiments of the whole oilseeds complex has turned positive after the notification given by the Directorate General of Foreign Trade (DGFT) stating that the government amended its import policy for refined bleached deodorised palm oil (RBD Palm Oil and RBD Palmolein) from current status of ‘free’ to ‘restricted’. India imports about 70 per cent or 16 million tonnes of its annual 24 million tonnes of edible oil requirements. It was a weak week for spices in which most of them saw profit booking after significant gain in previous weeks. Jeera traded bearish due to expected rise in production this season. This time, there has been an increase in the area under cultivation due to favourable weather.

|
|
12
|
|
Ratio defines the fair value relationship between gold & crude. In simple words, it tells us how many barrels of crude we buy with one ounce of gold. As we all know both the commodities belongs to different asset class with their own fundamentals and unique demand supply constraints. Irrespective of these odds, both do have some interesting parallels. High crude prices tend to be relating with higher rates of inflation and lower periods of economic growth. With gold being a popular hedge against inflation, there should be a degree of correlation in any price movements.
Average
From 2011 to 2020 the average of Gold-Crude ratio stood at 20.67 and their median at 20.07. This means we can buy average 20 barrels of crude with one ounce of Gold. Over the last 10 year, the ratio has hit a low of 12.15 in Jun’14 and high of 35.83 in Feb’16. Clearly there’s a significant range here, but unlike the way gold or oil trades against the US Dollar, this chart shows repeated reversions to the mean.
Then question arises what should we do with this average or how it can help us in trading?
Some market participants may talk about the Gold/Oil ratio as providing a guide of fair value for either commodity. Average Ratio at time of writing reads at 25.99 and WTI Crude trading at $59.77 which means gold should cost around $1553.42 an ounce, rather than the $1611.11 it currently trades at. The price of gold needs to fall or the price of oil needs to rise, to see a return to the long-term average.
What might push the Crude up or Gold up?
As we all are well aware about the present scenario of market. Ahead of the threat of war and complexities of the ongoing situations across Middle East, US sanctions were indeed tightened against Iran which led the rally in crude price whereas on the other hand gold is seen as safe heaven asset and buying provided support in prices. Also Gold provides hedge against inflation and might be the reason behind the recent rally in both commodities. Adding to this the threat of increase in inflation in US economy led central bank to adopt dovish approach to monetary policy which could also drive interest in the precious metals.
13
|
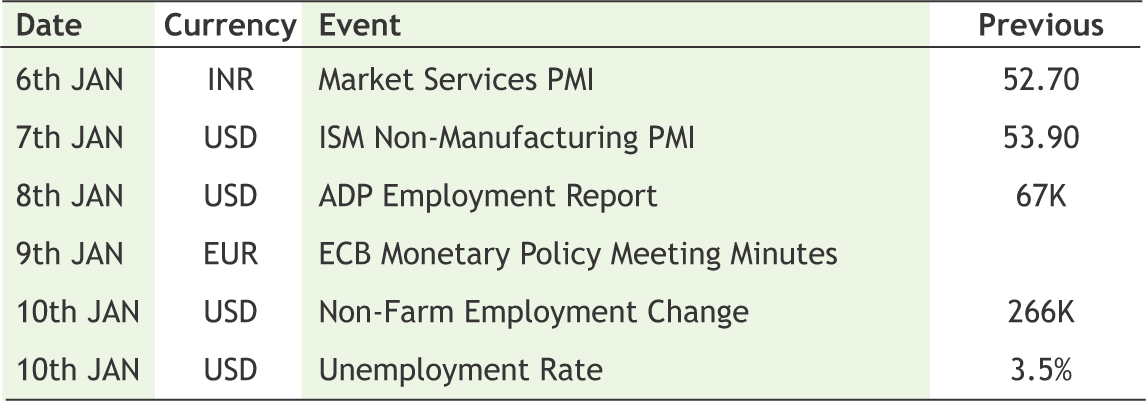
| 03rd JAN | Forex reserve hits record high of $457.46 billion |
| 06th JAN | Mideast tensions send yen to three-month peak |
| 10th JAN | Shriram Transport Finance raises around Rs 3,556cr via bond issue |
| 10th JAN | US likely to sign trade deal with China on January 15 |
| 10th JAN | US House passes resolution to limit Donald Trump's ability to wage war on Iran |
Indian Rupee lost by seven tenth percent this week ended Thursday, paring some losses after Trump backed away to take any military action against Iran. In the wake of assassination of Qasem Soliemani - Iran's most influential man, last week markets were opt to remain risk-averse. Accordingly Iran retailate by firing dozen air-to-surface missiles in US bases in Iraq. Later Trump hinted to de-escalate the tension as war can lead to devastation especially in oil prices which can damage energy sensitive economies including India. Although the tension between US & Iran may have cooled off for the time being, but it is not dissipated on full course - Iran may engage some proxy action in Lebanon or Iraq. Meanwhile Sterling fell as Mark Carney suggested that more stimulus could be on the cards in a speech that followed hints from EU trade representatives of a delay in Brexit trade talks. The Bank of England’s governor said on Thursday that “there is a debate at the (monetary policy committee) over the relative merits of near-term stimulus to reinforce the expected recovery in UK growth and inflation”. Going forward, Indian inflation is likely to shoot up amid on-going higher food prices along with US & UK CPI will remain focus for major pairs.
|
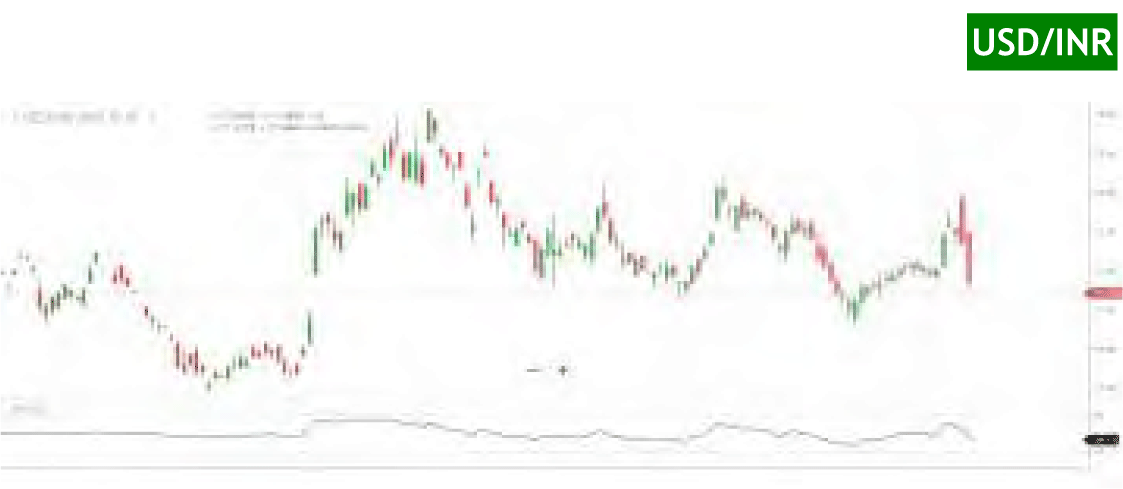
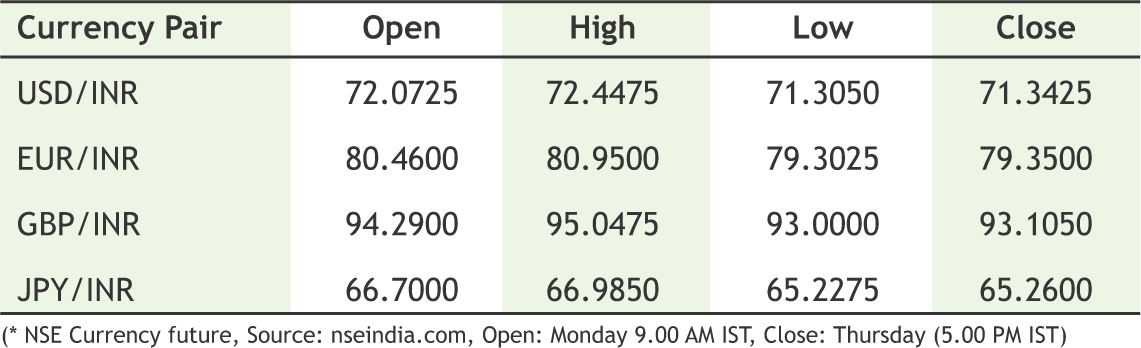
USD/INR (JAN) contract closed at 71.3425 on 9th Jan 2020. The contract made its high of 72.4475 on 8th Jan’20 and a low of 71.3050 on 9th Jan’20 (Weekly Basis). The 14-day Exponential Moving Average of the USD/INR is currently at 71.59.
On the daily chart, the USD/INR has Relative Strength Index (14-day) value of 38.64. One can buy above 71.35 for the target of 72.25 with the stop loss of 71.
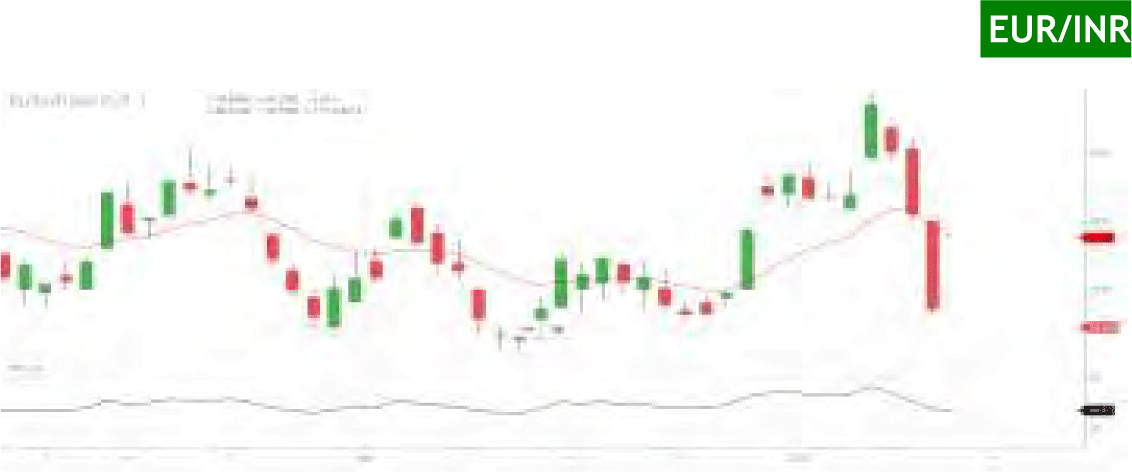
EUR/INR (JAN) contract closed 79.3500 on 9th Jan 2020. The contract made its high of 80.9500 on 6th Jan’20 and a low 79.3025 on 9th Jan 2020 (Weekly Basis). The 14-day Exponential Moving Average of the EUR/INR is currently at 79.88.
On the daily chart, EUR/INR has Relative Strength Index (14-day) value of 40.18. One can buy above 79.24 for a target of 80.50 with the stop loss of 78.50.
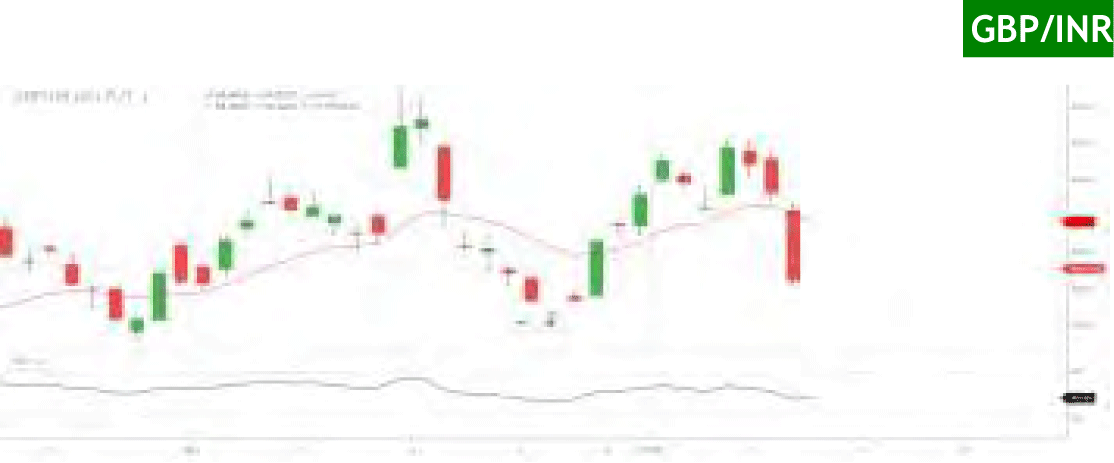
GBP/INR (JAN) contract closed at 93.1050 on 9th Jan 2020. The contract made its high of 95.0475 on 6th Jan’20 and a low of 93.00 on 9th Jan (Weekly Basis). The 14- day Exponential Moving Average of the GBP/INR is currently at 93.92.
On the daily chart, GBP/INR has Relative Strength Index (14-day) value of 45.60. One can buy above 93.15 for a target of 94.15 with the stop loss of 92.70.
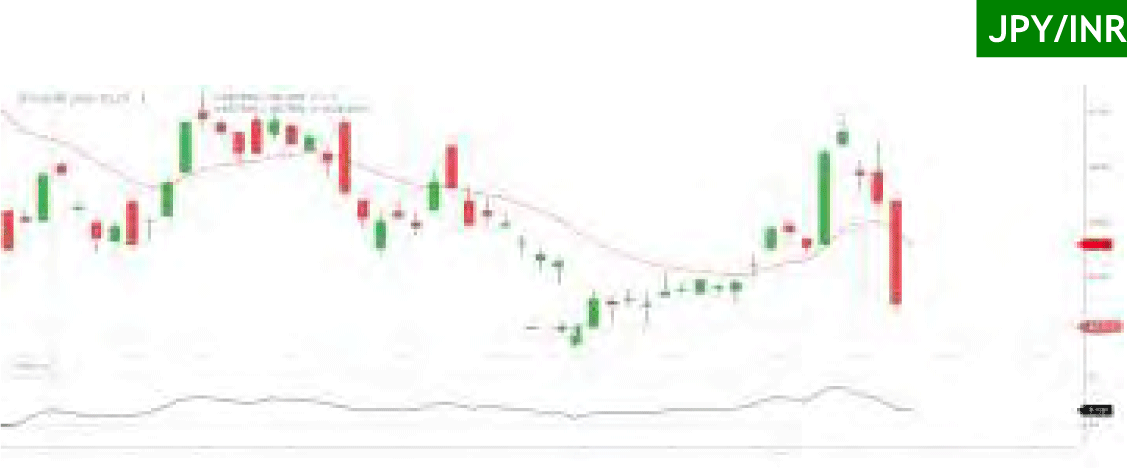
JPY/INR (JAN) contract closed at 65.2600 on 9th Jan 2020. The contract made its high of 66.9850 on 6th Jan’20 and a low of 65.2275 on 9th Jan’20 (Weekly Basis). The 14-day Exponential Moving Average of the JPY/INR is currently at 65.80.
On the daily chart, JPY/INR has Relative Strength Index (14-day) value of 38.07.98. One can buy above 65.10 for a target of 66.50 with the stop loss of 64.35.
14
CAMS files IPO papers with SEBI, may raise Rs 1,600 crore
Computer Age Management Services (CAMS), the financial infrastructure and services provider to the mutual fund industry, has filed its draft red herring prospectus (DRHP) with capital markets regulator Securities and Exchange Board of India (SEBI) for its initial public offering (IPO) on January 9. The public issue consists an offer for sale (OFS) of 1,21,64,400 equity shares by the Great Terrain Investment Ltd (an affiliate of Warburg Pincus), NSE Investments, Acsys Investments, HDFC and HDB Employees Welfare Trust. The issue includes an eligible employee reservation of up to 1.5 percent of the post-offer paid-up equity share capital. The AUM of equity mutual funds serviced by CAMS grew from Rs 2,18,000 crore as of March 31, 2015 to Rs 6,64,300 crore as of March 31, 2019, at a CAGR of 32.1 percent, and as of September 30, 2019 was Rs 6,70,100 crore. 'The book running lead managers to the offer are Kotak Mahindra Capital Company, HDFC Bank, ICICI Securities and Nomura Financial Advisory and Securities (India).
ESAF Small Finance Bank files DRHP with SEBI for Rs 976 crore IPO
ESAF Small Finance Bank on January 6 filed draft papers with markets regulator Sebi to float a Rs 976-crore initial public offering. The IPO comprises a fresh issue of shares worth Rs 800 crore and an offer-for-sale (OFS) aggregating up to Rs 176.2 crore, according to the draft prospectus filed with the Securities and Exchange Board of India (Sebi). The bank, in consultation with its book running lead managers may consider a pre-IPO placement of up to Rs 300 crore. If it is undertaken, the amount raised will be reduced from the fresh issue, the draft papers noted. The proceeds from the fresh issue will be used to augment the bank's tier-1 capital (primarily loans or advances and investment portfolio) to meet future capital requirements. The public issue is being managed by Axis Capital, Edelweiss Financial Services, ICICI Securities and IIFL Securities. The Kerala-based bank currently operates in 16 states and 1 union territory through its 403 branches and 38 ultra-small branches, serving over 3.73 million customers. The bank's net profit increased from Rs 24.06 crore in September 2018 to Rs 92.44 crore in September 2019 and the interest earned increased from Rs 472.25 crore in September 2018 to Rs 660.68 crore in September 2019.
Route Mobile gets SEBI nod for Rs 600 cr IPO
Omni channel cloud communications service provider Route Mobile has received approval from capital market regulator Securities and Exchange Board of India (SEBI) to launch its initial public offering (IPO). The offer comprises of a fresh issue worth Rs 240 crore and an offer for sale of Rs 360 crore by the promoters, Y Sandipkumar Gupta and Rajdipkumar Gupta. Additionally, Route Mobile may consider a pre-IPO placement of upto Rs 100 crore, which will reduce the size of the offer if it takes place. The company has serviced more than 27,500 clients across sectors including BFSI, aviation, retail, e-Commerce, logistics, healthcare, hospitality, media and entertainment, pharmaceuticals and telecom. Its total revenue increased at a CAGR of 37.87 percent to Rs 844.67 crore in FY19, up from Rs 457.5 crore in FY17. Going forward, Route Mobile's strategy would be to augment its cloud services across multiple channels of communication, cross sell and upsell multiple solutions to enterprises to become a one stop solution and adopt a bi-modal go to market strategy via its developer community programme. ICICI Securities, Axis Capital, Edelweiss Financial Services, IDBI Capital Markets & Securities are book running lead managers to the issue.
Park Hotels files draft papers with Sebi for Rs 1,000cr IPO
Apeejay Surrendra Park Hotels has filed draft papers with markets regulator Sebi for its proposed initial public offering to raise up to Rs 1,000 crore. The IPO comprises a fresh issue of up to Rs 400 crore and an offer-for-sale (OFS) of up to Rs 600 crore. The amount to be raised through OFS comprises up to Rs 125.4 crore by promoter selling shareholder, up to Rs 354.9 crore by Apeejay Pvt Ltd, up to Rs 84.7 crore by Apeejay House Pvt Ltd and Rs 34.9 crore by investor selling shareholders, according to the draft red herring prospectus (DRHP). The company proposes to utilise the net proceeds towards repayment/prepayment of certain borrowings availed and for general corporate purposes. The book running lead managers to the offer are ICICI Securities, Axis Capital and JM Financial. The shares of the company are proposed to be listed on the BSE and NSE. The company has presence in Bengaluru, Chennai, Hyderabad, Kolkata, Mumbai, Delhi-NCR as well as in other major cities such as Coimbatore, Jaipur, Jodhpur, Jammu, Navi Mumbai, Raipur and Visakhapatnam, the DRHP stated. The hospitality company has pioneered the concept of luxury boutique hotel in India under "THE PARK" brand.
|
15
|
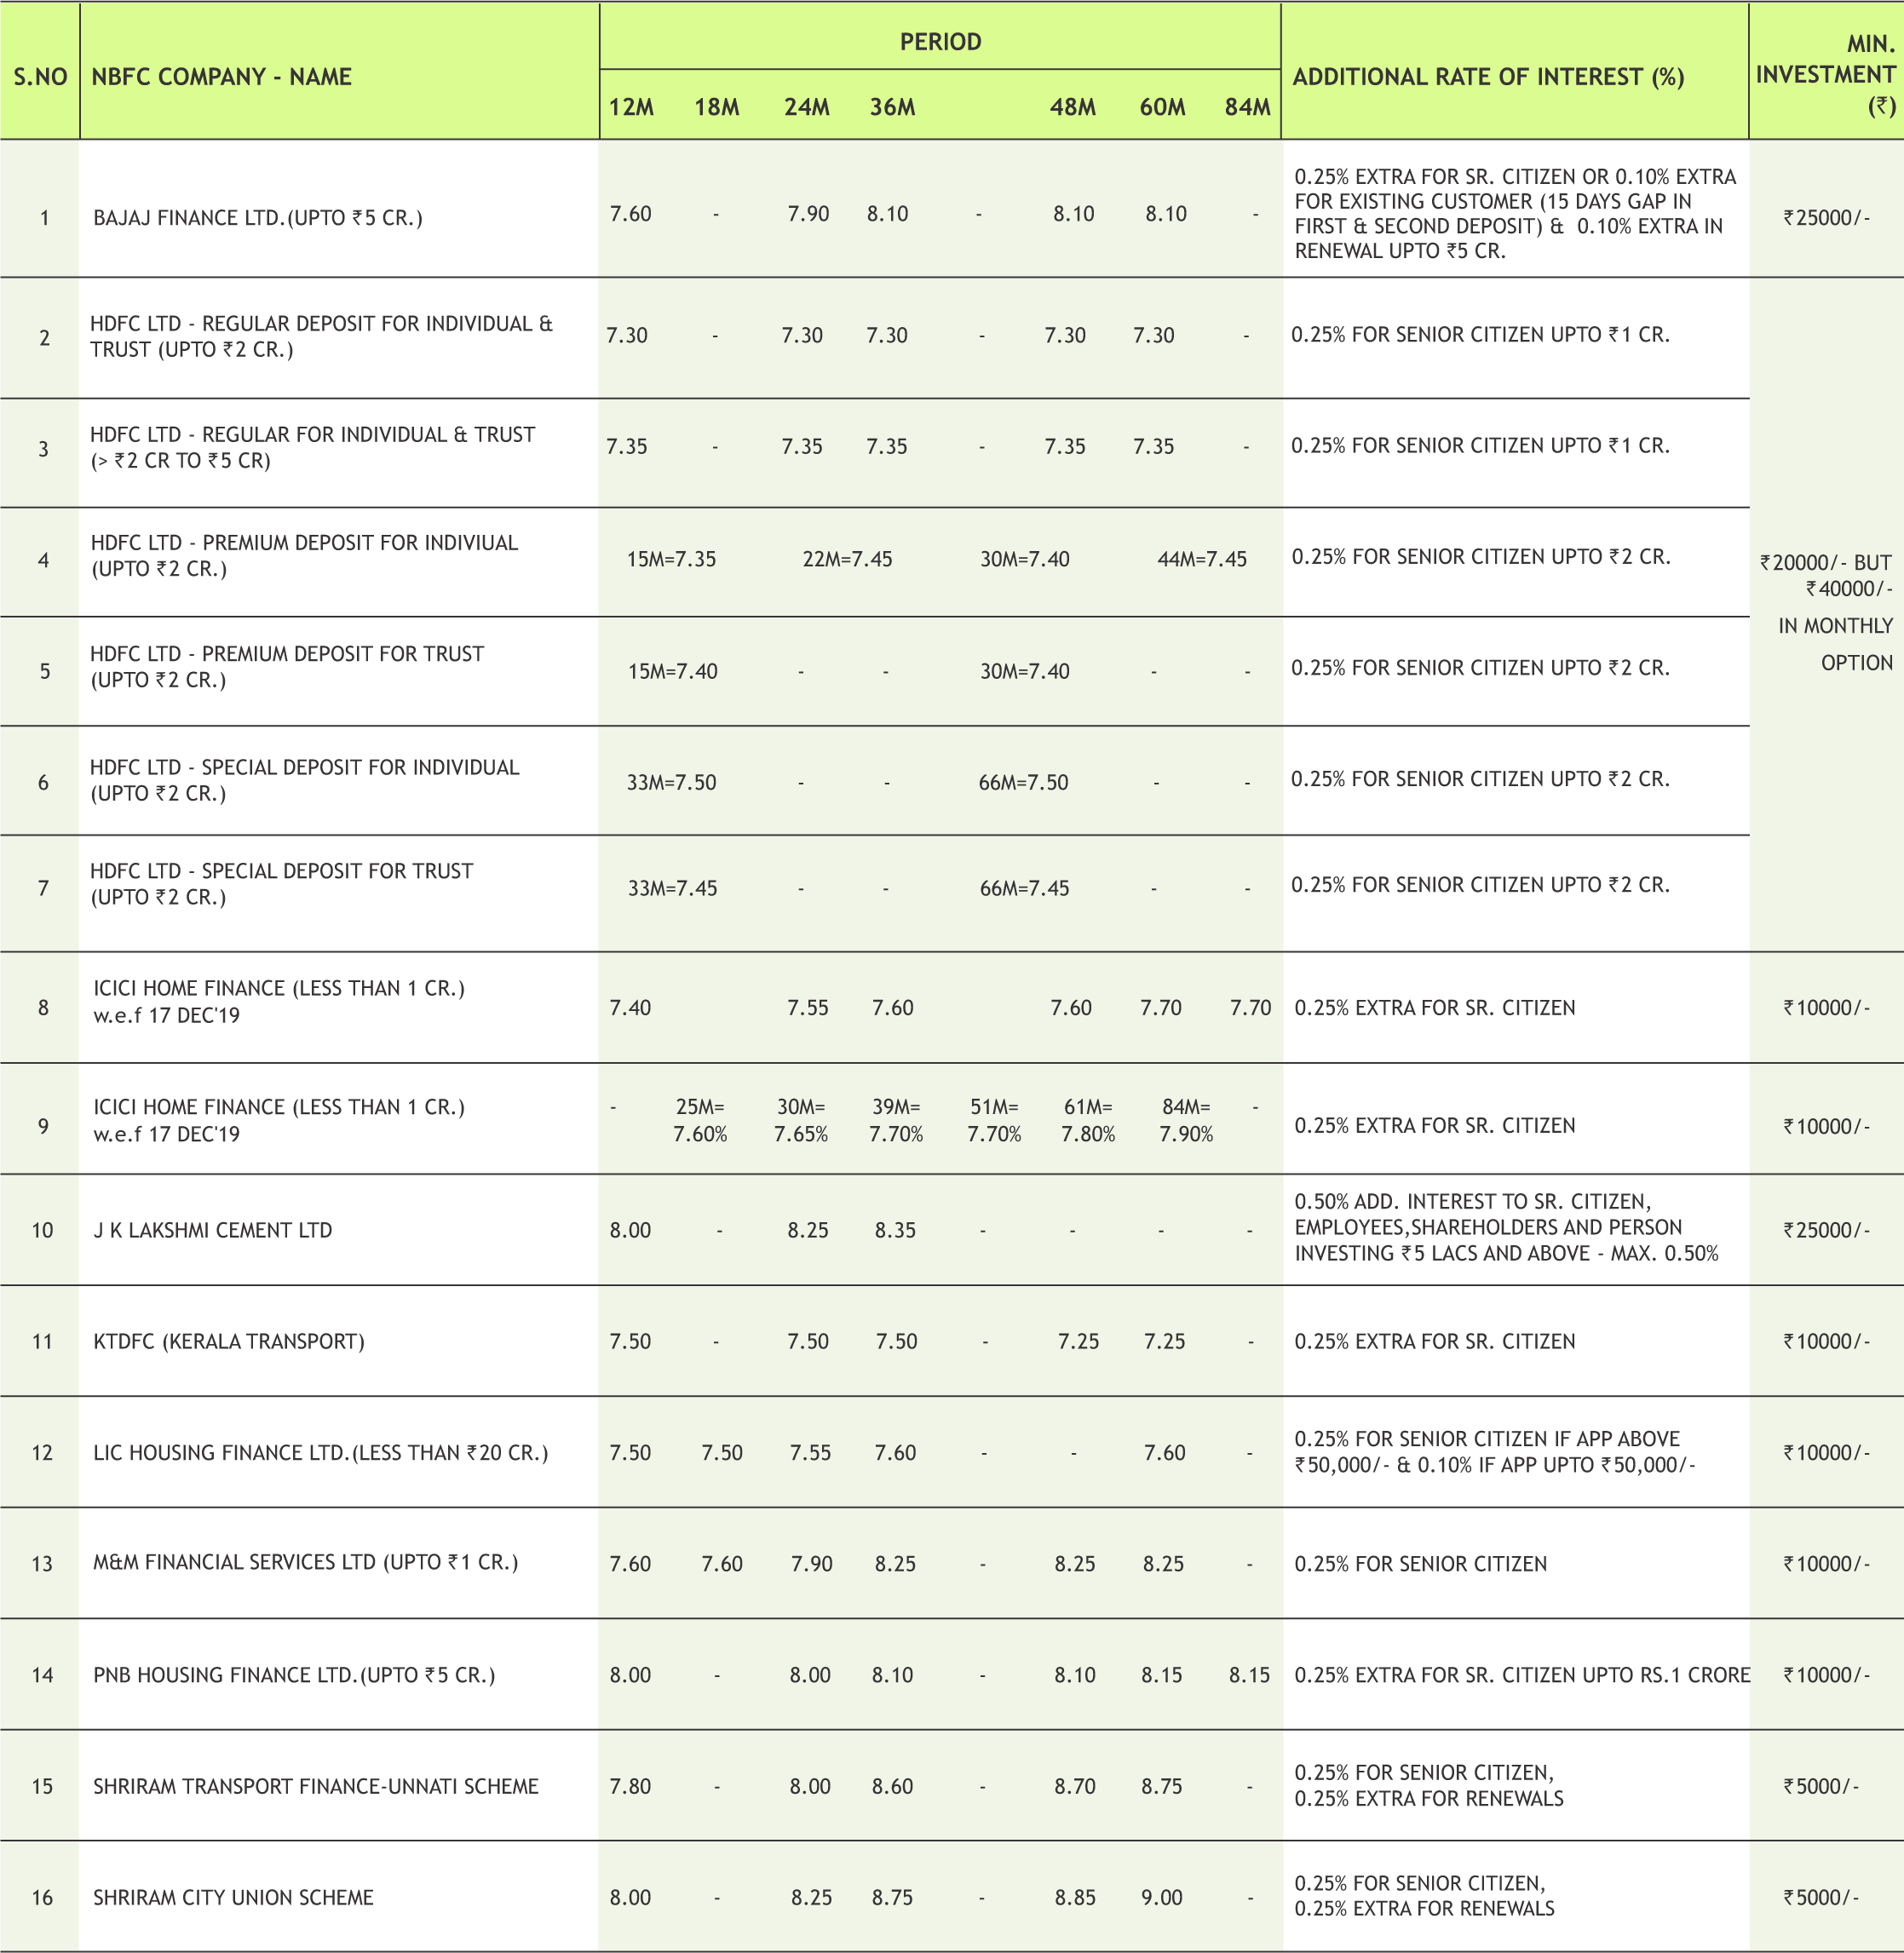
* Interest Rate may be revised by company from time to time. Please confirm Interest rates before submitting the application.
* For Application of Rs.50 Lac & above, Contact to Head Office.
* Email us at fd@smcindiaonline.com

16

|
|
|
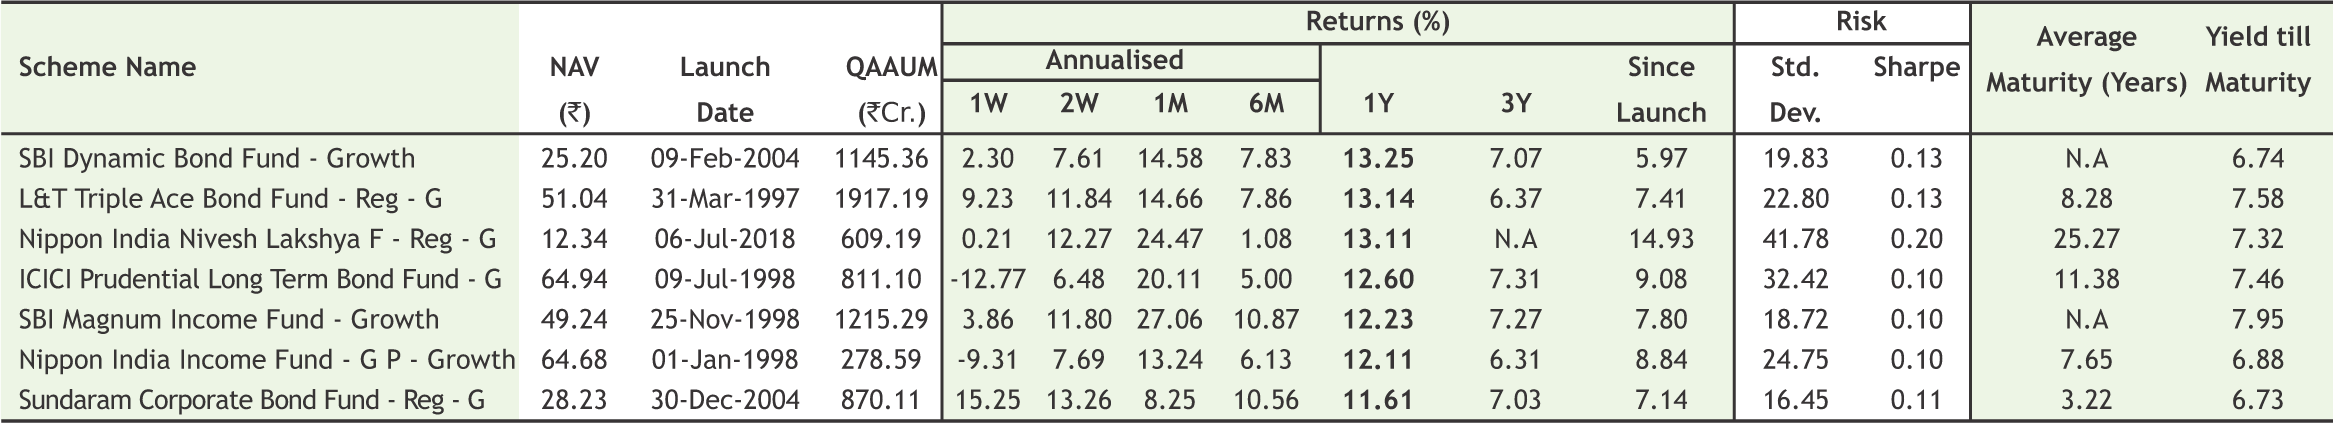
|
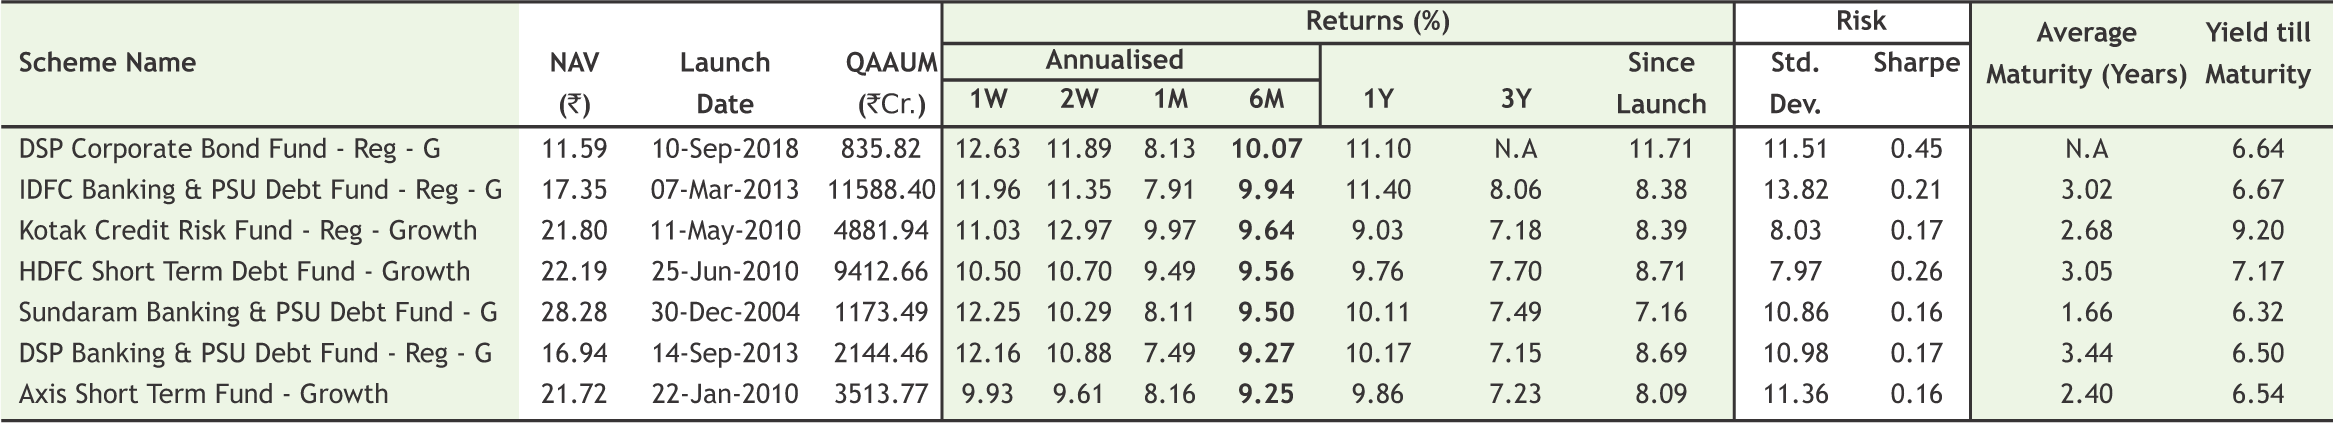
|
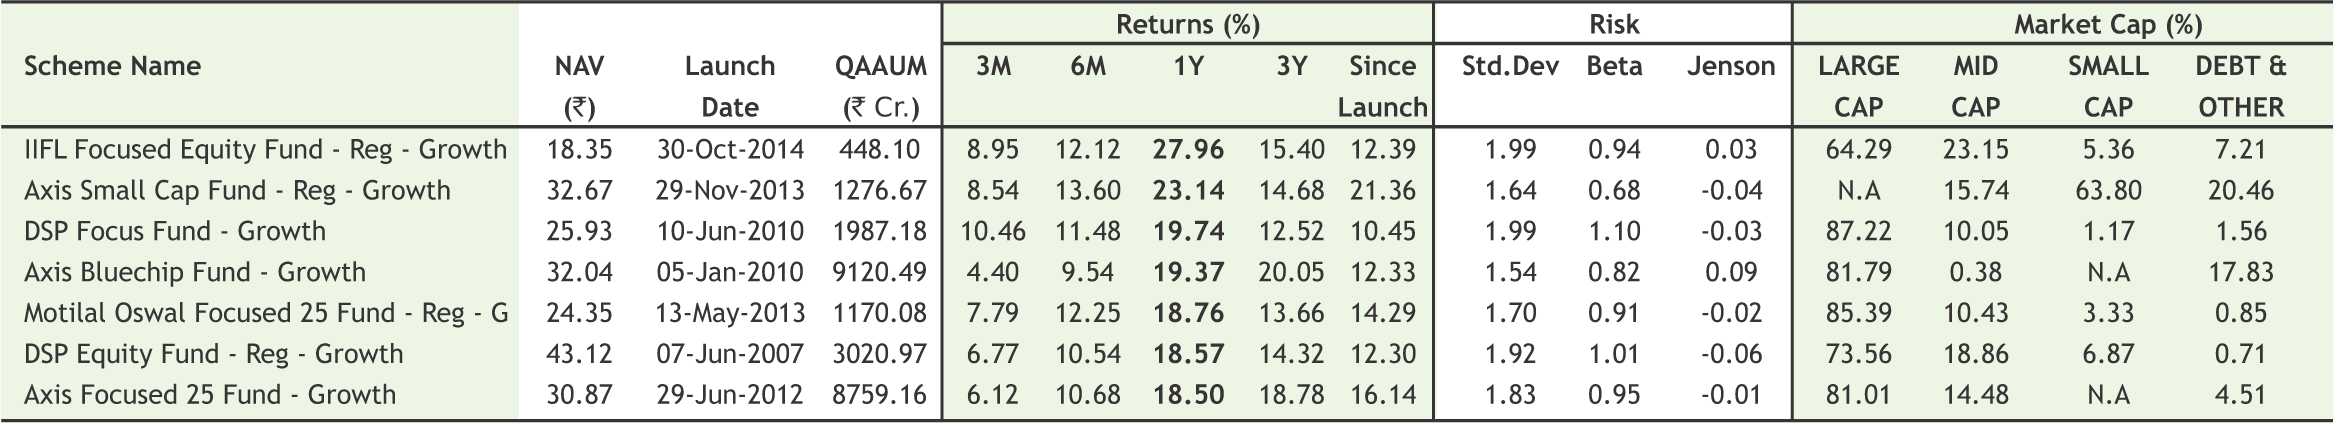
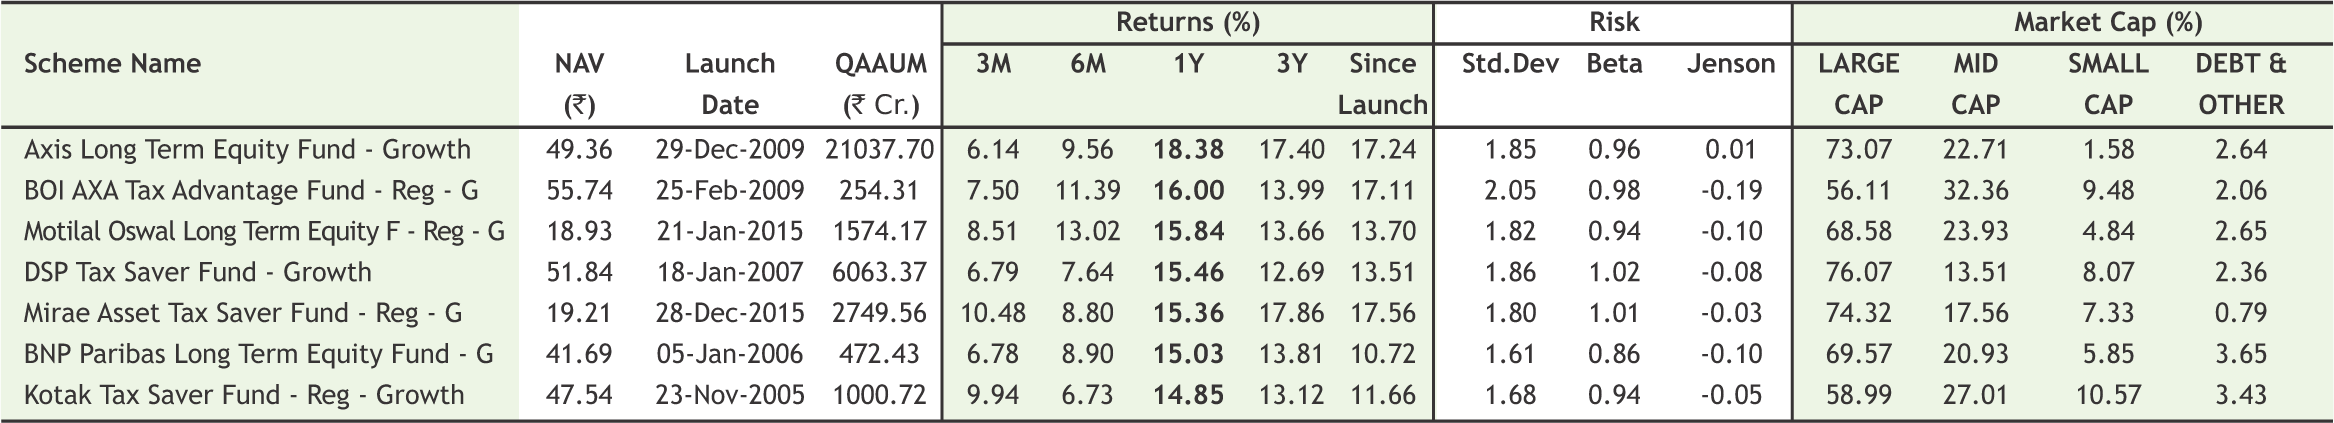
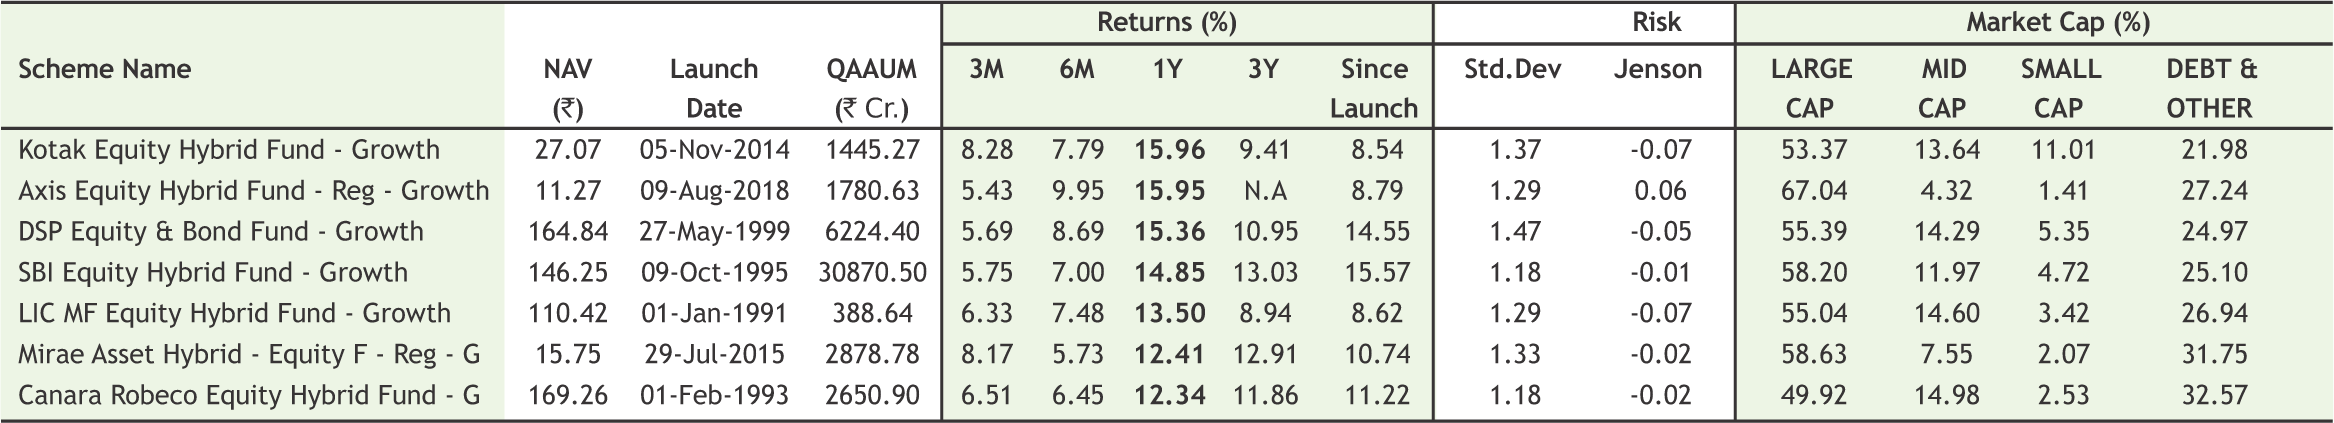
Note:Indicative corpus are including Growth & Dividend option . The above mentioned data is on the basis of 08/08/2019 Beta, Sharpe and Standard Deviation are calculated on the basis of period: 1 year, frequency: Weekly Friday, RF: 7%
*Mutual Fund investments are subject to market risks, read all scheme related documents carefully
18
New Year celebration Mr. Ajay Garg (Director & CEO, SMC Group), Mr. Anurag Bansal (Director, SMC Global Securities Ltd.) along with Branch Managers (West Zone).
New Year celebration Mr. Narendra Balasia (Regional Head, Kolkata) on 1st January 2020 at SMC Kolkata Branch.
New Year celebration Dr. D K Aggarwal (CMD, SMC Investments & President, PHDCCI), Mr. Ajay Garg (Director & CEO, SMC Group), Mr. Ayush Aggarwal (Director, SMC Global Securities Ltd.), Ms. Anshika Aggarwal (Whole Time Director- SMC Investments and Advisors Ltd.) along with SMCian's at Wealth building Pusa Road, New Delhi.


![]() Comprehensive Investment Solutions
Comprehensive Investment Solutions
![]() Goal Based Investment Advise
Goal Based Investment Advise
![]() Lower Risk by Diversifying Portfolio
Lower Risk by Diversifying Portfolio
![]() Long-term Focus
Long-term Focus
Call Toll-Free 180011 0909
Visit www.smcindiaonline.com
REGISTERED OFFICES:
11 / 6B, Shanti Chamber, Pusa Road, New Delhi 110005. Tel: 91-11-30111000, Fax: 91-11-25754365
MUMBAI OFFICE:
Lotus Corporate Park, A Wing 401 / 402 , 4th Floor , Graham Firth Steel Compound, Off Western Express Highway, Jay Coach Signal, Goreagon (East) Mumbai - 400063
Tel: 91-22-67341600, Fax: 91-22-67341697
KOLKATA OFFICE:
18, Rabindra Sarani, Poddar Court, Gate No-4,5th Floor, Kolkata-700001 Tel.: 033 6612 7000/033 4058 7000, Fax: 033 6612 7004/033 4058 7004
AHMEDABAD OFFICE :
10/A, 4th Floor, Kalapurnam Building, Near Municipal Market, C G Road, Ahmedabad-380009, Gujarat
Tel : 91-79-26424801 - 05, 40049801 - 03
CHENNAI OFFICE:
Salzburg Square, Flat No.1, III rd Floor, Door No.107, Harrington Road, Chetpet, Chennai - 600031.
Tel: 044-39109100, Fax -044- 39109111
SECUNDERABAD OFFICE:
315, 4th Floor Above CMR Exclusive, BhuvanaTower, S D Road, Secunderabad, Telangana-500003
Tel : 040-30031007/8/9
DUBAI OFFICE:
2404, 1 Lake Plaza Tower, Cluster T, Jumeriah Lake Towers, PO Box 117210, Dubai, UAE
Tel: 97145139780 Fax : 97145139781
Email ID : pankaj@smccomex.com
smcdmcc@gmail.com
Printed and Published on behalf of
Mr. Saurabh Jain @ Publication Address
11/6B, Shanti Chamber, Pusa Road, New Delhi-110005
Website: www.smcindiaonline.com
Investor Grievance : igc@smcindiaonline.com
Printed at: S&S MARKETING
102, Mahavirji Complex LSC-3, Rishabh Vihar, New Delhi - 110092 (India) Ph.: +91-11- 43035012, 43035014, Email: ss@sandsmarketing.in