2019: Issue 716, Week: 30th December,2019 - 3rd January,2020
A Weekly Update from SMC (For private circulation only)
WISE M NEY
NEY

2019: Issue 716, Week: 30th December,2019 - 3rd January,2020
A Weekly Update from SMC (For private circulation only)
NEY


![]() Comprehensive Investment Solutions
Comprehensive Investment Solutions
![]() Goal Based Investment Advise
Goal Based Investment Advise
![]() Lower Risk by Diversifying Portfolio
Lower Risk by Diversifying Portfolio
![]() Long-term Focus
Long-term Focus
Call Toll-Free 180011 0909
Visit www.smcindiaonline.com
| Equity | 4-7 |
| Derivatives | 8-9 |
| Commodity | 10-13 |
| Currency | 14 |
| IPO | 15 |
| FD Monitor | 16 |
| Mutual Fund | 17-18 |
G
lobal markets hit record highs and enjoyed “Santa Rally” boosted by optimism over a US-China trade deal and positive sentiment prevailing across the globe as 2019 drew to a close. During the year, market continued to rally on the factors such as US Federal Reserve’s policy easing, economic data that has come in above expectations, and corporate profits along with trade-related optimism. Actually, monetary stimulus from central banks has offset the effects of President Trump’s trade war and driven asset prices higher this year. The combined monthly balance-sheet expansion of the Federal Reserve, European Central Bank and Bank of Japan will end this year at the highest level since 2017. At this juncture, investors are betting that business investment, corporate earnings and emerging market economies will now revive.
Back at home, 2019 will go down in history as a year when both Sensex and Nifty clocked record highs. Nifty and Sensex have risen around 13 and 15 percent respectively so far in 2019. Going into the year 2020, it is expected that the New Year should be a year of revival when we actually start witnessing a revival in GDP growth rate. Moreover, it is believed that the policy actions taken by the government and the central government will start yielding results going forward. Market will continue to perform as a possible recovery in India’s GDP growth rate is likely to induce a lot of enthusiasm among retail investors. The domestic market is expected to wait for cues from the budget. Market participants are now waiting for fourth-quarter earnings in January for indication on whether sentiment among corporates has actually improved.
On the commodity market front, 2019 is about to end and it seems that commodities are giving a very strong farewell with its sharp upside move in the last leg of year. CRB saw gradual upside from past four weeks. Bullion counter may continue its upside momentum as investors preferred to put bets in the safe haven metal during the holiday season as uncertainties around the US China phase-1 deal still exists in the absence of any concrete details of the same. Meanwhile gold silver ratio dipped from nearly 89 to below 85 has silver outperformed gold. Crude oil may move further higher as it can test 4550 levels while taking support near 4300 levels. Base metal counter may remain trade positive. Advance Goods Trade Balance, Consumer Confidence Index, ISM Employment and ISM Manufacturing of US, Manufacturing PMI of China, Canadian Manufacturing PMI, German Unemployment Claims Rate and German Consumer Price Index EU Harmonized¸ etc are few major triggers, if we talk about economic releases this week. Thin trading volume is expected as traders are still in holiday mood to celebrate New Year after celebrating Christmas and thus Indian market may lack cues.
May the New Year bring you happiness, peace and prosperity. Wishing you a joyous 2020!
Happy Investing!!!

SMC Global Securities Ltd. (hereinafter referred to as “SMC”) is a registered Member of National Stock Exchange of India Limited, Bombay Stock Exchange Limited and its associate is member of MCX stock Exchange Limited. It is also registered as a Depository Participant with CDSL and NSDL. Its associates merchant banker and Portfolio Manager are registered with SEBI and NBFC registered with RBI. It also has registration with AMFI as a Mutual Fund Distributor.
SMC is a SEBI registered Research Analyst having registration number INH100001849. SMC or its associates has not been debarred/ suspended by SEBI or any other regulatory authority for accessing /dealing in securities market.
SMC or its associates including its relatives/analyst do not hold any financial interest/beneficial ownership of more than 1% in the company covered by Analyst. SMC or its associates and relatives does not have any material conflict of interest. SMC or its associates/analyst has not received any compensation from the company covered by Analyst during the past twelve months. The subject company has not been a client of SMC during the past twelve months. SMC or its associates has not received any compensation or other benefits from the company covered by analyst or third party in connection with the research report. The Analyst has not served as an officer, director or employee of company covered by Analyst and SMC has not been engaged in market making activity of the company covered by Analyst.
The views expressed are based solely on information available publicly available/internal data/ other reliable sources believed to be true.
SMC does not represent/ provide any warranty express or implied to the accuracy, contents or views expressed herein and investors are advised to independently evaluate the market conditions/risks involved before making any investment decision.
DOMESTIC NEWS
Economy
• The International Monetary Fund said India has limited room for fiscal stimulus and stressed the need for fiscal consolidation as it has one of the highest debt among the emerging markets. The IMF staff estimated that India's public sector needs to borrow the amount equivalent to around 8.5 percent of GDP in order to pay for the services it provides.
Power
• NTPC is planning to add 10GW of solar energy generation capacity by 2022, which entails an investment of around Rs 50,000 crore, to be funded mainly by green bonds. It has formulated a long-term plan to become a 130GW company by 2032 with 30 percent non-fossil fuel or renewable energy capacity.
• Tata Power received a letter of intent (LoI) for a power distribution licence in Odisha’s five circles for the distribution and retail supply of electricity. The five circles will add 2.5 million consumers to Tata Power’s existing consumer base of 2.5 million through its other distribution areas — Mumbai, Delhi and Ajmer.
Oil & Gas
• ONGC has received environment clearance (EC) for carrying out onshore exploration, development and production of oil and gas in 100 locations in non-forest area of Assam that would entail an investment of Rs 3,500 crore, according to official documents.
Realty
• Dilip Buildcon has executed the EPC Agreement with the Uttar Pradesh Expressways Industrial Development Authority (UPEIDA) for EPC project in the state of Uttar Pradesh. The Rs 1362.06 crore project entails development of Bundelkhand Expressway Project from Bakhariya (Dist. Auraiya) to Kudrail (Dist. Etawah) access controlled (greenfield) expressway project.
Information Technology
• HCL Technologies has announced the opening of a Global Delivery Center (GDC) in Moncton, New Brunswick, Canada. The GDC will focus on technology areas in application development, support, testing, and servicing global clients. HCL has partnered with Opportunities New Brunswick (ONB) in the planning and development of this growth. Opportunities New Brunswick provided guidance and resources for the GDC and future employees.
HCL Technologies announced a partnership with Critical Manufacturing to provide pre-and post-sales consulting, development, and implementation support. The partnership involves Critical Manufacturing's Manufacturing Execution Systems (MES) customers in the complex manufacturing for hitech, semiconductor, and medical device manufacturing industries.
Automobile
• TVS Motor Company launched the TVS NTorq 125 Race Edition in Nepal. The NTorq 125 Race Edition gets a hazard light along with new body graphics and three tone colour combination. In India, The TVS NTorq 125 Race Edition is priced at ₹ 62,995 (ex-showroom, Delhi).
Capital Goods
• Bharat Heavy Electricals has successfully commissioned the first Lignite based 500 MW thermal unit of the 2x500 MW Neyveli New Thermal Power Project in Tamil Nadu. The second unit of the project is also in an advanced stage of commissioning. The order for Boiler, Turbine & Generator (BTG) package for two units of 500 MW Lignite based thermal plant at Neyveli was placed on BHEL by NLCIL.
Metals
• Hindalco Industries announced that the Muri refinery in Jharkhand has re-started production of Alumina. The Plant had initiated the start-up process after receiving the Consent to Operate from the Jharkhand State Pollution Control Board (JSPCB). Going forward, the Company may not need to import Alumina.
INTERNATIONAL NEWS
• US initial jobless claims fell to 222,000, a decrease of 13,000 from the previous week's revised level of 235,000. Economists had expected jobless claims to drop to 224,000 from the 234,000 originally reported for the previous week.
• US new home sales jumped by 1.3 percent to an annual rate of 719,000 after plunging by 2.7 percent to a revised rate of 710,000 in October. Economists had expected new home sales to inch up by 0.1 percent to 734,000 from the 733,000 originally reported for the previous month.
• China's Industrial profits expanded 5.4 percent year-on-year in November, in contrast to a 9.9 percent decrease in October.
• Retail sales in Japan were up a seasonally adjusted 4.5 percent on month in November. That was shy of expectations for an increase of 5.0 percent following the 14.2 percent plunge in October.
| Stocks | *Closing Price | Trend | Date Trend Changed | Rate Trend Changed | SUPPORT | RESISTANCE | Closing S/l |
|---|---|---|---|---|---|---|---|
| S&P BSE SENSEX | 41575 | UP | 08.02.19 | 36546 | 36300 | 35300 | |
| NIFTY50 | 12246 | UP | 08.02.19 | 10944 | 10900 | 10600 | |
| NIFTY IT | 15781 | UP | 21.07.17 | 10712 | 15200 | 14800 | |
| NIFTY BANK | 32412 | UP | 30.11.18 | 26863 | 27700 | 27000 | |
| ACC | 1451 | DOWN | 04.10.19 | 1488 | 1520 | 1540 | |
| BHARTIAIRTEL | 455 | UP | 15.03.19 | 338 | 410 | 390 | |
| BPCL | 491 | UP | 30.08.19 | 355 | 470 | 450 | |
| CIPLA | 481 | UP | 25.10.19 | 460 | 450 | 440 | |
| SBIN | 337 | UP | 01.11.19 | 314 | 315 | 305 | |
| HINDALCO | 215 | UP | 13.12.19 | 208 | 200 | 194 | |
| ICICI BANK | 549 | UP | 20.09.19 | 418 | 510 | 500 | INFOSYS | 737 | UP | 20.12.19 | 732 | 700 | 685 |
| ITC | 237 | DOWN | 31.05.19 | 279 | 260 | 270 | |
| L&T | 1300 | DOWN | 15.11.19 | 1378 | 1370 | 1390 | |
| MARUTI | 7345 | UP | 27.12.19 | 7345 | 7000 | 6900 | |
| NTPC | 117 | DOWN | 16.08.19 | 118 | 120 | 124 | |
| ONGC | 128 | DOWN | 06.12.19 | 127 | 136 | 141 | |
| RELIANCE | 1542 | UP | 16.08.19 | 1278 | 1530 | 1500 | |
| TATASTEEL | 470 | UP | 01.11.19 | 396 | 420 | 400 | |
Closing as on 13-12-2019
NOTES:
1) These levels should not be confused with the daily trend sheet, which is sent every morning by e-mail in the name of "Morning Mantra ".
2) Sometimes you will find the stop loss to be too far but if we change the stop loss once, we will find more strength coming into the stock. At the moment, the stop loss will be far as we are seeing the graphs on weekly basis and taking a long-term view and not a short-term view.
| Meeting Date | Company | Purpose |
|---|---|---|
| 30-Dec-19 | Jindal Poly Films | Demerger |
| 30-Dec-19 | Ingersoll Rand (India) | Special Dividend - Rs 25 PrSh |
| 30-Dec-19 | Piramal Enterprises | Rights 11:83 @ Premium Rs 1298/- |
| 24-Jan-20 | HCL Technologies | Interim Dividend |
| Meeting Date | Company name | Purpose |
|---|---|---|
| 30-Dec-19 | Balmer Lawrie & Co | Bonus/Other business matters |
| 7-Jan-20 | GM Breweries | Financial Results |
| 17-Jan-20 | HCL Technologies | Financial Results/Dividend |
| 17-Jan-20 | ICICI Lombard | Financial Results |
| 18-Jan-20 | HDFC Bank | Financial Results |
| 21-Jan-20 | HDFC AMC | Financial Results |
| 21-Jan-20 | Rane (Madras) | Financial Results |
| 21-Jan-20 | ICICI Prud. Life Ins. Co. | Financial Results |
| 22-Jan-20 | Axis Bank | Financial Results |
| 22-Jan-20 | Rane Engine Valve | Financial Results |
| 22-Jan-20 | CEAT | Financial Results |
| 23-Jan-20 | PNB Housing Finance | Financial Results |
| 23-Jan-20 | Kokuyo Camlin | Financial Results |
| 23-Jan-20 | HT Media | Financial Results |
| 23-Jan-20 | EIH Associated Hotels | Financial Results |
| 24-Jan-20 | EIH | Financial Results |
| 25-Jan-20 | ICICI Bank | Financial Results |
4


5
BAJAJ AUTO LIMITED
CMP: 3230.10
Target Price: 3710
Upside: 15%
| Face Value (Rs.) | 10.00 |
| 52 Week High/Low | 3289.50/2400.00 |
| M.Cap (Rs. in Cr.) | 93468.44 |
| EPS (Rs.) | 162.34 |
| P/E Ratio (times) | 19.90 |
| P/B Ratio (times) | 4.20 |
| Dividend Yield (% | 1.86 |
| Stock Exchange | BSE |

Investment Rationale
• B ajaj Auto is a global two-wheeler and threewheeler manufacturing Company which is based in Pune, Maharashtra. It manufactures motorcycles, scooters and auto rickshaws. Its plants include Waluj plant, Chakan plant and Pantnagar plant.
• The company’s domestic motorcycle retail market share stands at 20% while domestic CV market share stood at 59.4% in 2QFY20. On the development front, the management of the company is expected to launch new models in its executive and premium segments, which will help improve market share gradually over the medium term. Furthermore, the company also expects to launch electric two-wheeler Bajaj Chetak till January 2020 in Pune followed by Banglore while management of the company expects to see improvement in 3W segment from April onwards.
• On exports front, the management has maintained that exports are doing well and the exports for Pulsar brand have improved significantly in new markets of Bangladesh, Nepal and Malaysia. The firm registered its highest ever exports sales. Exports jumped 14% to 1.95 lakh units in November 2019 compared with 1.72 lakh units in November 2018. Total domestic sales slipped 12% to 2.07 lakh units in November 2019 as against 2.34 lakh units in November 2018.
• The company will resume sales in Egypt going forward. The management also indicated that it has a robust pipeline of products for the next 18 months.
• On the development front, the company ties up with Husquarna brand under KTM Austria and expected to commence production during current financial year and would launch product during Q1FY21.Moreover, its tie up with Triumph is under process.
• On the financial front, the margins of the company has improved during Sep 2019 quarter to 16.9% driven by price hike, change in product mix and dollar realization. Moreover, realization of the
company has also improved by 6% QoQ as the company upgraded the product portfolio in the entry level segment.
• Regarding the outlook for the industry, management feels that with the coming rural demand; market share and demand of the company would grow. The management feels that 10% to 12% growth in exports is doable on a 5-years CAGR basis. For domestic motorcycle, 14% CAGR growth is possible over 5 years.
Risk
• Currency fluctuation
• Commodity pricing
Valuation
Strong growth in Value of New Business on the back of increased retail renewal premium will ensure healthy return ratios for the company, also rise in the working population category and per capita income would lead to increase in demand for life insurance products. The focus continues to be on growing absolute Value of New Business using the Four-P strategy of focusing on Premium growth, Protection, Persistency and Productivity. This has yielded the desired outcome and the company has been able to grow VNB with uncompromising focus on quality. Thus, it is expected that the stock will see a price target of Rs.564 in 8 to 10 months time frame on a current P/BV of 10x and FY21 BVPS of Rs 56.36.

BANK OF BARODA
CMP: 99.00
Target Price: 120
Upside: 21%
| Face Value (Rs.) | 2.00 |
| 52 Week High/Low | 143.60/85.70 |
| M.Cap (Rs. in Cr.) | 45743.61 |
| EPS (Rs.) | 2.01 |
| P/E Ratio (times) | 49.25 |
| P/B Ratio (times) | 0.64 |
| Dividend Yield (%) | 1.18 |
| Stock Exchange | BSE |

Investment Rationale
• The bank has expanded its operations through mergers of Dena bank and Vijaya Bank and it is amongst the five largest banks in India with a domestic branch network presence through 9,449 branches & 13,153 ATMs and Cash Recyclers supported by self-service channels. Well distributed branch network with 31% coverage in Rural, 27% in Semi-urban, 23% Metro and 20% Urban. The customer base of banks stood at 13 crore, while the bank has workforce of 86170 employees. The Bank has a significant international presence with a network of 100 overseas offices spanning 21 countries.
• Global business of the bank grew by 2% yoy to Rs 1531470 crore at end September 2019. The business growth was driven by domestic business rising 3% to Rs 1316666 crore, while overseas business declined 2% to Rs 214804 crore at end September 2019.
• Global deposits increased 3% to Rs 894130 crore, while global advances moved up 3% to Rs 637340 crore at end September 2019. Credit-deposit ratio of the merged entity rose on sequential basis to 71.3% at end September 2019 from 70.7% a quarter ago and 70.7% a year ago. Contribution of Bank's International Business at the end of September 2019 was 14.2 % compared with 14.6% as of September 2018 due to effect of rationalisation of overseas operations setting in.
• Net Interest Income (NII) of the merged entity increased 10% to Rs 7027.93 crore in the quarter ended September 2019. Interest income increased 8% to Rs 19274 crore, while interest expenses rose 6% to Rs 12246 crore in Q2FY2020.
• The bank aims to reduce NNPA ratio below 3% and improve provisions coverage ratio to 80-85% by end
March 2020.
• During Q2FY2020, the bank has reported net profit of Rs 736.68 crore with the improved margins and strong growth in non-interest income and decline in expense ratio. However, the bank has witnessed increase in credit cost for Q2FY2020.
Risk
• Regulatory Provisioning on assets
• Corporate Governance issue
Valuation
A pickup in the investment cycle, higher growth in retail & SME segments, healthy fee income growth, and growth in CASA would lead to a rebound in RoAs. The transformation journey aims at improved market share, quality business growth, portfolio diversification and enhanced fee income, with cutting edge digitization of processes, while ensuring due focus is accorded to compliance and controls. Thus, it is expected that the stock will see a price target of Rs.120 in 8 to 10 months time frame on an expected P/Bvx of 0.75x and FY21 BVPS (Book Value Per Share) of Rs.160.18.

Source: Company Website Reuters Capitaline
Above calls are recommended with a time horizon of 8 to 10 months.
6

The stock closed at Rs 760.15 on 27th December 2019. It made a 52-week low of Rs 603.45 on 26th December 2018 and a 52-week high of Rs. 827.75 on 04th June 2019. The 200 days Exponential Moving Average (DEMA) of the stock on the daily chart is currently at Rs 711.23
After finding support around 620 levels, the stock started moving higher. From past few weeks, the stock has consolidated in range of 710 to 755 levels with positive bias and has given the breakout of same by registering gains over 2.5% in last week. It also has closed above the breakout levels so buying momentum can continue for coming days. Therefore, one can buy in the range of 750-754 levels for the upside target of 810-820 levels with SL below 715.

The stock closed at Rs 345.15 on 27th December, 2019. It made a 52-week low at Rs 252 on 14th February 2019 and a 52-week high of Rs. 371.60 on 04th June 2019. The 200 days Exponential Moving Average (DEMA) of the stock on the daily chart is currently at Rs 306.83
As we can see on charts that the stock is forming an “Inverted Head and Shoulder” pattern on weekly charts, which is bullish in nature. Apart from this, technical indicators such as RSI and MACD are also suggesting buying for the stock. So one can initiate long in range of 340-342 levels for the upside target of 370-375 levels with SL below 325.
Disclaimer : The analyst and its affiliates companies make no representation or warranty in relation to the accuracy, completeness or reliability of the information contained in its research. The analysis contained in the analyst research is based on numerous assumptions. Different assumptions could result in materially different results.
The analyst not any of its affiliated companies not any of their, members, directors, employees or agents accepts any liability for any loss or damage arising out of the use of all or any part of the analysis research.
SOURCE: CAPITAL LINE
Charts by Spider Software India Ltd
Above calls are recommended with a time horizon of 1-2 months
7
Snapping the three day losing streak, Indian markets started the January series on a positive note with Nifty once again reclaiming 12200 levels and bank nifty 32400 levels supported by gains in financial counters. From derivative front, 12200 put strike added hefty open interest while marginal call writing was observed at 12300 strike. The technical setup at current juncture suggests that whatever fall Nifty has witnessed from its record peaks was profit booking at higher levels and the bounce from key support levels once again can add further momentum into the prices towards record peak. On the higher side, 12300-12350 zone would act as immediate resistance for the Nifty while banknifty has hurdle at 32500 levels. Though the broader trend is bullish for the markets, thus any dip into the prices towards support levels should be used to create fresh long positions. The immediate support for the Nifty is placed at 12200 & 12150 levels. The Implied Volatility (IV) of calls closed at 11.13% while that for put options closed at 12.10%. The Nifty VIX for the week closed at 11.12% and is expected to remain volatile. PCR OI for the week closed at 1.15. In coming week, we believe that still lot of outstanding short position is held with call writers and we might witness another round of short covering once Nifty surpasses 12300 levels.


8

|

|


|

|
**The highest call open interest acts as resistance and highest put open interest acts as support.
# Price rise with rise in open interest suggests long buildup | Price fall with rise in open interest suggests short buildup
# Price fall with fall in open interest suggests long unwinding | Price rise with fall in open interest suggests short covering
9
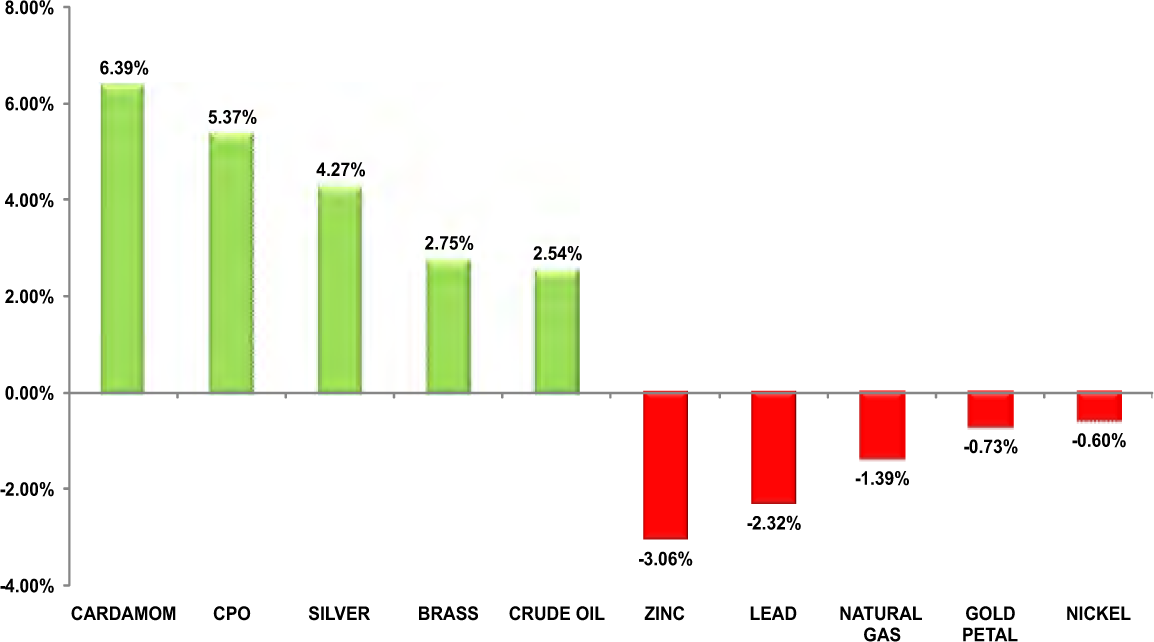
Turmeric futures (Mar) is expected to hold on to its three months support levels near 5500 levels, while the upside may remain capped near 6800 levels. According to traders, the quality of arrivals in the mandis is lower. On the contrary, the demand from North India is continuing to be sluggish. The market is now eyeing the arrival of new crops, which will start from the end of the next month. Additionally, the sufficient carryover stocks are weighing on prices. Jeera futures (Jan) will probably trade sideways and consolidate in the range of 16300-16800 levels. The exporters are cautious and waiting for the extension of partially restored merchandise export of India scheme incentive, which will expire on December 31. Secondly, the overseas inquiries are lower as the fresh arrivals have started in other major producing countries like Syria and Turkey & it is expected to pick-up gradually. On the supply side, rise in acreage in Gujarat is also weighing on prices. The acreage was at 4,16,639 hectares as on December 23, up 30% as compared with 3,21,363 hectares a year ago, state farm department data showed. Coriander futures (Jan) is likely to remain trapped in the range of 6300-6850 levels. The supplies are getting affected on the spot markets of Rajasthan due to intense cold wave. While on the other side, the adverse weather conditions in key growing areas have hit the sown crop. Cardamom futures (Jan) is likely to trade higher towards 3600 levels. The factors of lower production & strong demand across the consuming markets in North India have pushed up the average price realization to more than Rs.4000 per kg in the auctions market.
Bullion counter may continue its upside momentum as investors preferred to put bets in the safe haven metal during the holiday season as uncertainties around the US China phase-1 deal still exists in absence of any concrete details of the same. Meanwhile, concerns about the implications of President Donald Trump’s recent impeachment by the House, and worries about stock market valuations being stretched at least in the U.S also boosted yellow metal. But investors are skeptical about the move because of the light volume, but recent data from the US government shows that hedge funds have been accumulating gold futures contracts for at least a month. Gold may continue its recovery as it can test 39400 levels by taking support near 38200 levels whereas silver may recover towards 47600 levels while taking support near 45800 levels. A report that North Korea’s leader Kim Jong Un held a meeting of top military officials to discuss boosting the country’s military capability also supported gold. North Korea may not have delivered a so-called “Christmas gift” to the United States, at least not on Christmas Day, but U.S.-North Korea tensions appear far from resolved as Pyongyang’s end-of-year deadline for nuclear talks approaches. North Korean leader Kim Jong Un’s annual New Year’s Day speech will also be closely watched. Meanwhile, gold silver ratio dipped from nearly 89 to below 85 as silver outperformed gold. This ratio can further dip towards 82 in near term. The gold-silver ratio had hit the level of 94 in July 2019, the weakest since 1991.
The bull-run of soybean futures (Jan) is likely to get extended towards 4600 levels. The sentiments are firm due to strong demand from crushing plants amid lower supply in spot markets. Quality damage and yield loss has been reported for the new season crop due to the unseasonal and extended rainfall. Apart from quality, output is also expected to remain lower than its preliminary estimates. The next upsurge in mustard futures (Jan) can be seen to reach 4700-4720 levels, only if it surpasses the previous high of 4668. However, the support in near term is at 4550 levels. The market participants are cautious & closely watch the flowering stage of this oilseeds & the impact of the ongoing severe winters on the yield of this oilseed crop. Soy oil futures (Jan) has already seen a run-up of more than 29% last year and the gain doesn’t seem to take a pause in near future. In days to come, it can move more upside to test 940-960 levels. Similarly, CPO has almost doubled last year, giving a return of more than46% year-on-year. The bullish news coming from the international market that Indonesia is pushing for biodiesel mandatory to mix 30% palm-based fuel in a bid to slash its fuel import bill and boost domestic palm oil consumption, will definitely act as a catalyst for rocketing palm oil prices. In Malaysia also there is forecast a steeper-than expected drop in production. The ripple impact of these will surely be bullish on the domestic edible oil price. Saying this, the January contract is expected to rally further towards a new lifetime high of 800-820 levels.
Crude oil prices may remain on firm path as it hits 3 months high amid lower U.S. crude inventories, optimism around the China U.S. trade war and OPECled efforts to curb the oversupply. Crude oil may move further higher as it can test 4550 while taking support near 4300. Meanwhile the API reported that U.S. Stockpiles dropped 7.9 million barrels in the penultimate week. Prices got further boost after President Trump reported that U.S and China would have signing ceremony for so-called Phase 1 agreement to end their trade dispute. Oil prices have also been buoyed by robust hopes that the New Year will usher in an end to the long-running U.S.-China trade tariff war, a dispute that has overshadowed global economic growth prospects and left question marks over future demand for crude. Lower demand also rendered supply cuts by the Organization of Petroleum Exporting Countries (OPEC) and allies including Russia less effective in supporting the market. The so-called OPEC+ grouping agreed in November to extend and deepen production cuts that would take as much as 2.1 million barrels per day (bpd) of supply off the market, or roughly 2% of global demand. Weather related developments to keep natural gas on sideways path as prices can move higher towards 170-175 in near term. According to NatGasWeather “Strong high pressure will dominate much of the US with much warmer than normal conditions where highs will reach the 40s to 70s, warmest over the southern US”.
Cotton on the national bourse is trapped in sideways movement following its bearish fundamentals of rising supplies on the spot markets. There are possibilities that we may see another round of consolidation in the range of 19200-19700 levels. According to traders, the mills are not ready to purchase cotton at the current price. On the supply side, the crop is seen higher and we may see better yields in third and fourth rounds of picking due to better soil moisture. The Cotton Association of India estimated total cotton supply till end of the cotton season i.e. upto 30th September 2020 at 403 lakh bales of 170 kgs. The price scenario of cotton is just the opposite in the international market, wherein it is trading near its four month high of 69.34 cents per pound on CBOT. There is optimism among the market participants amid the news of that the U.S. and China will be having a signing ceremony of the first phase of the trade deal agreed to this month. In days to come, we may see a good buying in chana Import of peas has come to a grinding halt after the government changed its status from the ‘free’ to the ‘restricted’ category and levied a minimum import price (MIP) last week. While chana is a cheaper substitute, demand from the stockiest may push the January contract to 4700, if it breaks the previous high near 4611. Cocud futures (Jan) is looking bullish and the potential to test 2300-2350 on the higher side, taking support near 2155. In the present scenario, the supply of cotton seed has come down in recent days due to the majority of purchases from the Cotton Corporation of India.
Base metal counter may remain on a positive path. Copper may take support near 435 levels and recover towards 450 levels. China’s copper smelters raised their floor treatment and refining charges (TC/RCs) for the first quarter of 2020 to $67 a tonne and 6.7 cents a pound. China's imports of scrap metal in November rose by 6.3% MoM to 170,000 tonnes. China's refined copper output rose 19.6% YoY to a record monthly high of 909,000 tonnes in November 2019. Meanwhile, lead may remain sideways as it can move in the range of 150-158 levels. Moreover, China issued a pollution alert in the central province of Henan where a numerous lead smelters located which might lead to reduction in output. Lead prices found some support after rising significantly on the shanghai exchange over expectation of restocking of battery material might resume in January 2020. According to ILZSG “For the first 10 month of the year, lead demand exceeded supply by 81,000 tonnes”. Zinc may recover towards 188 levels while taking support near 174 levels. According to the ILZSG “the global zinc deficit reached 152,000 tons for the first 10 months of the year”. Nickel prices can move with sideways path as it may face resistance near 1055 while taking support near 1000 levels. Aluminium prices can recover towards 140 levels by taking support near 133 levels. China's Henan Shenhuo Group is set to commence production at the first 150,000 tonne per annum of its aluminium smelting project in Wenshan prefecture, Yunnan province.
10

|

CRUDE MCX (JAN) contract closed at Rs. 4403.00 on 26th Dec’19. The contract made its high of Rs. 4417.00 on 27th Dec’19 and a low of Rs. 3825.00 on 22st Oct’19. The 18-day Exponential Moving Average of the commodity is currently at Rs. 4280. On the daily chart, the commodity has Relative Strength Index (14-day) value of 67.188.
One can buy near Rs. 4350 for a target of Rs. 4550 with the stop loss of Rs. 4250.

COPPER MCX (JAN) contract closed at Rs. 444.90 on 26th Dec’19. The contract made its high of Rs. 454.05 on 07th Nov’19 and a low of Rs. 432.70 on 04th Dec’19. The 18-day Exponential Moving Average of the commodity is currently at Rs. 445.34. On the daily chart, the commodity has Relative Strength Index (14-day) value of 49.792.
One can buy above Rs. 448 for a target of Rs. 465 with the stop loss of Rs. 440.

COTTON MCX (JAN) contract was closed at Rs. 19430.00 on 26th Dec’19. The contract made its high of Rs. 19730.00 on 04th Nov’19 and a low of Rs. 18900.00 on 11th Nov’19. The 18-day Exponential Moving Average of the commodity is currently at Rs. 19347.14. On the daily chart, the commodity has Relative Strength Index (14-day) value of 57.193.
One can buy near Rs. 19320 for a target of Rs. 19760 with the stop loss of Rs 19100.
11
Ÿ MCX has launched a new series of indices under the name MCX India Commodity Indices, or MCX iCOMDEX.
Ÿ MCX has decided to introduce uniform delivery lots across all its metal and energy contracts. From January, new contracts in Zinc, aluminium and lead will only be in lot sizes of one tonne.
Ÿ NCDEX launched future contracts in Bajra - Feed Grade (Symbol: BAJRA) expiring in the months of January 2020,February 2020, March 2020 and April 2020 are available for trading w.e.f. December 20,2019.
Ÿ Indonesia launched biodiesel containing 30% palmbased fuel, the highest mandatory mix in the world, in a bid to slash its fuel import bill and boost domestic palm oil consumption.
Ÿ China, launched its first gold options contract on the Shanghai Futures Exchange on 20th December, 2019.
Ÿ China's Shanghai Futures Exchange would relax trading position limits on its product contracts from 2020 in order to encourage trading activity and increase market participation.
Ÿ Chile's state copper miner Codelco would cancel a contract awarded in November to a consortium led by Japanese firm Marubeni to construct a desalination plant to feed its northern mines.
Ÿ Commodities trader Mercuria Energy Group expects to open a new U.S. Gulf Coast crude oil storage facility in 2020 that could compete to become a trading hub for shale oil.
2019 is about to end and it seems that commodities are giving a very strong farewell with its sharp upside move in the last leg of year. CRB saw gradual upside from past four weeks. Downside in dollar index apart from some improvement in economic sentiments stimulated buying in commodities. The dollar hovered near a six-month high versus the Japanese yen while the Australian dollar climbed to its strongest since July on Friday, buoyed by easing Sino-U.S. trade tensions. Bullion counter enjoyed the rally. Gold and silver rose on apprehensions over the U.S.-China trade deal and Trump and his impeachment proceedings. Physical gold demand is still lagging gold investment demand. Gold has shown surprising strength in the final stretch of the year, returning to the $1,500 level even after the Federal Reserve's indication earlier this month to end rate cuts. In the energy counter, crude prices ignited and natural gas recovered from the weekly losses. Long build up in Natural gas ETF’s showing the shift in climate patterns points to chilly weather in January, potentially lifting demand for heating ahead. Oil prices reached three-month highs on Friday after record online shopping by U.S. consumers drove optimism for the world's biggest economy. A report by Mastercard showed that online holiday spending by U.S. consumers reached a new high. Oil prices have also been buoyed by hopes that the U.S.-China trade war will soon end. Nonetheless, the Brent price has increased by more than a quarter in 2019, while the WTI is up around 35%. Base metals yet to react on positive developments in trade deal and economic performances and most of them trade with mix sentiments.
In agri commodities, oil seeds and edible oil lead the complex and gave the best return among all. In BMD, palm oil crossed the mark of 3000 ringgit riding momentum from supply shortage worries as industry groups forecast a steeper-than-expected decline for December production. On MCX, it has seen 12 week nonstop terrific rally. Mustard prices were 3 years high and it is attributed to firm demand from oil millers amid shrinking arrivals in spot markets, along with lag in sowing progress. Soyabean also see good upside owing to domestic demand from livestock businesses amid tight supply from producing belts. The market participants are expecting soybean output to be 8-8.5 million tons, much lower than the official estimate of 13.5 million tons because untimely rain damaged the crop. In news, additional margin of 2% will be applicable on both long and short side in all the running contracts of Soy Bean expiring from January 2020 onwards and in contracts to be launched. It was a good week for spices in which we have seen marginal buying everywhere.


|
|
12

|

|
Multi Commodity Exchange of India (MCX) has launched a new series of indices under the name MCX India Commodity Indices, or MCX iCOMDEX. These indices are based on commodity futures contracts traded on MCX and conform to the SEBIprescribed guidelines for the design of commodity indices. Besides, MCX has ensured that the indices adhere to financial benchmarks set by the International Organization of Securities Commissions (IOSCO) in construction, administration and governance. The Index composition is rebalanced by MCX each year.
MCX iCOMDEX are excess return indices which consist of a composite index, sectoral indices and single commodity indices. A composite index (MCX iCOMDEX Composite Index, consisting of eleven liquid futures contracts across different segments traded on MCX), two sectoral indices (MCX iCOMDEXTM Bullion Index and MCX iCOMDEX Base Metals Index) and four single-commodity indices (MCX iCOMDEX Gold Index, MCX iCOMDEXTM Silver Index, MCX iCOMDEX Copper Index and MCX iCOMDEXCrude Oil Index) are being disseminated under the MCX iCOMDEX series of indices. The live index values are being disseminated on a continuous basis through various modes. These indices have a base value of 10,000 as on December 31, 2015 and the historical index values since then are available on the MCX website.
Eligible Index Constituents and Their 2020 Weights

The Eligibility Criteria for Composite Index, the individual index:
• The futures contracts should be on existence on MCX for at least previous twelve months.
• The futures contracts must have a traded history for at least 90% of the trading days during preceding twelve months.
• Average daily turnover of the futures contracts during the previous twelve months should be at least:
a) INR 75 Crore for agriculture commodities
b) INR 500 Crore for non-agriculture commodities
• Constituents having at least 80% combined weightages in the composite index shall meet this turnover criterion and no single constituent not meeting this criterion shall have a weightage of more than 15% in the Composite Index.
• Such a constituent shall have an average daily turnover of at least INR 75 Crore during previous twelve months.

13
|
| 23rd DEC | RBI purchased Rs. 10,000 crore G-secs, sells Rs. 6,825 crore securities via OMOs. |
| 23rd DEC | India’s foreign exchange reserves at record highs, upward trajectory continues. |
| 24th DEC | Trump says US and China to hold signing ceremony for phase-one trade deal. |
| 26th DEC | UK ‘always welcome back’ in EU, says European Commission VicePresident. |
| 26th DEC | RBI to conduct second round of OMO on Monday. |
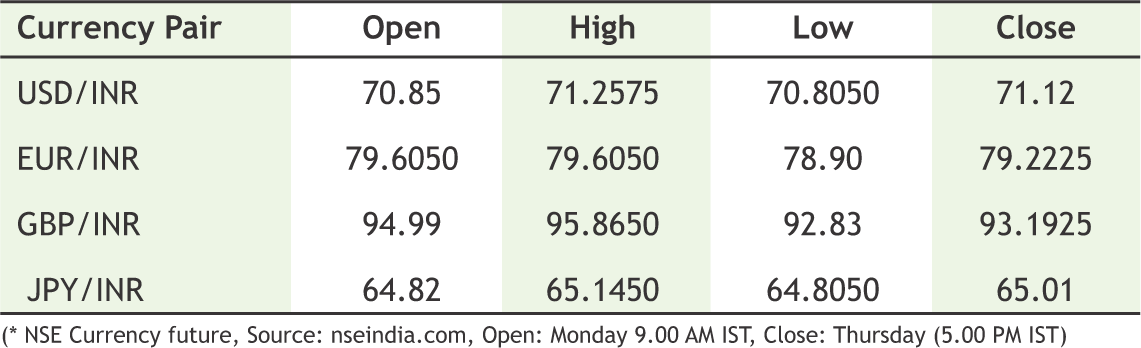
Indian Rupee continued the losing streak amid growing concern of expansion in fiscal deficit than what was earlier projected. There is expectation that the government may not be able to sell its stake in Bharat Petroleum Corp Ltd before the end of this financial year and that the Centre may miss its divestment target by a wide margin. The Union Budget for 2019-20 (Apr-Mar) pegged the divestment target at a record high of 1.05 trln rupees and so far the government has mopped up 173.64 bln rupees. Meanwhile, global risk-on sentiment has improved as several reports this week suggested an interim trade deal between Beijing and Washington was still on course to be signed in January. “The deal is done,” said Donald Trump on Christmas Eve. “It’s just being translated right now.” A day after the president’s remarks Geng Shuang, China’s foreign ministry spokesman, reportedly said the US and China were in touch about arranging the deal’s signing. Inevidently the last show in 2019 cornered in UK parliament as sterling's honeymoon didn't last long as Boris Johnson turned the Brexit drama into new uncertainty. Accordingly Boris Johnson secured a historic parliamentary victory that paves the way for Britain’s departure from the EU on January 31 after three years of bitter debate. Next week we will step into New Year, forex volumes likely to remain subdued in absence of major economic releases.
USDINR is likely to stay above 71 and move higher towards 71.60 in the next week.

|
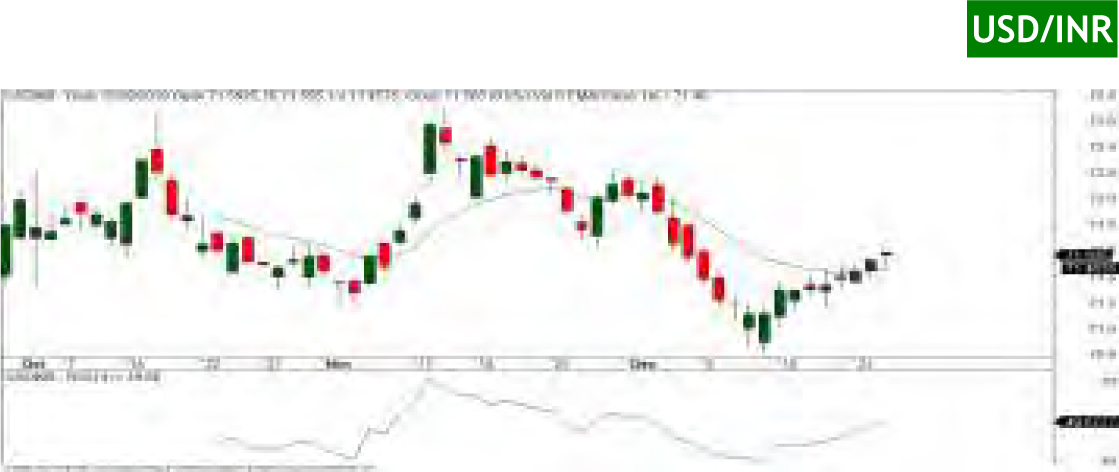
USD/INR (JAN) contract closed at 71.5650 on 26th Dec’19. The contract made its high of 71.5950 on 26th Dec’19 and a low of 71.3550 on 23rd Dec’19 (Weekly Basis). The 14-day Exponential Moving Average of the USD/INR is currently at 71.46.
On the daily chart, the USD/INR has Relative Strength Index (14-day) value of 49.87. One can buy at 71.45 for the target of 72.05 with the stop loss of 71.15.

EUR/INR (JAN) contract closed at 79.4725 on 26th Dec’19. The contract made its high of 79.49 on 26th Dec’19 and a low of 79.2725 on 24th Dec’19 (Weekly Basis). The 14-day Exponential Moving Average of the EUR/INR is currently at 79.49.
On the daily chart, EUR/INR has Relative Strength Index (14-day) value of 47.44. One can buy at 79.45 for a target of 80.05 with the stop loss of 79.15.
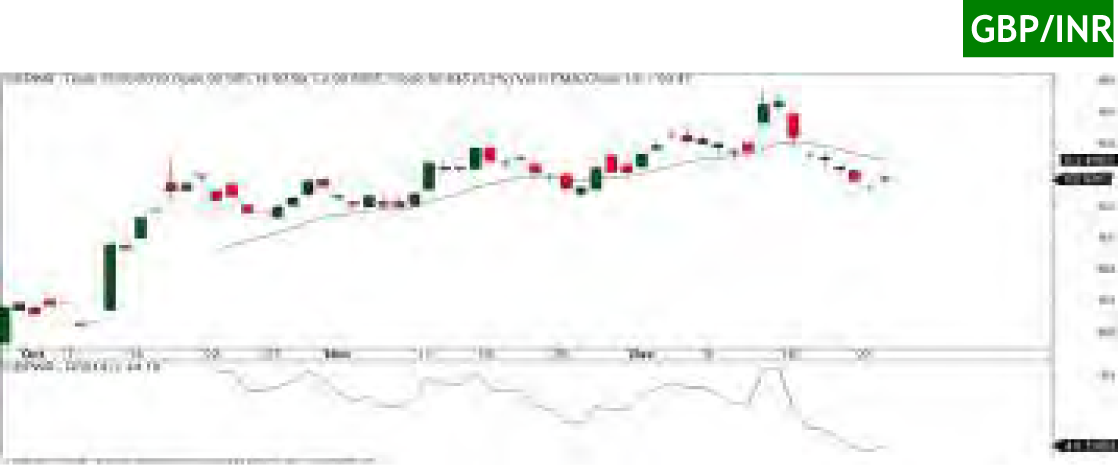
GBP/INR (JAN) contract closed at 92.8450 on 26th Dec’19. The contract made its high of 93.1950 on 23rd Dec’19 and a low of 92.4525 on 24th Dec’19 (Weekly Basis). The 14-day Exponential Moving Average of the GBP/INR is currently at 93.46.
On the daily chart, GBP/INR has Relative Strength Index (14-day) value of 44.19. One can buy above 93 for a target of 93.60 with the stop loss of 92.70.
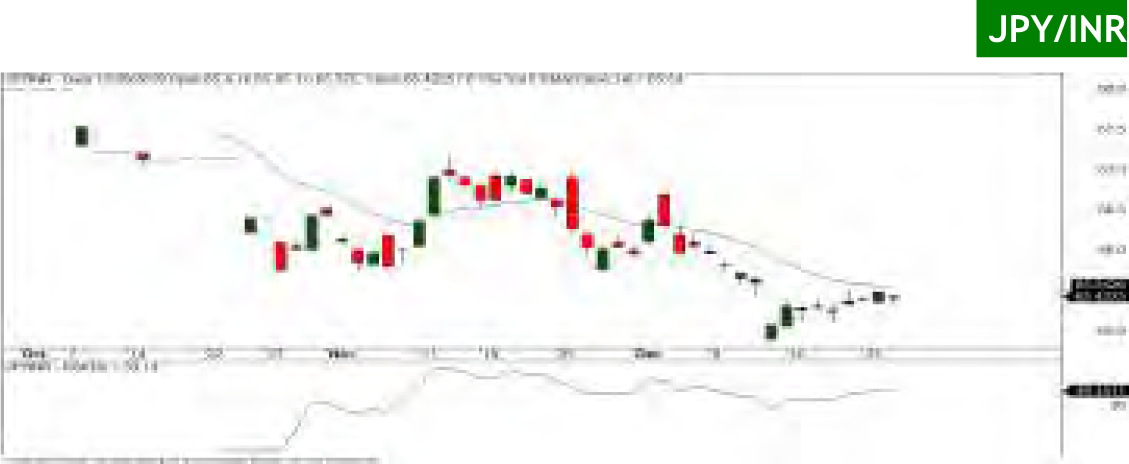
JPY/INR (JAN) contract closed at 65.4225 on 26th Dec’19. The contract made its high of 65.4950 on 24th Dec’19 and a low of 65.3250 on 26th Dec’19 (Weekly Basis). The 14-day Exponential Moving Average of the JPY/INR is currently at 65.54.
On the daily chart, JPY/INR has Relative Strength Index (14-day) value of 39.14. One can sell at 65.55 for a target of 64.95 with the stop loss of 65.85.
14
|
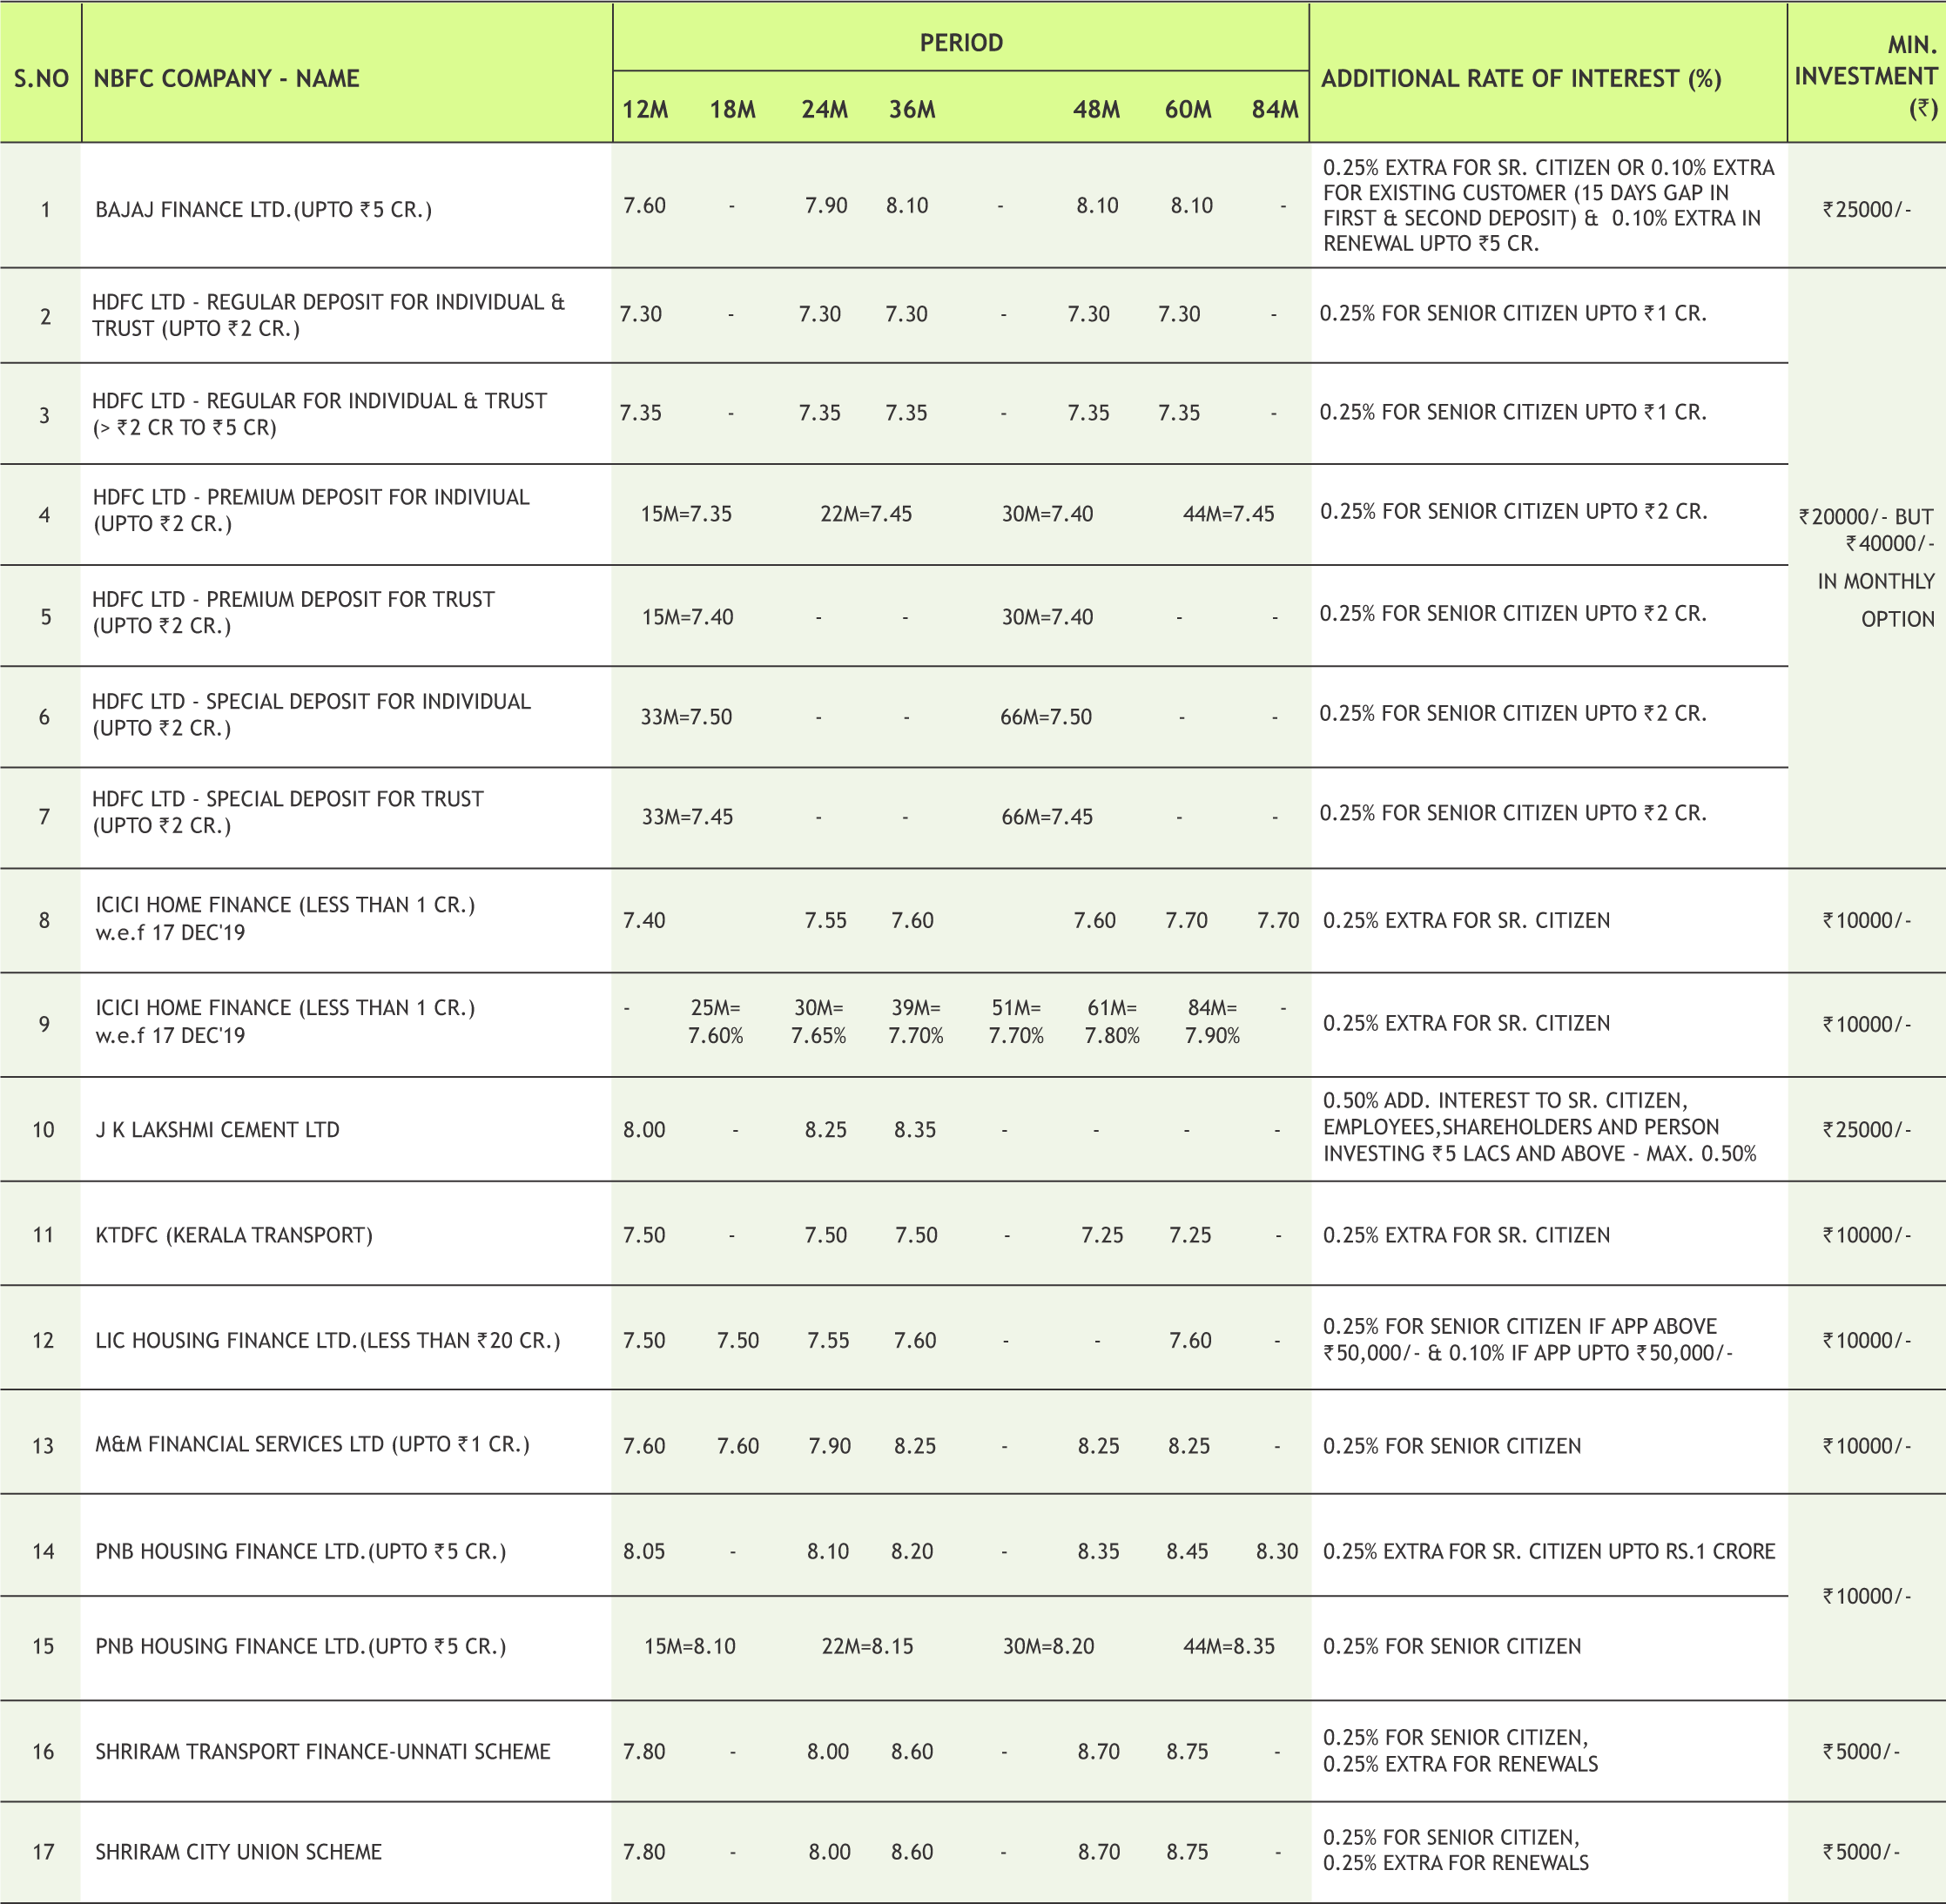
* Interest Rate may be revised by company from time to time. Please confirm Interest rates before submitting the application.
* For Application of Rs.50 Lac & above, Contact to Head Office.
* Email us at fd@smcindiaonline.com

16
|
|

|
|
|
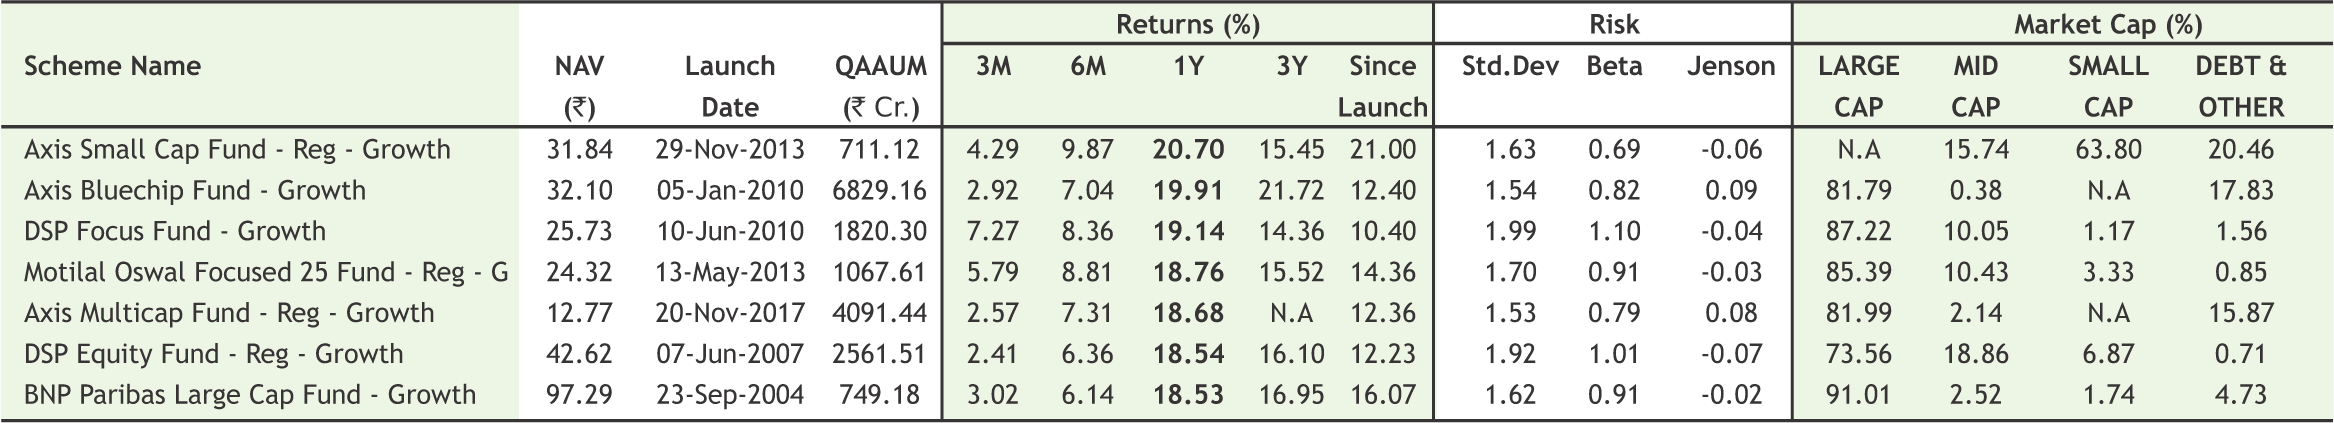
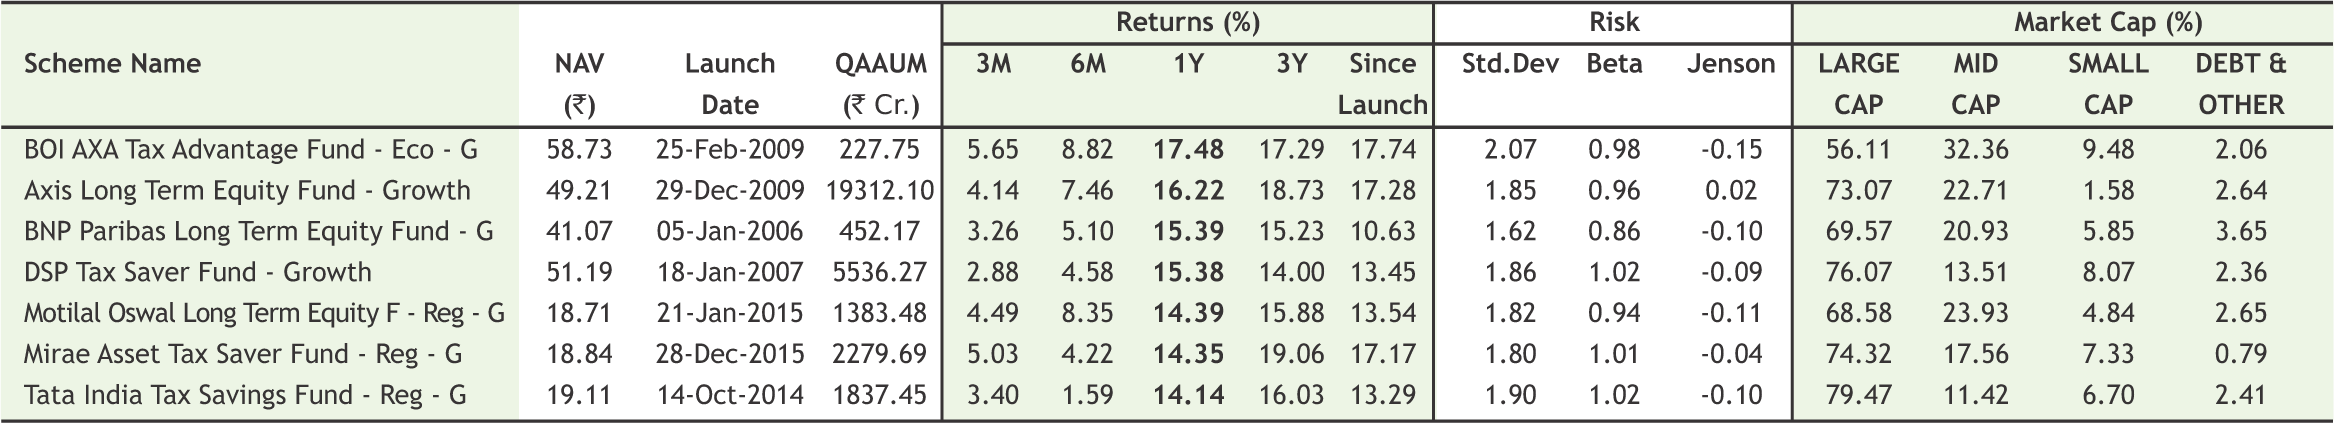
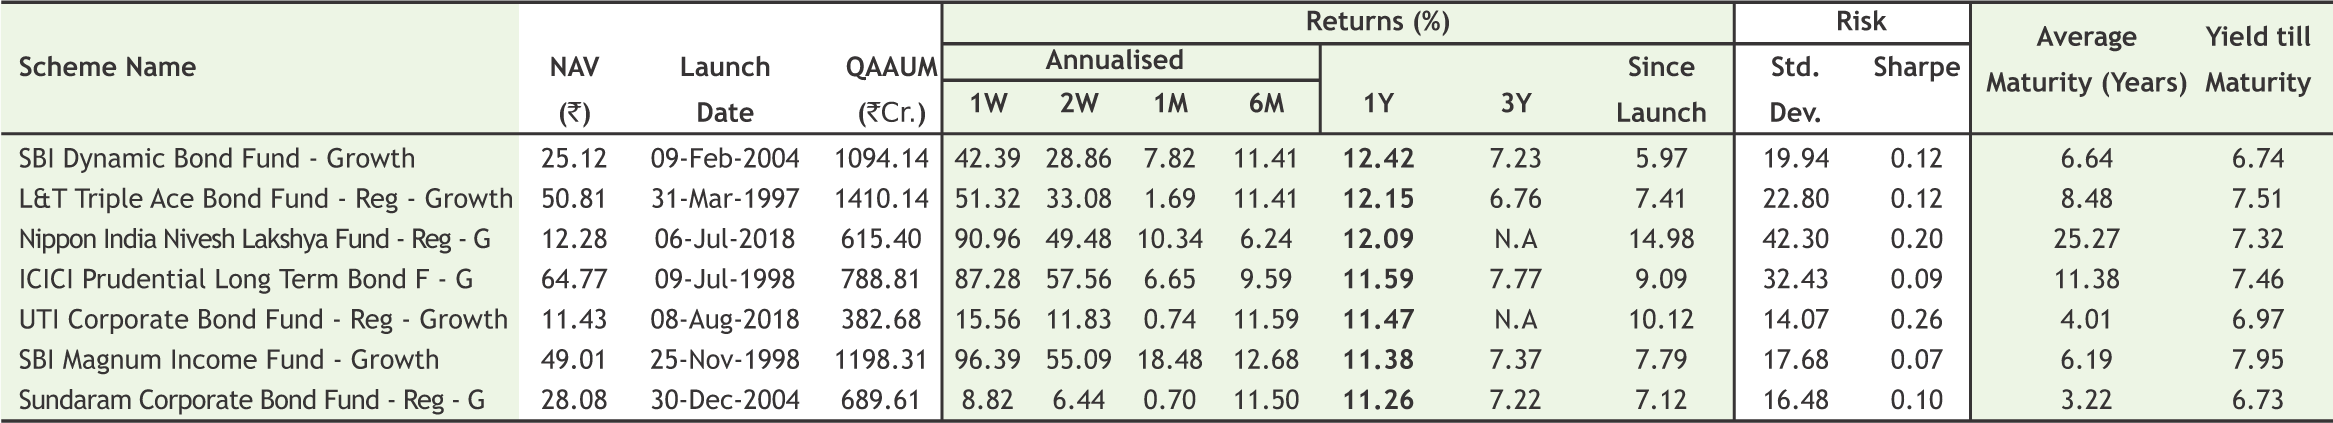
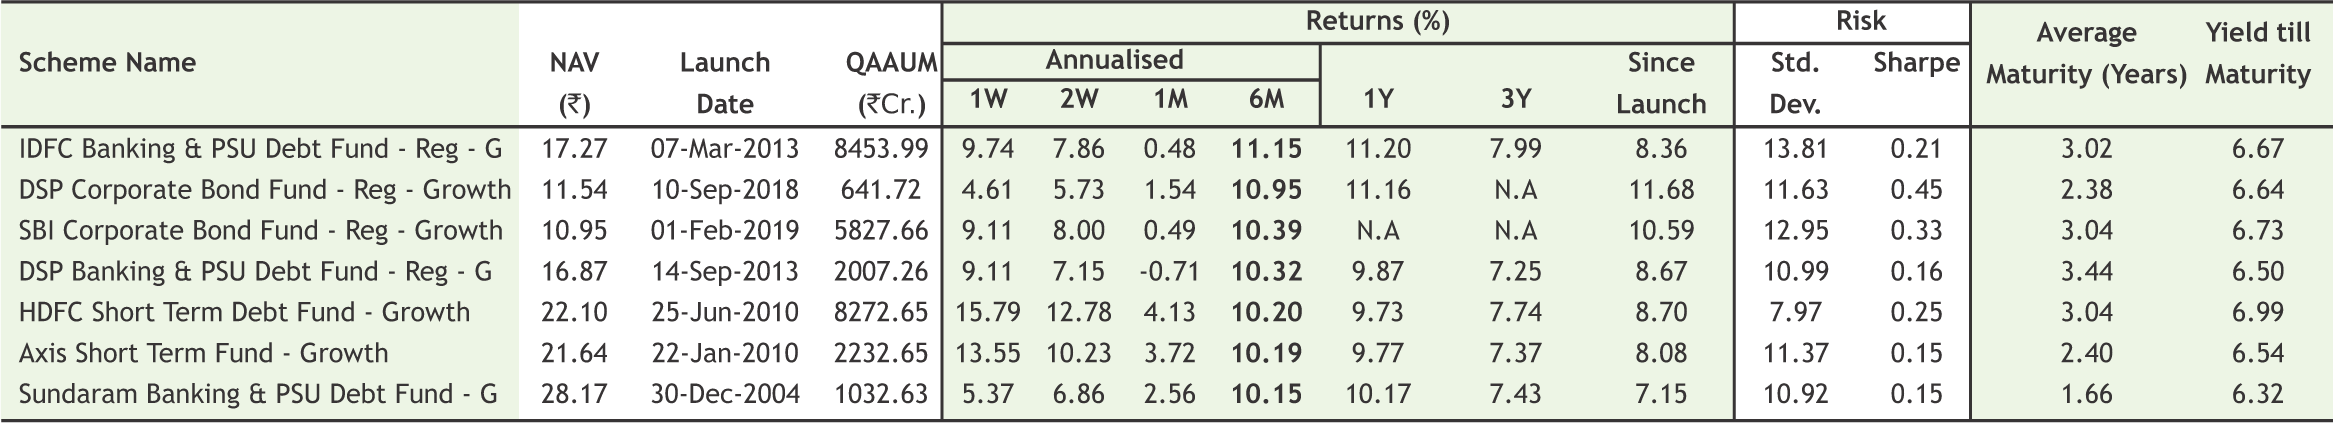
Note:Indicative corpus are including Growth & Dividend option . The above mentioned data is on the basis of 08/08/2019 Beta, Sharpe and Standard Deviation are calculated on the basis of period: 1 year, frequency: Weekly Friday, RF: 7%
*Mutual Fund investments are subject to market risks, read all scheme related documents carefully
18


REGISTERED OFFICES:
11 / 6B, Shanti Chamber, Pusa Road, New Delhi 110005. Tel: 91-11-30111000, Fax: 91-11-25754365
MUMBAI OFFICE:
Lotus Corporate Park, A Wing 401 / 402 , 4th Floor , Graham Firth Steel Compound, Off Western Express Highway, Jay Coach Signal, Goreagon (East) Mumbai - 400063
Tel: 91-22-67341600, Fax: 91-22-67341697
KOLKATA OFFICE:
18, Rabindra Sarani, Poddar Court, Gate No-4,5th Floor, Kolkata-700001 Tel.: 033 6612 7000/033 4058 7000, Fax: 033 6612 7004/033 4058 7004
AHMEDABAD OFFICE :
10/A, 4th Floor, Kalapurnam Building, Near Municipal Market, C G Road, Ahmedabad-380009, Gujarat
Tel : 91-79-26424801 - 05, 40049801 - 03
CHENNAI OFFICE:
Salzburg Square, Flat No.1, III rd Floor, Door No.107, Harrington Road, Chetpet, Chennai - 600031.
Tel: 044-39109100, Fax -044- 39109111
SECUNDERABAD OFFICE:
315, 4th Floor Above CMR Exclusive, BhuvanaTower, S D Road, Secunderabad, Telangana-500003
Tel : 040-30031007/8/9
DUBAI OFFICE:
2404, 1 Lake Plaza Tower, Cluster T, Jumeriah Lake Towers, PO Box 117210, Dubai, UAE
Tel: 97145139780 Fax : 97145139781
Email ID : pankaj@smccomex.com
smcdmcc@gmail.com
Printed and Published on behalf of
Mr. Saurabh Jain @ Publication Address
11/6B, Shanti Chamber, Pusa Road, New Delhi-110005
Website: www.smcindiaonline.com
Investor Grievance : igc@smcindiaonline.com
Printed at: S&S MARKETING
102, Mahavirji Complex LSC-3, Rishabh Vihar, New Delhi - 110092 (India) Ph.: +91-11- 43035012, 43035014, Email: ss@sandsmarketing.in