2020: Issue 725, Week: 2nd - 6th March
A Weekly Update from SMC (For private circulation only)
WISE M NEY
NEY

2020: Issue 725, Week: 2nd - 6th March
A Weekly Update from SMC (For private circulation only)
NEY


| Equity | 4-7 |
| Derivatives | 8-9 |
| Commodity | 10-13 |
| Currency | 14 |
| IPO | 15 |
| FD Monitor | 16 |
| Mutual Fund | 17-18 |
I
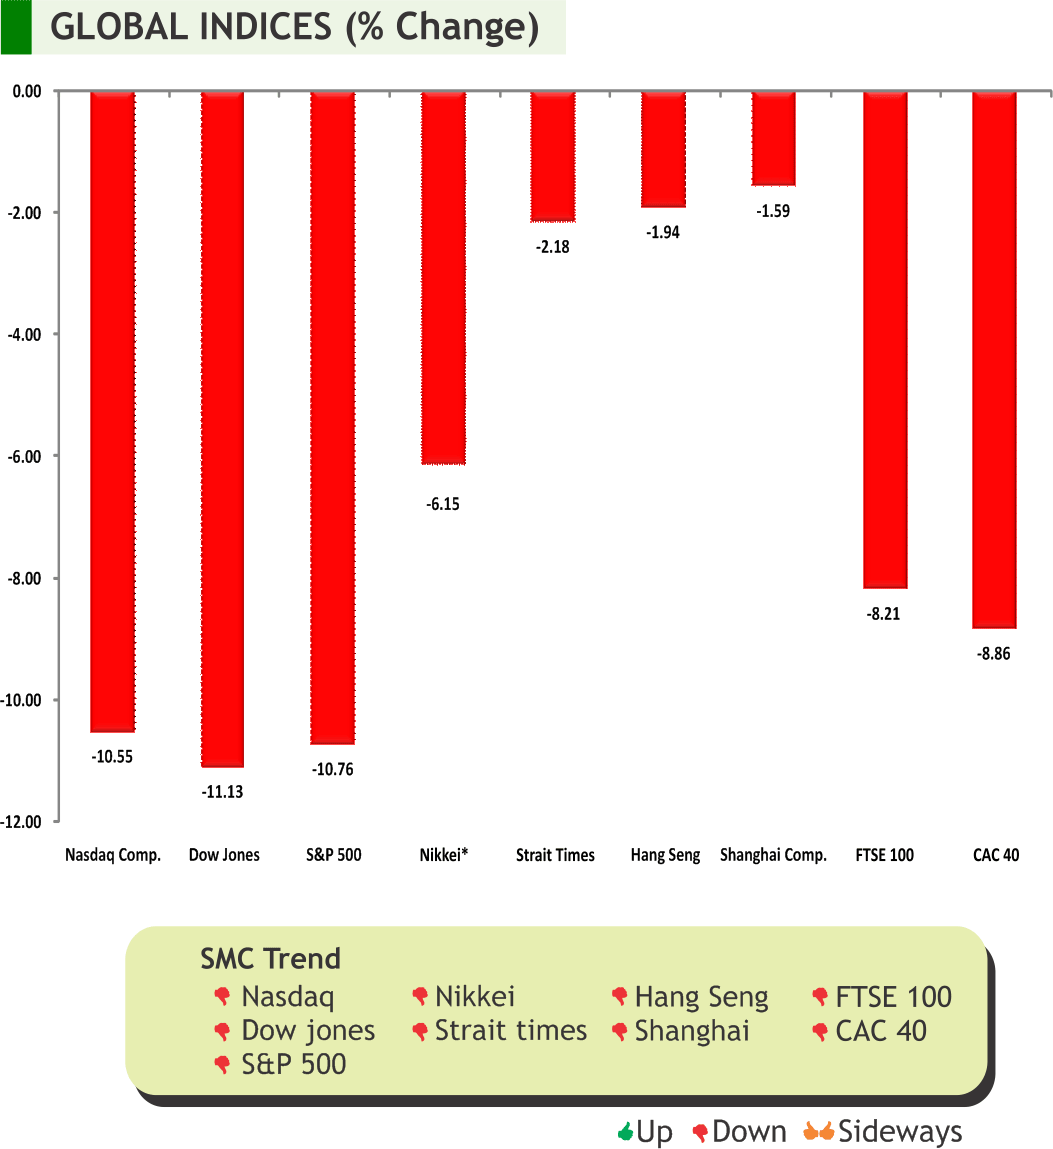
n the week gone by, markets across the globe fell like nine pins as most new virus cases are now being reported outside China - the origin of the outbreak - with South Korea, Italy, Japan, and Iran emerging as new epicentres heightening the fears of a pandemic. Though fresh cases of coronavirus have been declining in China, a spurt in cases in many countries outside China has pushed investors into safe haven assets like gold and US government bonds. The World Health Organization (WHO) called on countries to boost their readiness against coronavirus, saying the virus is "literally knocking at the door". Meanwhile, policymakers from Asia, Europe and the United States have begun to prepare for a potentially steep economic downturn than initially anticipated. Oil prices too fell as more coronavirus cases were reported in Asia, Europe and Middle East raising concerns over crude demand.
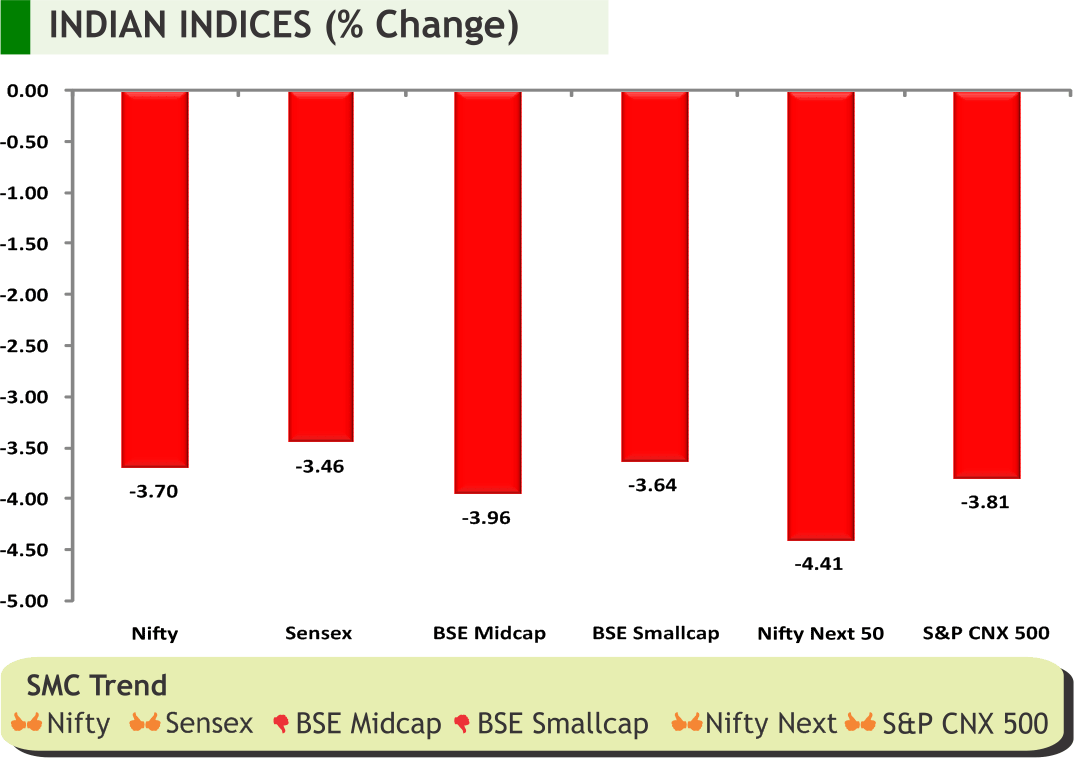
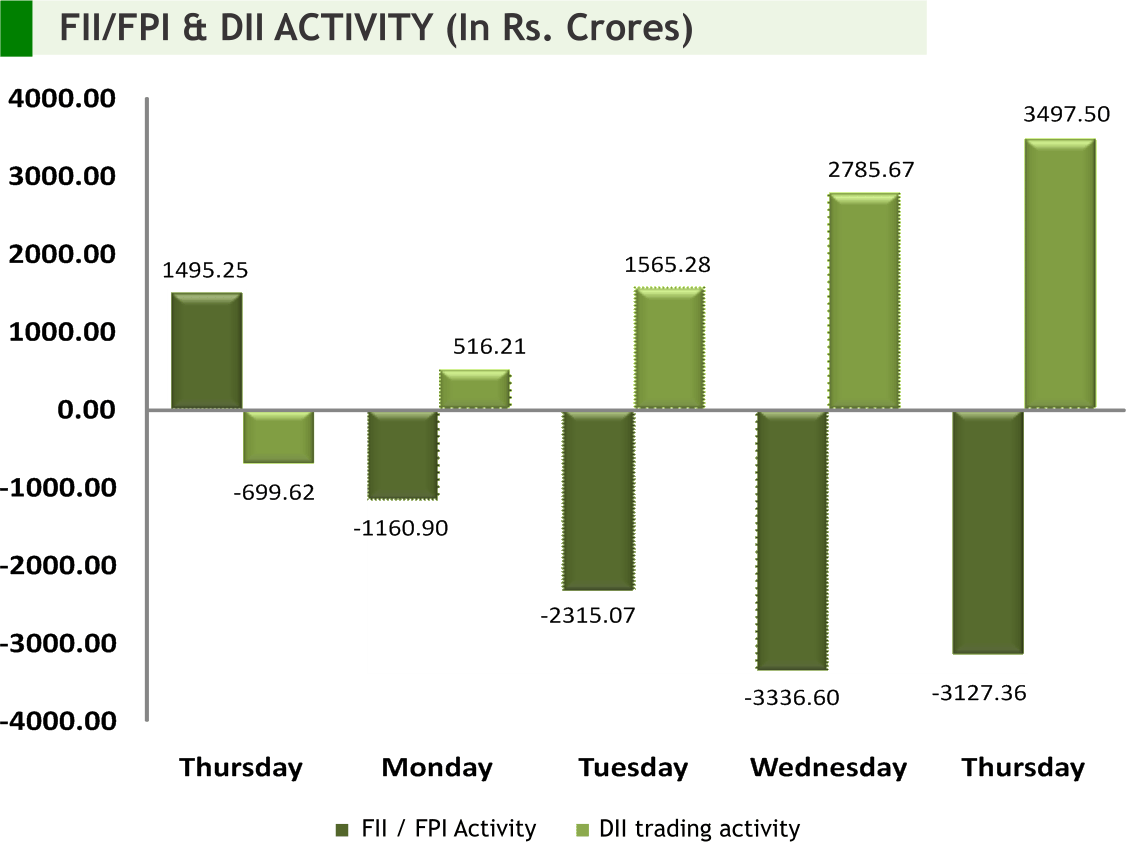
Back at home, Indian stock markets crashed on fears that a viral outbreak that began in China will weaken the world economy. Amid supply disruptions of everything from automobile components to pharmaceutical ingredients, the World Bank sees global economic growth in the first half of 2020 likely falling short of the 2.5% pace it forecast for the full year. According to economists, India imports more than one-fifth of its total non-oil, non-gold goods from China, and production halts there pose downside risk to domestic manufacturing. Indian economy expanded at a pace of 4.7 percent in the quarter ending December 2019. In another development, SEBI had reviewed the margin framework for cash and derivatives segments, in order to bring more efficiency in the risk management system. Going forward market will continue to exhibit tracking muted global cue as uncertainty regarding coronavirus will continue to impact the markets.
On the commodities front, Outbreak of Coronavirus outside China stimulated selling pressure in financial market and commodities were not in exception. Despite the pause, many expect the yellow metal to regain the steam. In Bullion counter yellow metal can continue its upside momentum on safe haven buying but silver to remain under pressure as it have dual properties of industrial metal and precious metals. Gold may move towards 43000 while taking support near 41800 and silver can test 44500 while taking resistance near 47000. Crude oil prices may continue to reel under selling pressure as oil prices witnessed more than 12% weekly fall, the biggest in more than four years. Crude oil may further dip towards 3000-3100 while taking resistance near 3450. Unemployment Claims Rate and CPI of Germany, GDP of Canada, Advance Goods Trade Balance and PCE Core of US etc are strong triggers for commodities market this week. Furthermore, the Oil producer group known as OPEC+, which is currently reducing output by roughly 1.2 million barrels per day to support prices, is due to meet in Vienna on March 5-6.

SMC Global Securities Ltd. (hereinafter referred to as “SMC”) is a registered Member of National Stock Exchange of India Limited, Bombay Stock Exchange Limited and its associate is member of MCX stock Exchange Limited. It is also registered as a Depository Participant with CDSL and NSDL. Its associates merchant banker and Portfolio Manager are registered with SEBI and NBFC registered with RBI. It also has registration with AMFI as a Mutual Fund Distributor.
SMC is a SEBI registered Research Analyst having registration number INH100001849. SMC or its associates has not been debarred/ suspended by SEBI or any other regulatory authority for accessing /dealing in securities market.
SMC or its associates including its relatives/analyst do not hold any financial interest/beneficial ownership of more than 1% in the company covered by Analyst. SMC or its associates and relatives does not have any material conflict of interest. SMC or its associates/analyst has not received any compensation from the company covered by Analyst during the past twelve months. The subject company has not been a client of SMC during the past twelve months. SMC or its associates has not received any compensation or other benefits from the company covered by analyst or third party in connection with the research report. The Analyst has not served as an officer, director or employee of company covered by Analyst and SMC has not been engaged in market making activity of the company covered by Analyst.
The views expressed are based solely on information available publicly available/internal data/ other reliable sources believed to be true.
SMC does not represent/ provide any warranty express or implied to the accuracy, contents or views expressed herein and investors are advised to independently evaluate the market conditions/risks involved before making any investment decision.
DOMESTIC NEWS
Automobile
• TVS Motor Company announced a partnership with Motomundo SA, one of the largest, respected business groups in Honduras. As a part of this association, Motomundo SA will facilitate the sales and service of TVS products across all Motomundo stores in the country in a phase-wise manner. Motomundo stores will start with an exclusive outlet for TVS Motor Company and will within a year will expand it to 3 stores in the country.
• Hero MotoCorp launched the iconic Super Splendor in its BS-VI version. The new Super Splendor BS-VI will be available at Hero MotoCorp showrooms across the country at the attractive prices of Rs. 67,300 (Self-Drum Alloy wheel) and Rs. 70,800 (Self-Disc Alloy wheel) exshowroom Delhi.
Realty/ Construction
• Godrej Properties has entered into an agreement to purchase land in the upcoming & fast developing micro-market of Chandivali, Mumbai. Spread across approximately 3 acres, this project will offer 41,800 square meters (0.45 million square feet) of saleable area comprising primarily of residential apartments of various configurations with a small amount of retail space.
• L&T Construction has secured orders for its water and effluent treatment and heavy civil business segments. These include - The Business has secured a Water Infrastructure order from a prestigious client in the United Arab Emirates to execute a Recycled Water Transmission Pipeline Project.
Pharmaceuticals
• Dr. Reddy's Laboratories announced the first-to- market launch of Naproxen and Esomeprazole Magnesium Delayed-Release Tablets, a therapeutic equivalent generic version of Vimovo® (Naproxen and Esomeprazole Magnesium) Delayed-Release Tablets approved by the U.S. Food and Drug Administration (USFDA).
• Aurobindo Pharma has received Establishment Inspection Report (EIR) with Voluntary Action Initiated (VAI) status from USFDA for its Unit VIII, API manufacturing facility at Gaddapotharam, Hyderabad.
• Cipla has received a warning letter from United States Food and Drug Administration (USFDA) for its Goa manufacturing facility. The USFDA inspected the facility from 16-27 September 2019. The company remains committed to maintain the highest standards of compliance and will work closely with the agency to comprehensively address all the observations.
Oil
• Hindustan Petroleum Corporation has set up its first electric vehicle charging facility in Gujarat. It will plan, develop and install EV charging facilities at suitable locations throughout the country
Capital Goods
• KEC International has acquired a transmission tower manufacturing facility with a capacity of 50,000 tons a year in Dubai for Rs 100 crore. With this acquisition, KEC International aims to scale up its tower manufacturing capacity and expand its presence in the Middle East and Africa.
INTERNATIONAL NEWS
• US real gross domestic product increased by 2.1 percent in the fourth quarter, unchanged from the estimate provided last month and in line with economist estimates.
• US pending home sales spiked by 5.2 percent to 108.8 in January after plunging by 4.3 percent to a revised 103.4 in December. Economists had expected pending home sales to surge up by 2.2 percent compared to the 4.9 percent nosedive originally reported for the previous month.
• US durable goods orders edged down by 0.2 percent in January after spiking by an upwardly revised 2.9 percent in December. Economists had expected durable goods orders to slump by 1.5 percent compared to the 2.4 percent jump that had been reported for the previous month.
• US initial jobless claims rose to 219,000, an increase of 8,000 from the previous week's revised level of 211,000. Economists had expected jobless claims to inch up to 212,000 from the 210,000 originally reported for the previous week.
• US existing home sales slumped by 1.3 percent to an annual rate of 5.46 million in January after surging up by 3.9 percent to a revised rate of 5.53 million in December. Economists had expected existing home sales to tumble by 1.8 percent.
• Industrial production in Japan climbed a seasonally adjusted 0.8 percent on month in January. That beat forecasts for an increase of 0.2 percent following the 1.2 percent gain in December.
|
|
4
5
NARAYANA HRUDAYALAYA LIMITED
CMP: 330.75
Target Price: 413
Upside: 21%
| Face Value (Rs.) | 10.00 |
| 52 Week High/Low | 389.00/181.35 |
| M.Cap (Rs. in Cr.) | 6759.23 |
| EPS (Rs.) | 7.05 |
| P/E Ratio (times) | 46.91 |
| P/B Ratio (times) | 6.09 |
| Dividend Yield (%) | 0.30 |
| Stock Exchange | BSE |

Investment Rationale
• Narayana Hrudayalaya Limited is one of the leading healthcare service providers in India, operating a chain of multispecialty, tertiary and primary healthcare facilities. The Company has a network of 21 hospitals and 6 heart centres across India and single hospital overseas at Cayman Islands with over 5,700 operational beds across all its centres and potential to reach a capacity of over 6,500 beds
• It has incurred around 100 Cr this fiscal year as CAPEX and plans to deploy 200 Cr over the next fiscal year as maintenance cost as well as new CAPEX.
• Also boosting the company’s performance was its asset-light model, which helped to save costs. The company partners owners of fixed assets, while Narayana Hrudayalaya provides the equipment and operates the hospital on a revenue-sharing basis. The company recently shut down a hospital in Bengaluru that was not scaling up, showing it is willing to get out of projects which are not working.
• According to the management, the company remains positive with an expectation to add at least 50 to 100 beds in the Eastern India operations in Howrah. It will be adding a new out-patient block in the Health City in Bangalore and extend number of beds in Ahmadabad. It shall be adding an oncology unit in Cayman Islands along with more beds in Raipur which is currently under construction.
• In line with sustaining the momentum generated over the last few quarters, the overseas operations at Cayman Islands posted YoY revenue growth of 5.5% in Q3 FY20 resulting into EBITDA margin of
24.3% helping the facility register a YoY EBITDA growth of 21.8%.
• At the operational front, the Average Revenue per Operational Bed (ARPOB) in India increased from 0.9 Cr in Q3FY2018 to 0.96 Cr in Q3FY2019.
Risk
• Increased regulatory activism
• Capital intensive nature of the sector limits expansion
Valuation
With its low-cost model and scale-up in new hospitals, it is well positioned to benefit from growing demand. The management of the company is committed to driving excellence across the clinical spectrum and continues to invest resources to reinforce its reputation to deliver quality affordable healthcare across all sections of society. Thus, it is expected that the stock will see a price target of Rs.413 in 8 to 10 months time frame on current P/BVx of 6.09x and FY21 EPS of Rs.67.84.
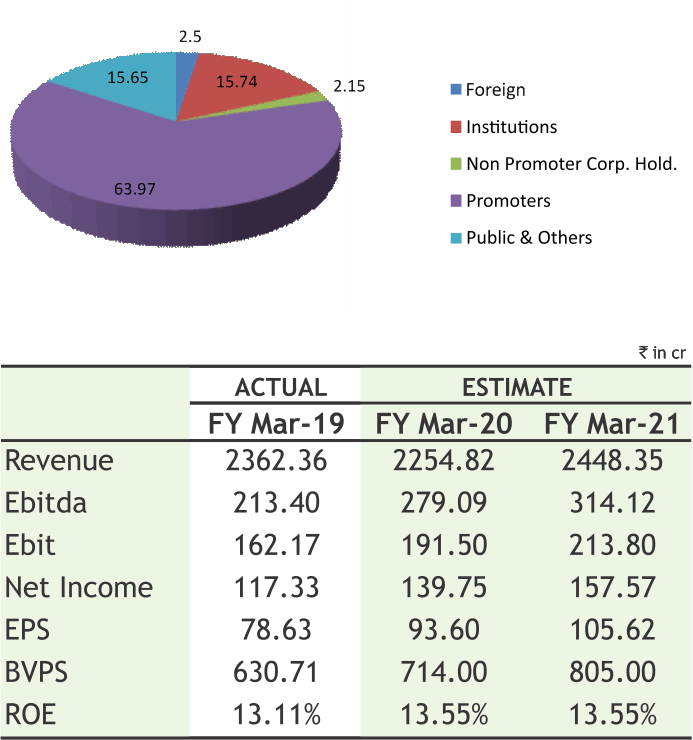
NILKAMAL LIMITED
CMP: 1400.00
Target Price: 1743
Upside:24%
| Face Value (Rs.) | 10.00 |
| 52 Week High/Low | 1544.15/890.45 |
| M.Cap (Rs. in Cr.) | 2089.15 |
| EPS (Rs.) | 94.24 |
| P/E Ratio (times) | 14.86 |
| P/B Ratio (times) | 2.09 |
| Dividend Yield (%) | 0.91 |
| Stock Exchange | BSE |
Investment Rationale
• Nilkamal Limited is an industry pioneer in the manufacturing business of moulded furniture and material handling products with diversified product profile across various segments along with a diversified customer base including household customers, industrial customers and retail buyers. It is also having its presence in the retail business of lifestyle furniture, furnishings and accessories under its brand '@home' & Nilkamal Mattresses.
• Recently, the Company has completed the acquisition of balance stake of 50% in Nilkamal Storage Systems Private Limited (NSSPL) (formerly known as Nilkamal Bito Storage Systems Private Limited (NBSSPL)), a company into metal racking business. The Company has undertaken an expansion of its racking business by putting up a manufacturing facility at its existing injection moulding plant at Sinnar. The approximate cost for setting up of the said manufacturing facility is Rs.20 Crores and it proposes to commence the production during the financial year 2020-2021.
• During Q3FY20, the Mattress business of the company has achieved sales of Rs.18.71 crores whereas the sales achieved during nine months is Rs.52 crores. In the mattress segment, it has been making a steady growth with a 30% CAGR over the last 3 years and emerged as national player in all the 3 segments i.e. coir, spring and foam. While the bubble guard business of the company achieved sales of Rs.3.66 crores during Q3FY20.
• The management of the company’s focuses mainly on store expansion by franchise route and in line with that during the quarter, two @home stores became operational under franchisee arrangement situated at Salem in the state of Tamil Nadu & Bangalore in the state of Karnataka totaling to 6 franchised stores till date. With this
the total stores in operation under the brand name @home stands at 24. Further three franchisee stores shall become operational during Q4FY20.
Risk
• Global Economic Volatility and Regulatory Risk
• Commodity fluctuation
Valuation
The Company is financially stable and has welldiversified business mix with strong brand presence. Under mattress business segment, the management of the company expects that it would be in a position to grow 2-3 times the industry growth rate, the focus being on improving its reach and penetration through its 1,000+ distributors spread across the country and developing differentiated products. Moreover, consolidation in B2B businesses after GST implementation combined with high growth of Ecommerce has resulted in increase in demand for larger warehouses. Thus, it is expected that the stock will see a price target of Rs.1743 in 8 to 10 months time frame on an expected P/Ex of 16.50x and FY21 earnings of Rs.105.62.

Source: Company Website Reuters Capitaline
Above calls are recommended with a time horizon of 8 to 10 months.
6
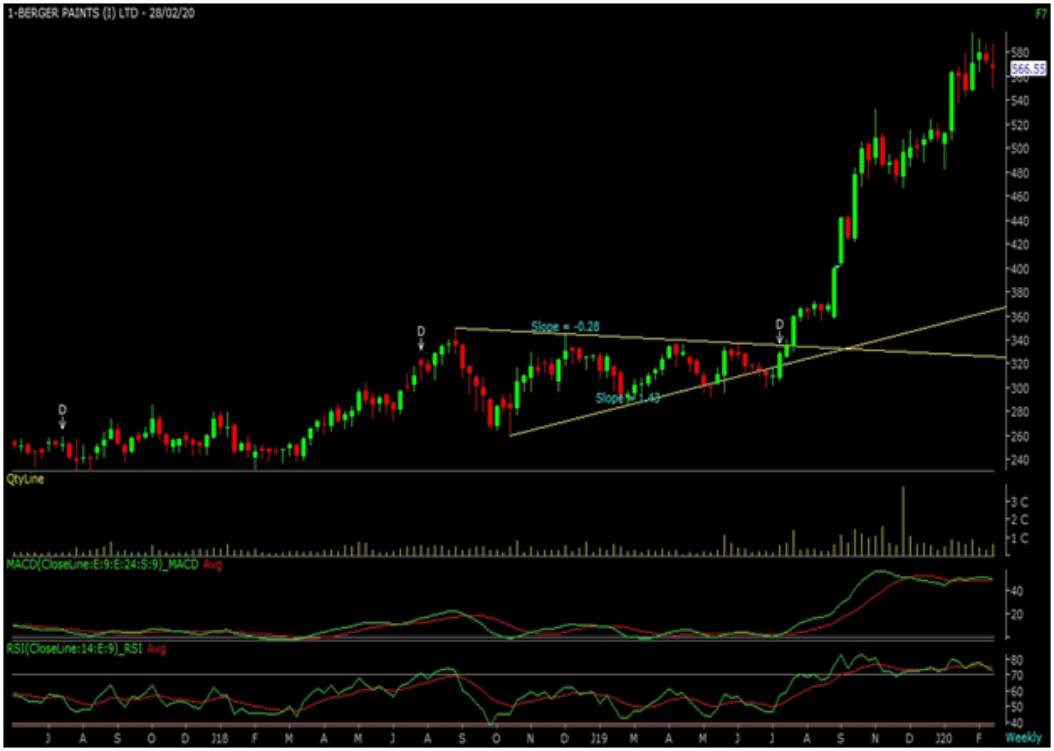
The stock closed at Rs 566.55 on 28th February 2020. It made a 52-week low of Rs 292.05 on 16th May 2019 and a 52-week high of Rs. 597 on 05th February, 2020. The 200 days Exponential Moving Average (DEMA) of the stock on the daily chart is currently at Rs 458.28
After registering all time high of 597, stock was consolidating in narrow range and formed a “Bullish Pennant” pattern on weekly charts, which is considered to be bullish. Apart from this, it is continuously trading in higher highs and higher lows sort of “Rising Wedge” on daily charts which is also bullish in nature, so buying momentum may continue for coming days. Therefore, one can buy in the range of 550-555 levels for the upside target of 600-610 levels with SL below 520.
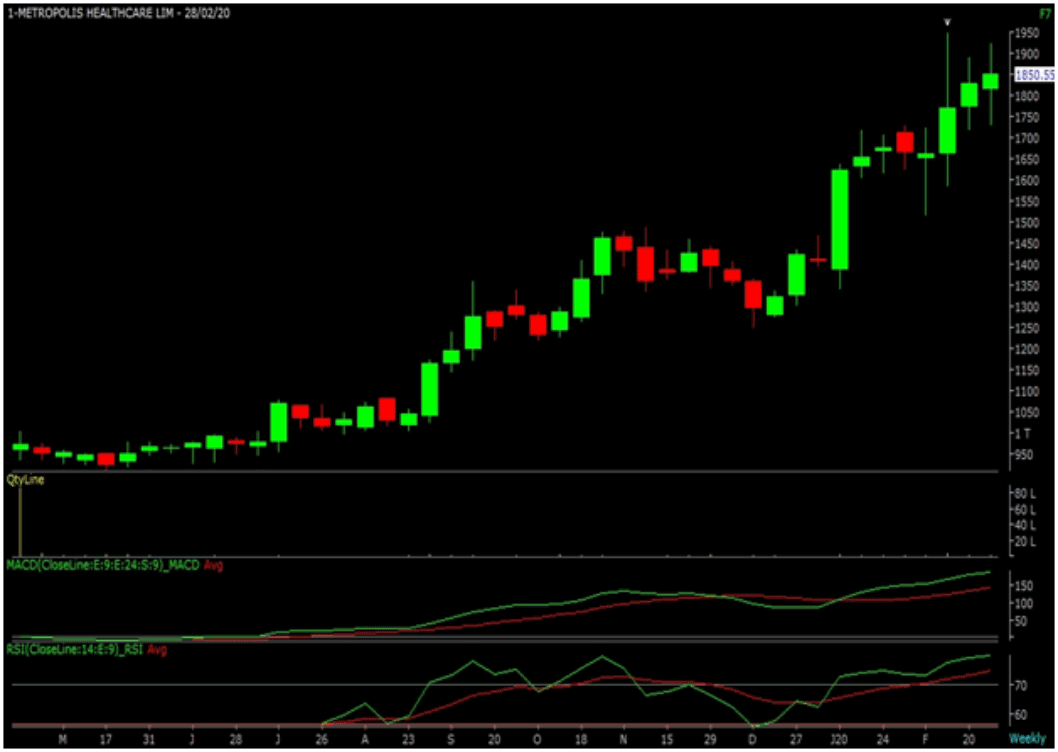
The stock closed at Rs 1850.55 on 28th February, 2020. It made a 52-week low at Rs 907 on 14th May 2019 and a 52-week high of Rs. 1950 on 13th February, 2020. The 200 days Exponential Moving Average (DEMA) of the stock on the daily chart is currently at Rs 1356.34
As we can see on chart that stock is trading in higher highs and higher lows on charts, which is bullish in nature. Despite the fall in the broader indices, stock maintained its positive momentum and ended with marginal gains in last traded week, which show buying is aggressive for the stock. Therefore, one can initiate long in range of 1840-1850 levels for the upside target of 2040-2080 levels with SL below 1700.
Disclaimer : The analyst and its affiliates companies make no representation or warranty in relation to the accuracy, completeness or reliability of the information contained in its research. The analysis contained in the analyst research is based on numerous assumptions. Different assumptions could result in materially different results.
The analyst not any of its affiliated companies not any of their, members, directors, employees or agents accepts any liability for any loss or damage arising out of the use of all or any part of the analysis research.
SOURCE: CAPITAL LINE
Charts by Spider Software India Ltd
Above calls are recommended with a time horizon of 1-2 months
7
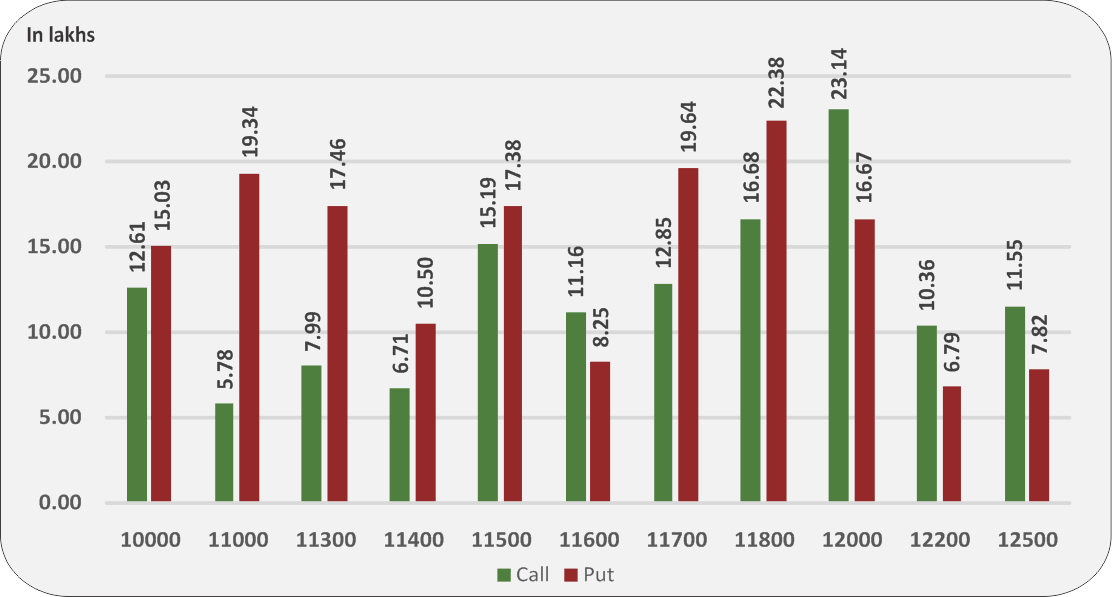
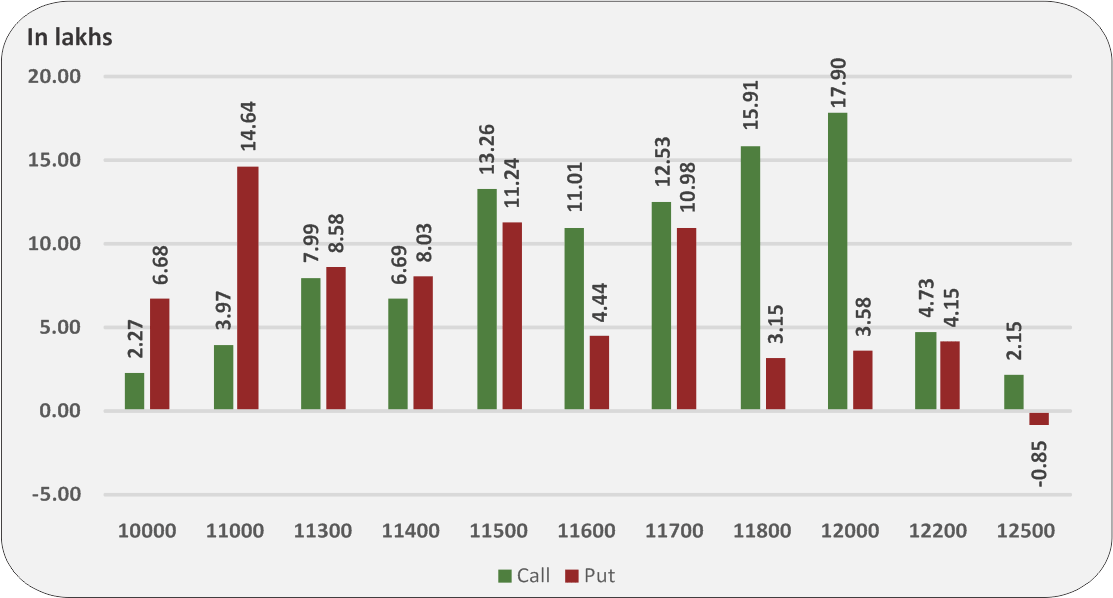
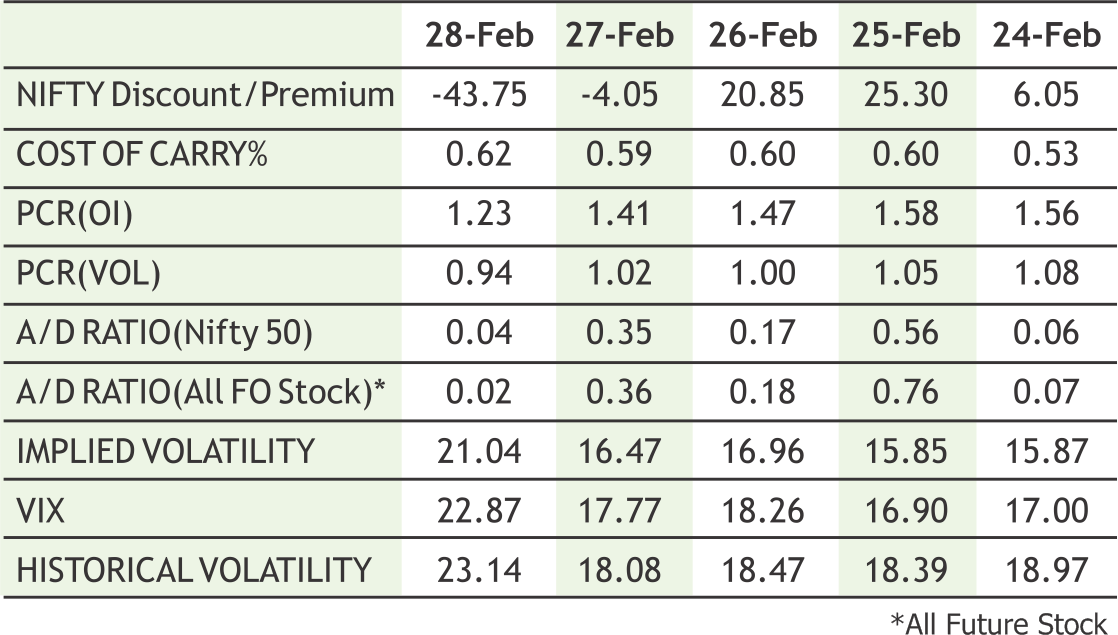
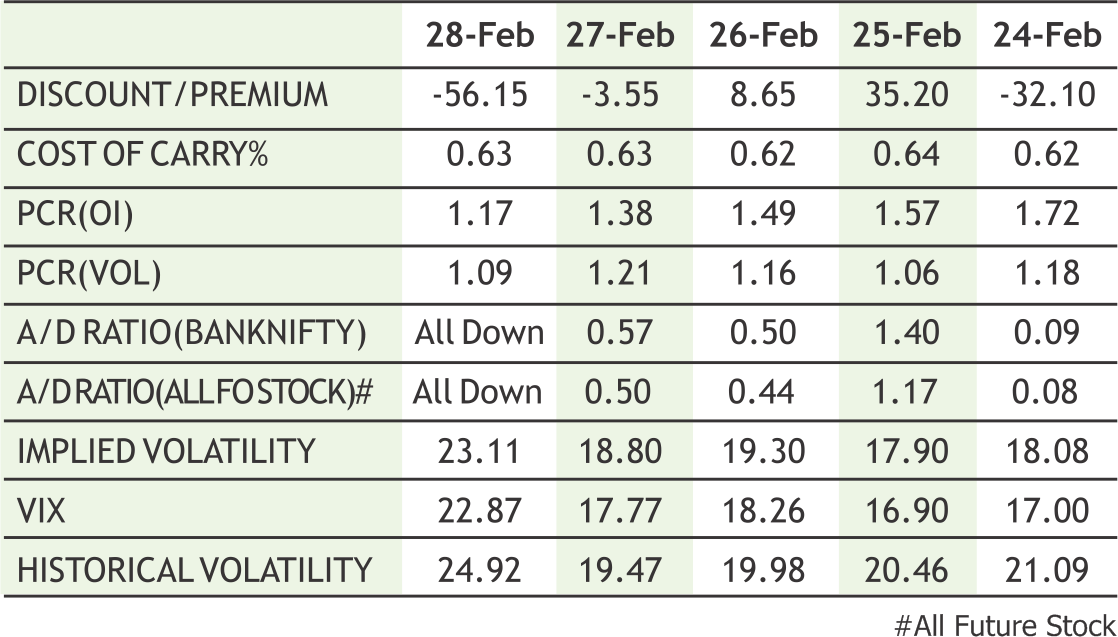
Indian markets hammered down badly in the week gone by with Nifty losing more than 7% while Bank nifty ended the week with nearly 6% of loss as global markets fell amid rising concern over the outbreak of Corona virus that could turn into a pandemic and derail growth. Nifty also witnessed the worst weekly fall since 2009 on back of long liquidation and heavy short build up. From derivative front as well bears took full charge over the street as major call writing was observed at 11400 & 11500 strikes. From technical front both the indices slipped well below their 200 days exponential moving average on daily interval which added further sell off into the markets. For coming week we expect markets to remain under pressure once again as heavy short build up was observed last week which could keep any upside under cap. The Implied Volatility (IV) of calls closed at 20.01% while that for put options closed at 21.04%. The Nifty VIX for the week closed at 22.87% and is expected to remain volatile. PCR OI for the week closed at 1.23. We advice traders to remain on cautious note while creating any long positions as both technical and derivative indicators suggest for further downside into the prices with huge volatility on the cards.
8
|
|


|
|
**The highest call open interest acts as resistance and highest put open interest acts as support.
# Price rise with rise in open interest suggests long buildup | Price fall with rise in open interest suggests short buildup
# Price fall with fall in open interest suggests long unwinding | Price rise with fall in open interest suggests short covering
9
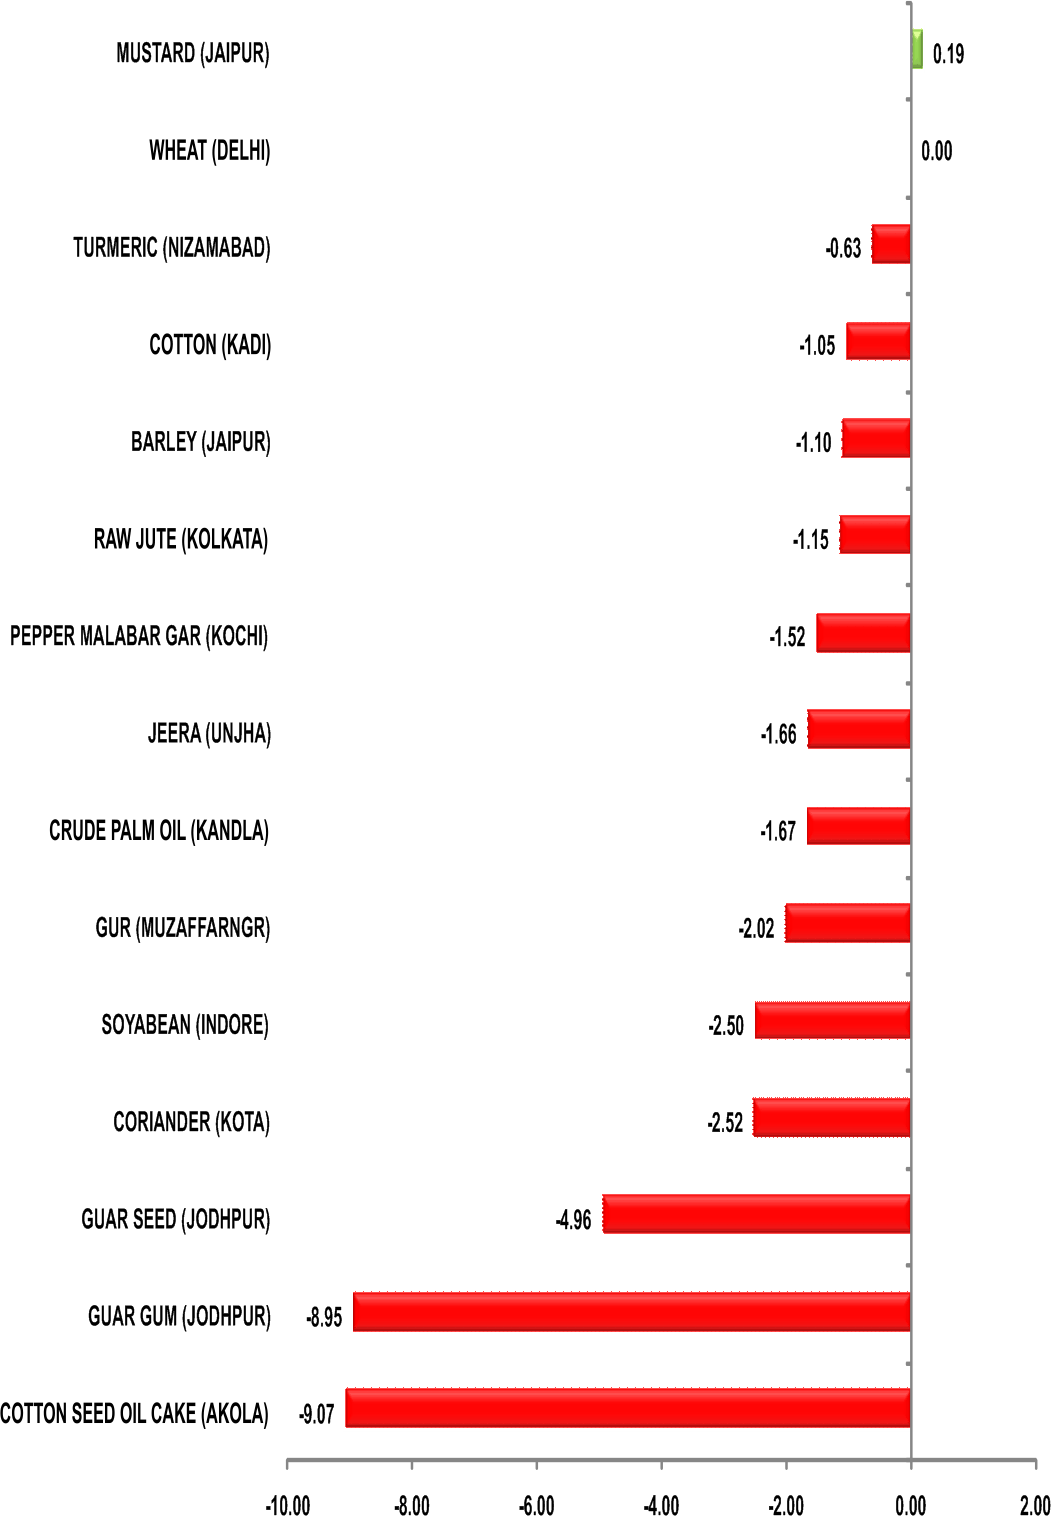
Turmeric futures (March) is expected to trade with a downside bias, may even break 5800 & witness 5700-5600 levels. According to traders, the arrival of new crops is increasing day by day, while the demand from bulk buyers and stockists is sluggish for the new crop. The moisture content of 20-30% is on the higher side in the new turmeric while the quality of the old is weak, because of this wholesale deals are not happening in the market.Jeera futures(March) will possibly go down further towards 13300-13100 levels, if breaks the previous low of 13450. The sentiments are bearish on the back of a bigger crop due to a sharp rise in acreage in Gujarat and Rajasthan and favourable weather conditions across growing regions. The market participants are in view that this season the output is expected to increase by about 25%. The selling pressure is likely to increase over the counter as the arrival of new crops in the mandis is increasing rapidly. In days to come, the selling may intensify in coriander futures amid new crop arrivals and on expectations of higher production this year. This phenomenon can drag down the April contract to 5600-5500 levels.In the ongoing season, output of the spice is seen at 340,000-360,000 tn, against 300,000 tn produced in 2018-19. The new crop of coriander has started arriving at the benchmark market of Ramganj in Rajasthan since last week. The quality of the new crop is inferior &high moisture level is prevailing at 15-20 percent, against the normal of 5-8 percent. On the spot, the new crop is being sold at Rs 5,000-6,000 per 100 kg, and the old crop is available at Rs 6,000-6,500.
In Bullion counter yellow metal can continue its upside momentum on safe haven buying but silver to remain under pressure as it have dual properties of industrial metal and precious metals. Growing fear of coronavirus spreading in other parts of the globe apart from China is taking toll on the global financial markets as US stock markets plunged more than 12% and witnessed worst week since world financial crisis in 2008. Investors braced for the virus to become a pandemic and rapidly spread around the world. Moody's Analytics stated that a pandemic would result in global and U.S. recessions during the first half of this year, while rate cuts by the Federal Reserve might fall short of stabilizing markets. The Fed may need to move aggressively to cut borrowing costs to cushion the economy from the effects of the virus, CME Group's Fed Watch indicated. Gold may move towards 43000 while taking support near 41800 and silver can test 44500 while taking resistance near 47000. China's National Health Commission reported 2,788 the number of fatalities nationwide while raising the total number of infections to 78,824. Meanwhile, South Korea reported total number of infected in the country to 2,022. Hopes that the virus would be contained to China vanished, with countries beginning to stockpile medical equipment and investors taking flight in expectation of a global recession. According to the head of the World Health Organization it would be a "fatal mistake" for any country to assume it will not be hit by the new coronavirus, and rich countries that might have thought they were safer should expect surprises.
Soybean futures (March) by descending more than 11% this month, has made a new contract low at 3732. This only reason which is being attributed to this downtrend is the outbreak & widely spread of coronavirus to every continent including Middle East &South Korea. These countries imports huge quantity of soymeal & looking at the virus inching closer toward meeting the definition of a global pandemic, the demand is likely to take a hit. More fears are growing as this illness has been reported in U.S. Last week, the Centers for Disease Control and Prevention had warned Americans that health experts foresee the novel coronavirus that has killed thousands spreading in the United States. The investors are growing concerned about the economic impact of the virus. Analyzing the growing numbers of infected patients, selling may emerge in this counter which may drag the prices to 3700-3600 levels. Mustard futures (April) is seen taking support near 3980 since past three weeks. But going ahead, the various factors such as weakness in oilseeds complex in the global as well as domestic market demand and increase in supply of the fresh crop, might push this counter down below the support level towards 3830. Arrivals of mustard in major spot markets across the country has risen to the tune of 160,000 bags (1 bag = 85 kg) including new & old crop. The downtrend of CPO futures (Mar) is likely to get extended to 660-650 levels; while soy oil futures (March) may go down further to test 760 levels. The permission for hefty imports of refined palm oil is weighing on prices domestic markets.
Crude oil prices may continue to reel under selling pressure as oil prices witnessed more than 12% weekly fall, the biggest in more than four years, as the spread of the coronavirus outside China raised fears of slowing global demand. The effects of the outbreak are likely to reverberate beyond China as most major economies in the region are expected to either slow down significantly, halt or shrink outright in the current quarter. Crude oil may further dip towards 3000-3100 while taking resistance near 3450. The oil market is hoping for steeper supply cuts by the Organization of the Petroleum Exporting Countries (OPEC) and its allies including Russia, who have stated that they will take a responsible approach in the wake of the virus outbreak. The producer group known as OPEC+, which is currently reducing output by roughly 1.2 million barrels per day to support prices, is set to meet in Vienna on March 5-6. Saudi Arabia, the world’s top oil exporter, is reducing crude supplies to China in March by at least 500,000 barrels per day (bpd) due to slower refinery demand following the coronavirus outbreak. Natural gas can extend its slump as it can test 115-110 while taking resistance near 130 as U.S. natural gas futures plunged to a near four-year low on a smaller-than-expected weekly storage draw, forecasts for milder weather over the next two weeks. Since hitting an eight-month high of $2.905 per mmBtu in early November last year, gas futures have collapsed more than 36% as record production and mild winter weather enabled utilities to leave more gas in storage.
In days to come, more weakness can be seen in cotton futures taking negative cues from the international market owing to outbreak of coronavirus & spreading to various countries. It is reported that shipments of Indian cotton to China have been delayed by factory closures. Coronavirus has brought down the yarn exports from Indian to China to almost nil. The country, which imports over a quarter (27%) of India’s cotton yarn appears shut for yarn business. According to traders, stockists have increased selling in the market as there is a possibility of further pressure on prices due to the fall in the global market. On the international market, the downtrend in ICE cotton futures (Mar) may get extended towards 63-62 cents per pound. Economic activity in China, epicenter of the outbreak, has widely been disrupted, fading expectations for increased Chinese imports of U.S. agricultural goods - as called for under a Phase 1 trade agreement between Washington and Beijing.Chana futures (March) may witness an extended fall & test 3845-3800 levels. In the present scenario, higher output estimates and cautious buying by millers is weighing upon the prices. NAFED is selling its old stock, in selected states, whilst availability of new domestic Chana is pressurizing buyer sentiments. The one sided correction in guar seed (March) is likely to prevail till 3500-3400 levels; while the bearishness of guar gum (March) is expected to get extended towards 5700-5600 levels. This is because of lower crude oil prices which have fallen to their lowest since January 2019. Weaker oil prices dampen the exports of guar gum as rig counts continue to decrease.
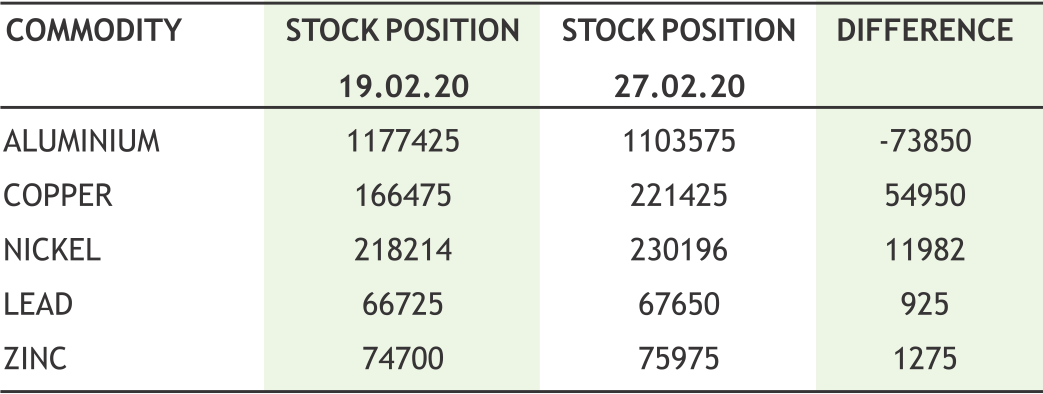
Base metal counter may remain on weaker path due to the fear of global economic slowdown will effect demand of base metals. Meanwhile China Nonferrous Metals Industry Association (CNIA) stated that “China should stockpile some non-ferrous metals to take the pressure off producers whose sales have been drying up because of the country's coronavirus outbreak”. Copper may test 410 levels while facing resistance near 427. Copper stocks in warehouses approved by the London Metal Exchange (LME) rose to a threemonth high at 221,425 tonnes. In China, inventories in warehouses tracked by the Shanghai Futures Exchange (ShFE) have surged 120% in five weeks to a near two-year high at 298,619 tonnes by the end of last week. Meanwhile, lead may remain in red as it can test 136 while taking resistance near 147 levels. The London lead market is experiencing its most severe and prolonged period of tightness in almost a decade. Stocks of lead registered with the London Metal Exchange (LME) are flat-lining near historic lows and nearby spreads are both volatile and elevated. Zinc may remain on weak bias as it can test 142 levels while facing resistance near 158. Nickel prices can tumble lower towards 875 while taking resistance near 925. The coronavirus outbreak will likely delay development of nickel projects in Indonesia worth about $11 billion, its coordinating minister overseeing maritime resources and investment affairs stated. Aluminium prices can dip towards 130 while taking resistance near 140. Russian aluminium group United Company Rusal stated the virus would hit the Chinese market in the first half of this year with weak demand and a bigger supply surplus.
10
|
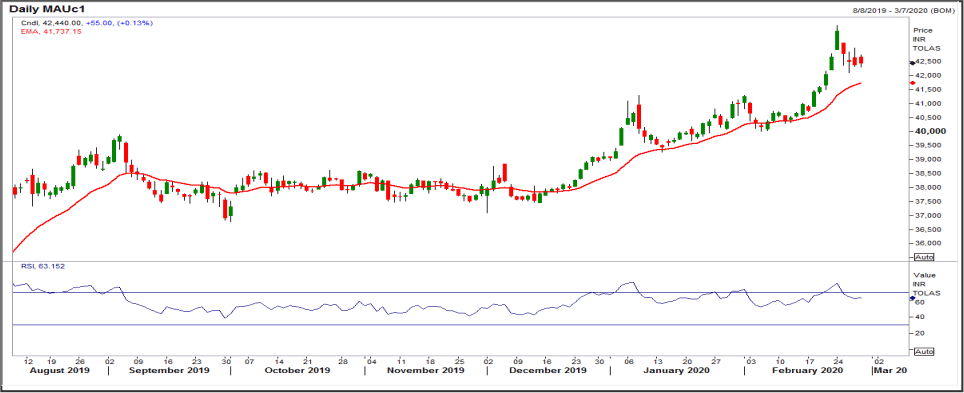
GOLD MCX (APR) contract closed at Rs. 42322.00 on 27th Feb’2020. The contract made its high of Rs. 43788.00 on 24th Feb’2020 and a low of Rs. 37530.00 on 13th Dec’19. The 18-day Exponential Moving Average of the commodity is currently at Rs. 41748.59. On the daily chart, the commodity has Relative Strength Index (14-day) value of 62.927.
One can sell below Rs. 42100 for a target of Rs. 41600 with the stop loss of Rs. 42350.
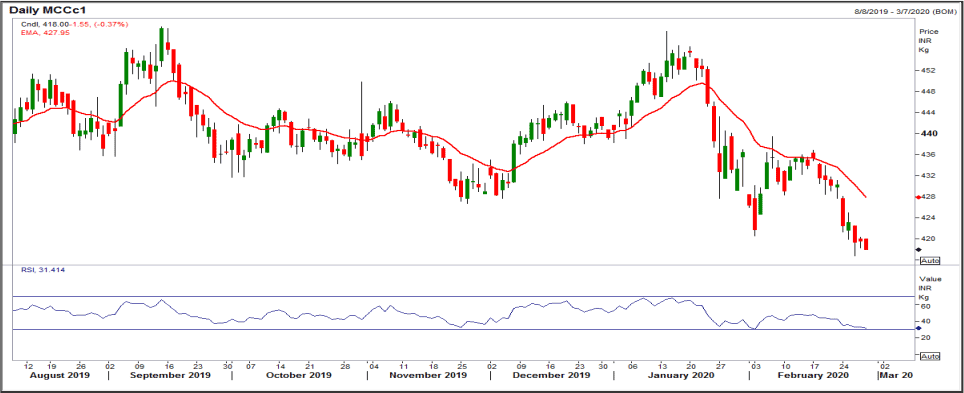
COPPER MCX (MAR) contract closed at Rs. 422.45 on 27th Feb’2020. The contract made its high of Rs. 450.00 on 31st Dec’19 and a low of Rs. 415.30.00 on 28th Feb’2020. The 18- day Exponential Moving Average of the commodity is currently at Rs. 430.83. On the daily chart, the commodity has Relative Strength Index (14-day) value of 26.241.
One can sell near Rs. 425 for a target of Rs. 410 with the stop loss of Rs. 432.
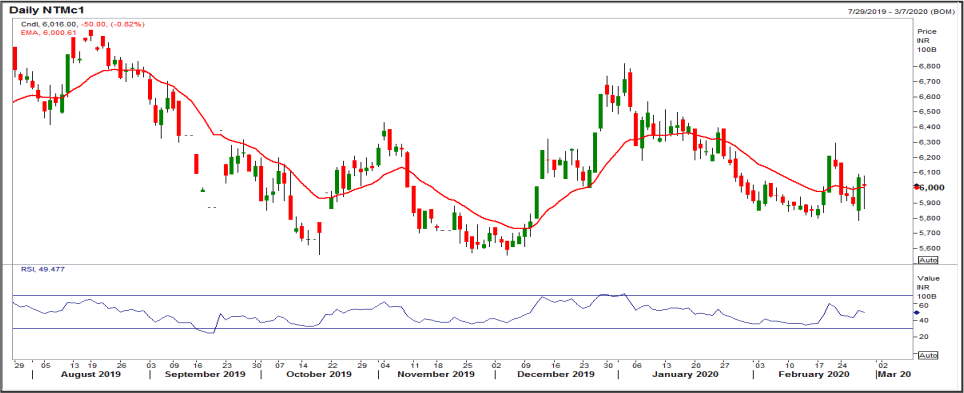
TMC NCDEX (MAR) contract was closed at Rs. 6066.00 on 27th Feb’2020. The contract made its high of Rs. 7600.00 on 03rd Sep’19 and a low of Rs. 5784.00 on 27th Feb’2020. The 18-day Exponential Moving Average of the commodity is currently at Rs. 6001.24. On the daily chart, the commodity has Relative Strength Index (14-day) value of 49.193.
One can buy near Rs. 6000 for a target of Rs. 6440 with the stop loss of Rs 5780.
11
Ÿ Markets regulator Sebi reviewed the margin framework for cash and derivatives segments, in order to bring more efficiency in the risk management system.
Ÿ The Centre further extended the deadline for mills to export balance sugar quota allocated during last season of 2018-19 till March 14.
Ÿ NAFED has been buying Chana in Andhra Pradesh under Price Support Scheme (PSS) during the 2020 Rabi season.
Ÿ Total new cotton crop arrivals so far this 2019-20 season have reached 2,22,37,000 bales, up 5.93 percent from 2,09,92,000 bales arrived during the same period last year.
Ÿ Argentina’s Ministry of Agriculture suspended the registration of agricultural exports until further notice.
Ÿ China Zhongwang Holdings, one of the world's biggest manufacturers of aluminium extrusions, stated that it would sell its smelting operations for 4.6 billion yuan ($655.94 million).
Ÿ U.S. Treasury Secretary Steven Mnuchin does not expect the coronavirus outbreak to have a material impact on the Phase 1 U.S.-China trade deal.
Ÿ Goldman Sachs stated that commodity prices could fall sharply before Chinese stimulus to combat the coronavirus impact later this year.
Ÿ Saudi Arabia is reducing crude supplies to China in March by at least 500,000 barrels per day (bpd) due to slower refinery demand following the coronavirus outbreak.
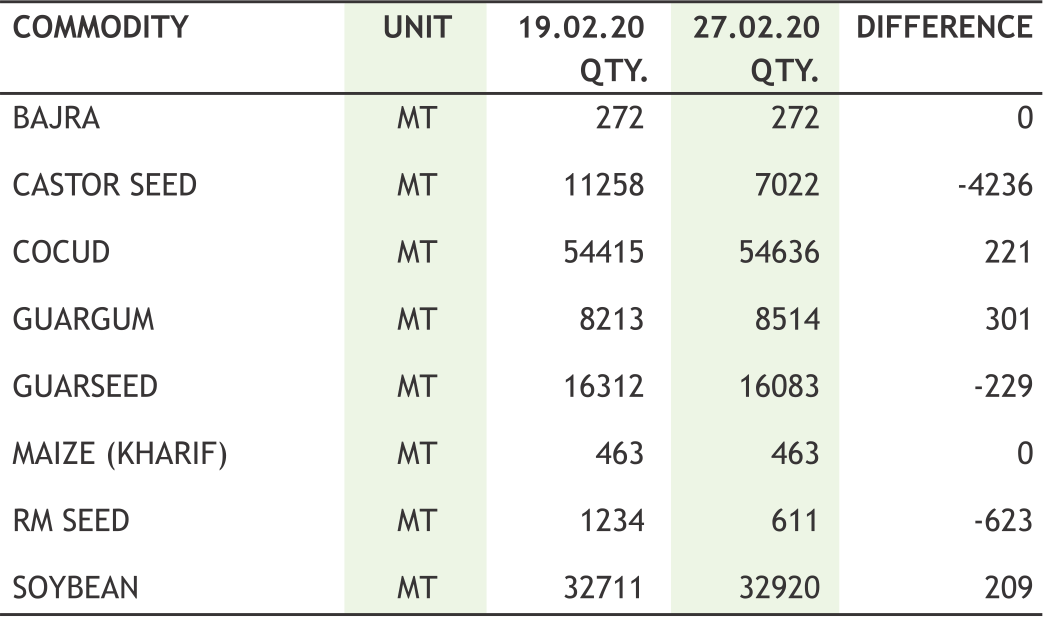
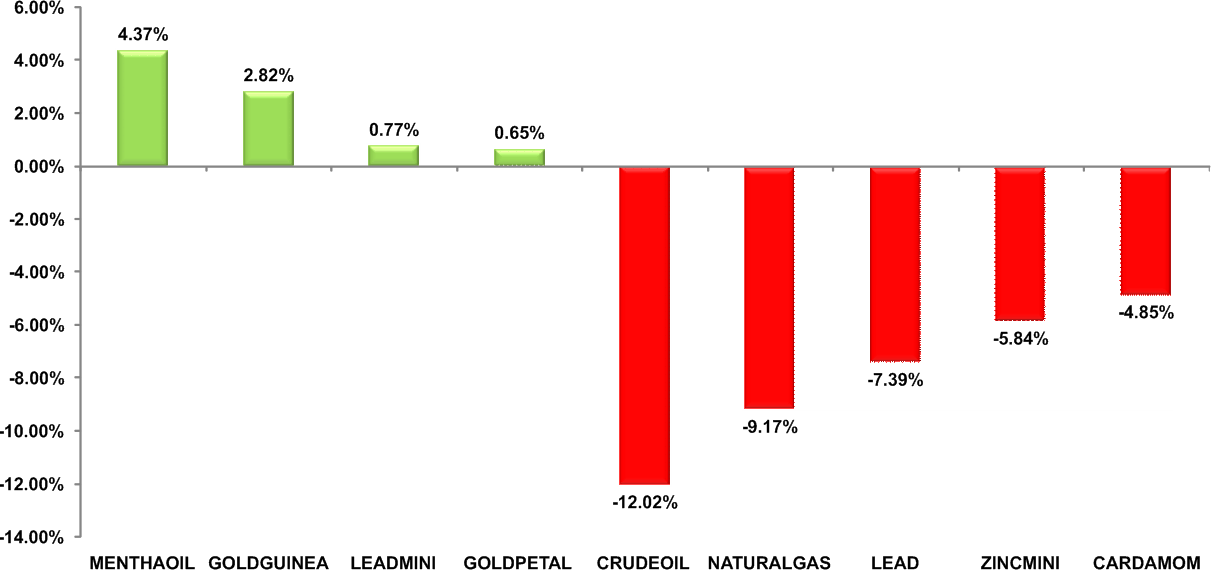
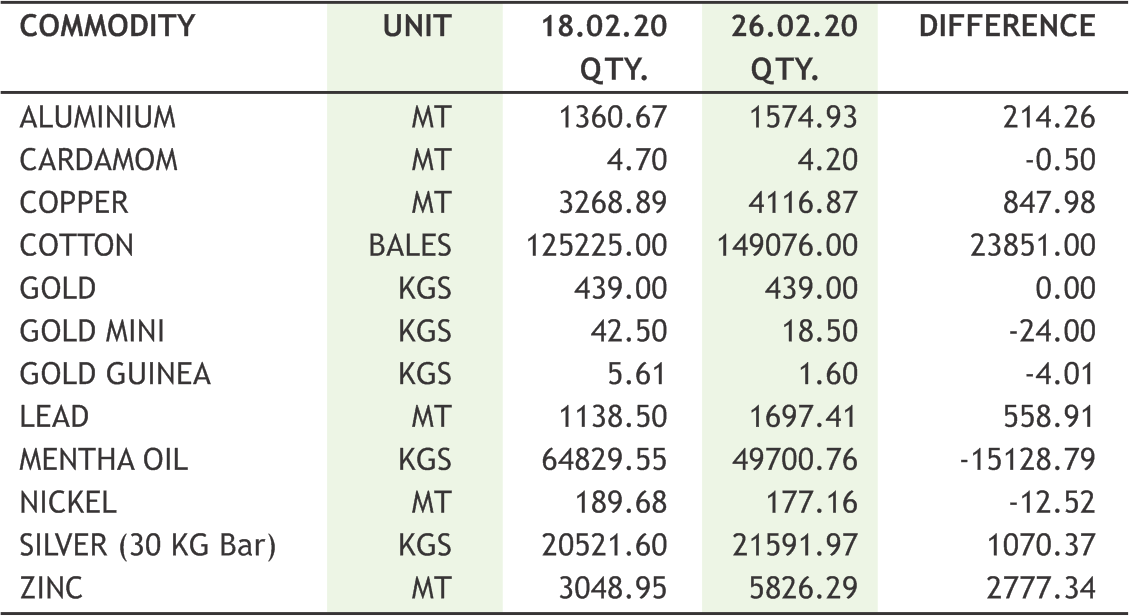
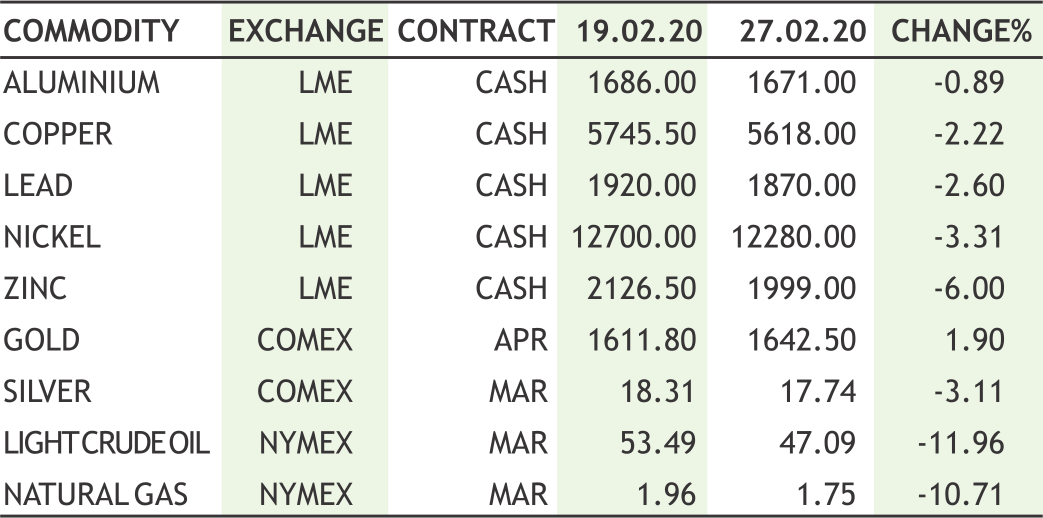
Outbreak of Coronavirus outside China stimulated selling pressure in financial market and commodities were not in exception. Number of cases found in every continent except Antartica, which created panic everywhere. Lockdown in some countries, halt in economic activities hit commodities prices further and it gave up all gains which it witnessed in previous two weeks. CRB saw sharp down side; closed near 173 levels. Oil prices plunged to their lowest in more than a year, putting them on track for the biggest weekly decline in more than four years, as the rapid spread of the coronavirus stoked fears of slowing global demand. Investors are increasingly worried the epidemic could turn into a pandemic, as the virus has spread beyond its epicenter in China to another 46 countries. Profit-taking prevented the yellow metal from regaining the momentum that took it to seven-year highs this week, despite equity market continued meltdown. Silver too experienced downside on profit booking from higher levels amid bearish industrial metals. Copper also fell as global inventories stood at the highest since Sept. 2018. Zinc fell to $1,995.50 – the lowest since June 28, 2016. It is headed for a weekly drop of 4.9%. SHFE stainless steel contract fell to the lowest since the contract was launched. SHFE nickel dropped, on its way for a sixth straight weekly decline; impact was seen in MCX as well.
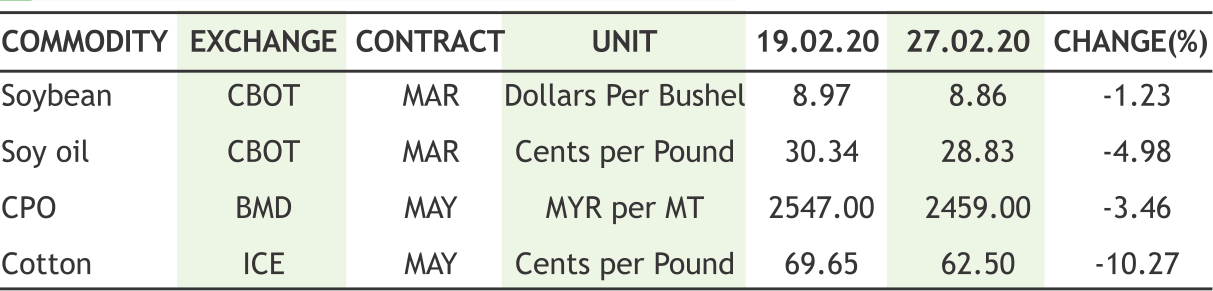
Even agri commodities were bearish. Soya counter was 9 week down. The trend is bearish due to weak demand from soymeal exporters as prices of the oilmeal were quoted much higher in domestic markets, compared with those offered in the global market. CBOT Soya counter was also weak as fears of the coronavirus outbreak developing into a pandemic weighed on prices, although Argentina’s move to suspend exports provided a floor to losses. CPO saw sharp decline on smooth availability in the country. It is reported that the India has issued about 70 licences for importing about five lakh tonnes of refined palm oil from three countries — Bangladesh, Nepal and Indonesia. Spices complex saw no respite and settled in red zone. Jeera traded near 13600 as arrivals of the new jeera crop are expected to gain momentum in the coming weeks. Currently, demand for the new crop is weak due to high moisture content. Coriander was down on fresh arrivals. The new crop of coriander has started arriving at the benchmark market of Ramganj in Rajasthan. Cotton prices ruled weak at major markets in Central and South India due to the decrease in demand from mills and exporters amid negative global cues. Guar was weak on major fall in crude prices. It was only chana and mentha, which saw some buying momentum.
|
|
12
|
|
Gold has been a currency for thousands of years. There are no mentions of the dollar, euro, yen, pound, or any of the other currencies in any manuscript or historical sculpture, but gold and silver are prominently featured. Gold is the ultimate hard currency. Gold is a ‘must have’ financial asset indeed’. Not only investors, but also nation’s central banks try to hoard gold in times of crisis as gold is playing a new role in the changing international financial environment.
India has 10th largest gold reserves
As per the World Gold Council's Febraury 2020 data, India has 10th largest gold reserves in the world. India' central bank has 633.1 tonnes of gold as holdings, which is 6.8 per cent of the share held in gold in total foreign reserves. United States (US) has the largest holding with 8133.5 tonnes, followed by Germany with 3366 tonnes and the International Monetary Fund (IMF) with 2814 tonnes. Globally, 34,716.50 tonnes of gold is held as reserves and of this, 10775.9 tonnes are in the Euro area and 11437.1 tonnes in the Central Bank Gold Agreement (CBGA) signatory countries, covering gold sales by Eurosystem Central Banks, Sweden and Switzerland.
India’s central bank bought 2.45 million troy ounces worth gold between November 2017 and November 2019, latest data indicates. India’s big gold purchase from IMF was the last in November 2009 when it bought 200 tonnes. India's gold reserves rose by $344 million to $29.123 billion till Feb. 2020.
RBI held 633.1 tonnes of gold, with 325.87 tonnes being held overseas in safe custody with the Bank of England and the Bank for International Settlements, while the remaining gold is held domestically, according to RBI’s latest report. In value terms, the share of gold in the total foreign exchange reserves increased marginally from about 5.59 per cent as at end-March 2019 to about 6.8 per cent as at end-January 2020.
Why RBI Gold Buying Picked Up
• Safety of its forex exchange asset is the prime reason as gold is a 100 percent guarantee from financial and geopolitical risks. Preserving its historical value, gold continues to be one of the safest assets in the world.
• The gold enhances the long-term stability of countries reserves and strengthens market confidence even under normal market circumstances.
• As per the December report of RBI on management of foreign exchange reserves, return optimisation is kept in view within this framework. Gold gives confidence in the power of the central bank’s balance sheet.
• The surge in foreign inflow and low yield on overseas sovereign bonds led to RBI buy gold.
• Considering the uncertainty like volatility or a correction in the stock market as well as dollar, after the US-China trade war, central bankers are adding gold to their reserves as a hedge as they don’t want to be caught unawares like they were in 2008. The RBI also started buying gold after a long gap.
13
|
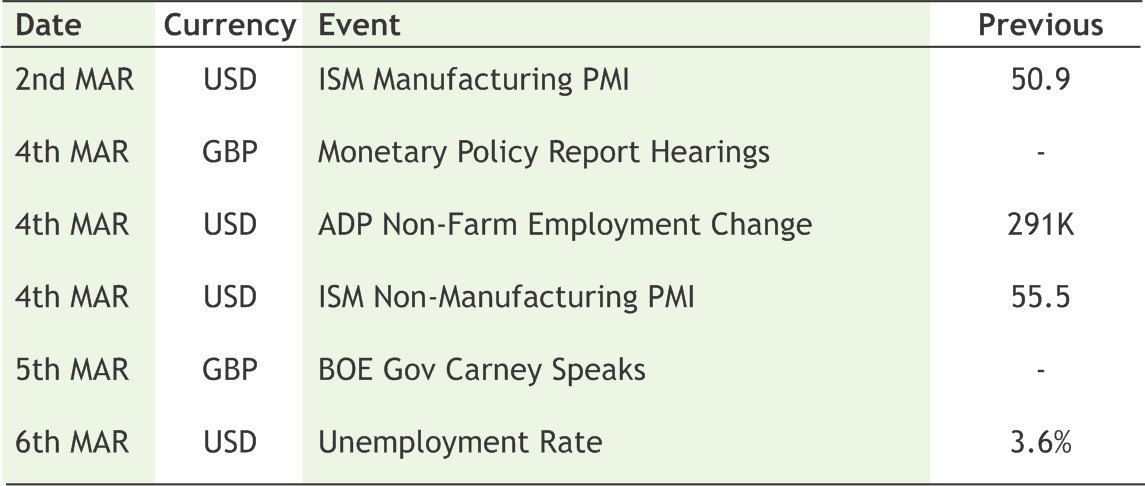
| 17th FEB | Emerging currencies continue the negative streak amid the corona virus impact in global supply chain. |
| 18th FEB | EUR/USD refreshes 34-month low on German Feb ZEW Economic Sentiment big miss. |
| 19th FEB | Foreign residents increased their holdings of long-term US securities in December according to the latest release of US Treasury International Capital Report. |
| 20th FEB | FOMC meeting minutes flagged Coronavirus Risk at January Meeting . |
| 21th FEB | Flash Euro Zone manufacturing PMI climbs to 12-month high in February. |
The entire financial markets are under great fear about what future holds while assessing the full-blown possible pandemic risk which is undermining the euphoria driven by recent central banks commitments to inject necessary liquidity. Risk aversion in assets continues in this week with an exceptional being euro as unwinding euro carry trades pushed the bloc currency to three week high to 1.10 to a dollar mark along with expectations of rate cut from US rate setters. However Indian Rupee somehow holding its ground relative to its Asian peers amid month end exporter realization of dollar into rupee as well as lower oil prices is bringing a great relief in external payments. Additionally lower US yield which touched historical low may provide cushion to high yield currencies including Indian rupee in the days to come subject to improvement in global headwinds. Indeed concerns over steep outflows to the tune Rs 16,500 crores within two months in this year will cap the positive sentiment in rupee. The most important economic data in next week will be Chinese Manufacturing PMIs which is likely to print the lowest level since Global Financial Crisis. Notably the survey took place in early January when the outbreak started in China but if the survey would have done in mid February where the cases recorded in global levels outpaced China will be much more disastrous than the next week PMI figures.
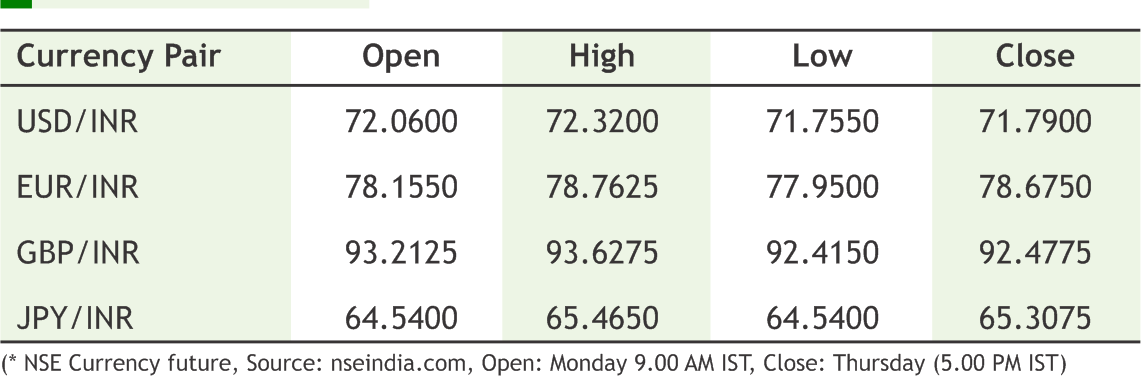
USDINR is likely to stay in the range of 71.50 to 72.40 with upward bias.
|
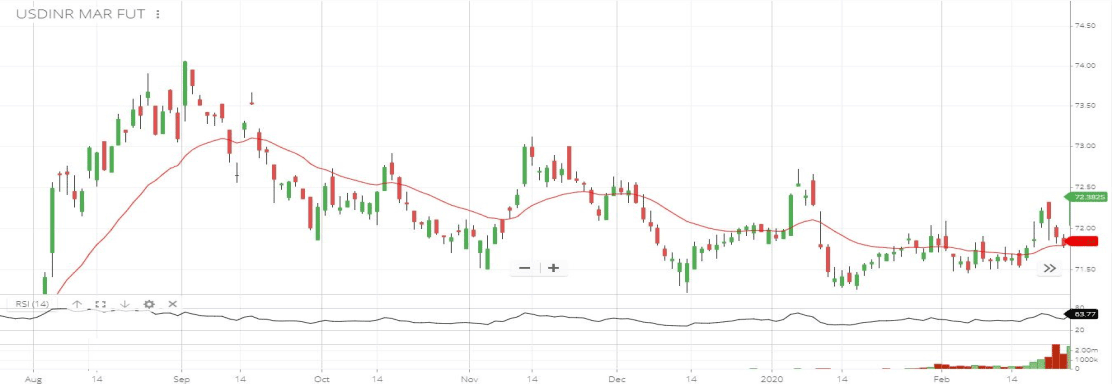
USD/INR (MAR) contract closed at 71.7900 on 27-Feb-2020. The contract made its high 72.3200 on 25-Feb-2020 and a low of 71.7550 on 27-Feb-2020 (Weekly Basis). The 21-day Exponential Moving Average of the USD/INR is currently at 71.85.
On the daily chart, the USD/INR has Relative Strength Index (14-day) value of 65. One can buy at 71.90 for the target of 72.40 with the stop loss of 71.60
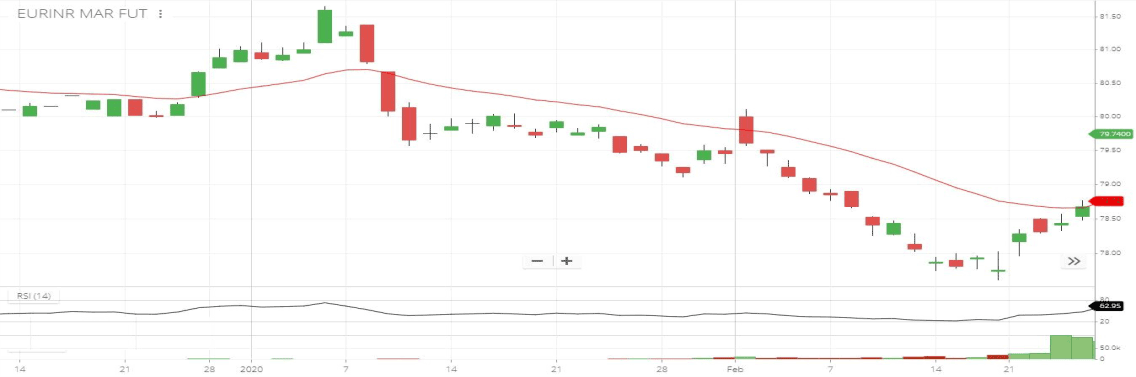
EUR/INR (MAR) contract closed 78.6750 on 27-Feb-2020. The contract made its high of 78.7625 on 27-Feb-2020 and a low 77.9500 on 24-Feb-2020 (Weekly Basis). The 21-day Exponential Moving Average of the EUR/INR is currently at 78.76.
On the daily chart, EUR/INR has Relative Strength Index (14-day) value of 63.35. One can buy at 79.20 for a target of 80.50 with the stop loss of 78.70.
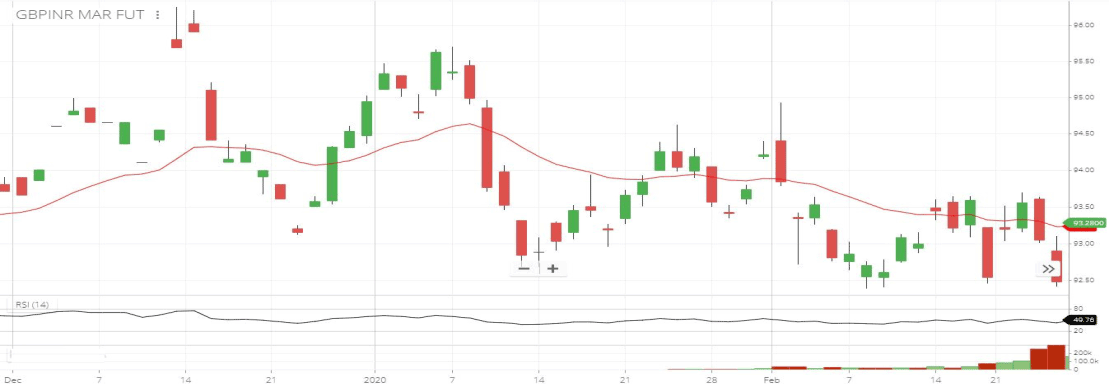
GBP/INR (MAR) contract closed at 92.4775 on 27-Feb-2020. The contract made its high of 93.6275 on 26-Feb-2020 and a low of 92.4150 on 27-Feb-2020 (Weekly Basis). The 21-day Exponential Moving Average of the GBP/INR is currently at 93.24.
On the daily chart, GBP/INR has Relative Strength Index (14-day) value of 50.35. One can buy at 92.40 for a target of 93.40 with the stop loss of 92.00.
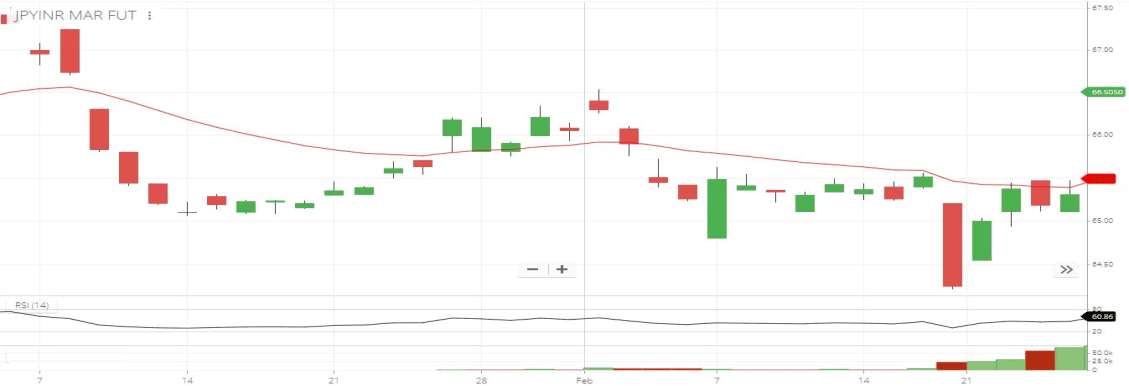
JPY/INR (MAR) contract closed at 65.3075 on 27-Feb-2020. The contract made its high of 65.4650 on 26-Feb-2020 and a low of 64.5400 on 24-Feb-2020 (Weekly Basis). The 21-day Exponential Moving Average of the JPY/INR is currently at 65.49.
On the daily chart, JPY/INR has Relative Strength Index (14-day) value of 61.20. One can buy at 65.60 for a target of 66.80 with the stop loss of 64.90.
14

| Industry | E-Commerce |
| Offer for sale (Shares) | 130,526,798 |
| Fresh Issue (Shares) | 6,622,517 |
| Eligible Employees (Shares) | 1,864,669 |
| SBI Shareholders Res. (Shares) | 13,052,680 |
| Net Offer to the Public | 137,149,315 |
| Issue Size (Rs. Cr.) | 10286-10355 |
| Price Band (Rs.) | 750-755 |
| Employee Discount | Rs. 75 |
| Offer Date | 2-Mar-20 |
| Close Date | 5-Mar-20 |
| Face Value | 10 |
| Lot Size | 19 |
| Total Issue for Sale | 122,231,966 |
| QIB | 61,115,983 |
| NIB | 18,334,795 |
| Retail | 42,781,188 |
| The net proceeds of the Fresh Issue, i.e. Gross proceeds of the Fresh Issue less the Offer Expenses apportioned to the Company ("Net Proceeds") are proposed to be utilized for augmenting the capital base to meet company's future capital requirements. |
Book Running Lead Manager
• ICICI Securities Limited
• Nomura Financial Advisory and Securities (India) Private Limited
Name of the registrar
Karvy Fintech Private Limited
Considering the P/E valuation on the upper end of the price band of Rs. 755, the stock is priced at pre issue P/E of 45.46x on its estimated annualised FY20 EPS of Rs. 16.61. Post issue, the stock is priced at a P/E of 45.79x on its EPS of Rs. 16.49. Looking at the P/B ratio at Rs. 755 the stock is priced at P/B ratio of 19.65x on the pre issue book value of Rs.38.42 and on the post issue book value of Rs. 43.47 the P/B comes out to 17.37x.
On the lower end of the price band of Rs.750 the stock is priced at pre issue P/E of 46.16x on its estimated annualised FY20 EPS of Rs. 16.61. Post issue, the stock is priced at a P/E of 45.48x on its EPS of Rs. 16.49. Looking at the P/B ratio at Rs. 750, the stock is priced at P/B ratio of 19.52x on the pre issue book value of Rs. 38.42 and on the post issue book value of Rs. 43.47, the P/B comes out to 17.25x.
About the company:
Incorporated in 1998, SBI Cards and Payment Services Limited is a subsidiary of SBI, India's largest commercial bank in terms of deposits, advances and the number of branches. Since its operations, SBI’s parentage and highly trusted brand have allowed it to quickly establish a reputation of trust, reliability and transparency with its cardholders. SBI currently holds (along with its nominees) 689,927,363 Equity Shares, constituting to 74.00 % of the pre-Offer issued, subscribed and paid-up Equity Share capital of the Company. The Company offers four primary SBI Card-branded credit cards namely SimplySave, SimplyClick, Prime and Elite, each catering to a varying set of cardholder needs
Strength
Second largest credit card issuer in India with deep industry expertise and a demonstrated track record of growth and profitability: : According to RBI, SBI cards is the second-largest credit card issuer in India both in terms of numbers of credit cards outstanding and amounts of credit card spends, with 9.46 million credit cards outstanding as of September 30, 2019 and Rs.1,032.65 billion in total of credit card spends in fiscal 2019. From March 31, 2017 to March 31, 2019, its total credit card spends grew at a 54.2% CAGR (as compared to a 35.6% CAGR for the Indian credit card industry, according to the RBI) and the number of its credit cards outstanding grew at a 34.5% CAGR (as compared to a 25.6% CAGR for the Indian credit card industry, according to the RBI).
Diversified customer acquisition capabilities: SBI cards deploys a sales force of 33,086 outsourced sales personnel as of September 30, 2019 operating out of 133 Indian cities and which engages prospective customers through multiple channels, including physical points of sale, telesales and online.
Diversified portfolio of credit card offerings: SBI Card’s credit card portfolio caters to individual cardholders and corporate clients, and includes lifestyle, rewards, travel and fuel, shopping, banking partnership cards and corporate credit cards. It offers four primary SBI branded credit cards: SimplySave, SimplyClick, Prime and Elite, each catering to a varying set of cardholder needs. As a subsidiary of SBI, the company has access to SBI's extensive network of 21,961 branches across India. The partnership enables it to market its cards to a huge customer base of 445.5 million customers.
Advanced risk management and data analytics capabilities: SBI cards possess a large database of cardholder demographic and socio-economic data derived from the numerous transactions carried out by millions of cardholders each year. The company also takes an in-depth approach to credit analytics in its periodic credit monitoring processes. It sees this capability as a distinct competitive advantage, as the CRISIL Report expects these cardholder segments to be key growth drivers for India’s credit card market in the future.
Strategies
Expand customer acquisition capabilities to grow the cardholder base: SBI Cards aims to increase the number of open market physical points of sale that it operates across India. The company is focused on increasing its presence in India’s tier II and tier III cities where its cardholder base has historically been underrepresented, but which have contributed an increasing proportion of their new accounts in recent years. The company also remains committed to entering into new co-brand partnerships, including with leading organized retail chains, online aggregators and financial marketplaces, to tap into new cardholder segments by cross-selling into their new co-brand partners’ customer base.
Tap into new cardholder segments by broadening portfolio of credit card products: : SBI Cards Ltd intends to tap into new cardholder segments by continuing to expand its portfolio of credit card products to meet the needs of its existing cardholders and prospective customers, particularly by offering new credit card products tailored for different income-based and lifestyle segments.
Stimulate growth in credit card transaction volumes: SBI Cards is constantly working to enhance its value proposition to its cardholders by rolling out new cash back rewards offers, bonus reward points and merchant discounts. As part of these efforts, company plans to increasingly leverage its data analytics platform to deliver more targeted and timely offers to its cardholders.
Continue to optimize the risk management processes: The Company believes that credit management will be key to helping it to manage credit risk and detect early warning signs of credit difficulties.
Continue leveraging technology across operations: SBI Card focuses on leveraging technology and data analytics in the Indian credit card industry, it intends to continue investing to further enhance these capabilities and derive greater operating efficiencies. In order to maximize the efficiency of its marketing strategy, it is currently deploying geotagging technologies to identify areas with significant potential for credit card penetration. It believes that the continuous evolution of its technological capabilities will drive increased efficiencies, improve its operations and ultimately provide them with a significant competitive advantage.
Risk Factor
• Tough competition
• Fraudulent activity associated with its products and Network
• Cyber-attacks or other security breaches
Outlook
SBI Cards is the subsidiary of SBI and the 2nd largest card issuer in India with nearly 18 per cent market share. Its revenues and margins are consistent and improving. Moreover, in the past, the growth of the company was way ahead of the industry. Additionally, estimates by CRISIL suggests that the industry would grow by 2.5 times in next five years which itself indicates the potential of the company. Since it is the first kind of listing in this domain, investors’ interest appears to be on a higher side.
15
|
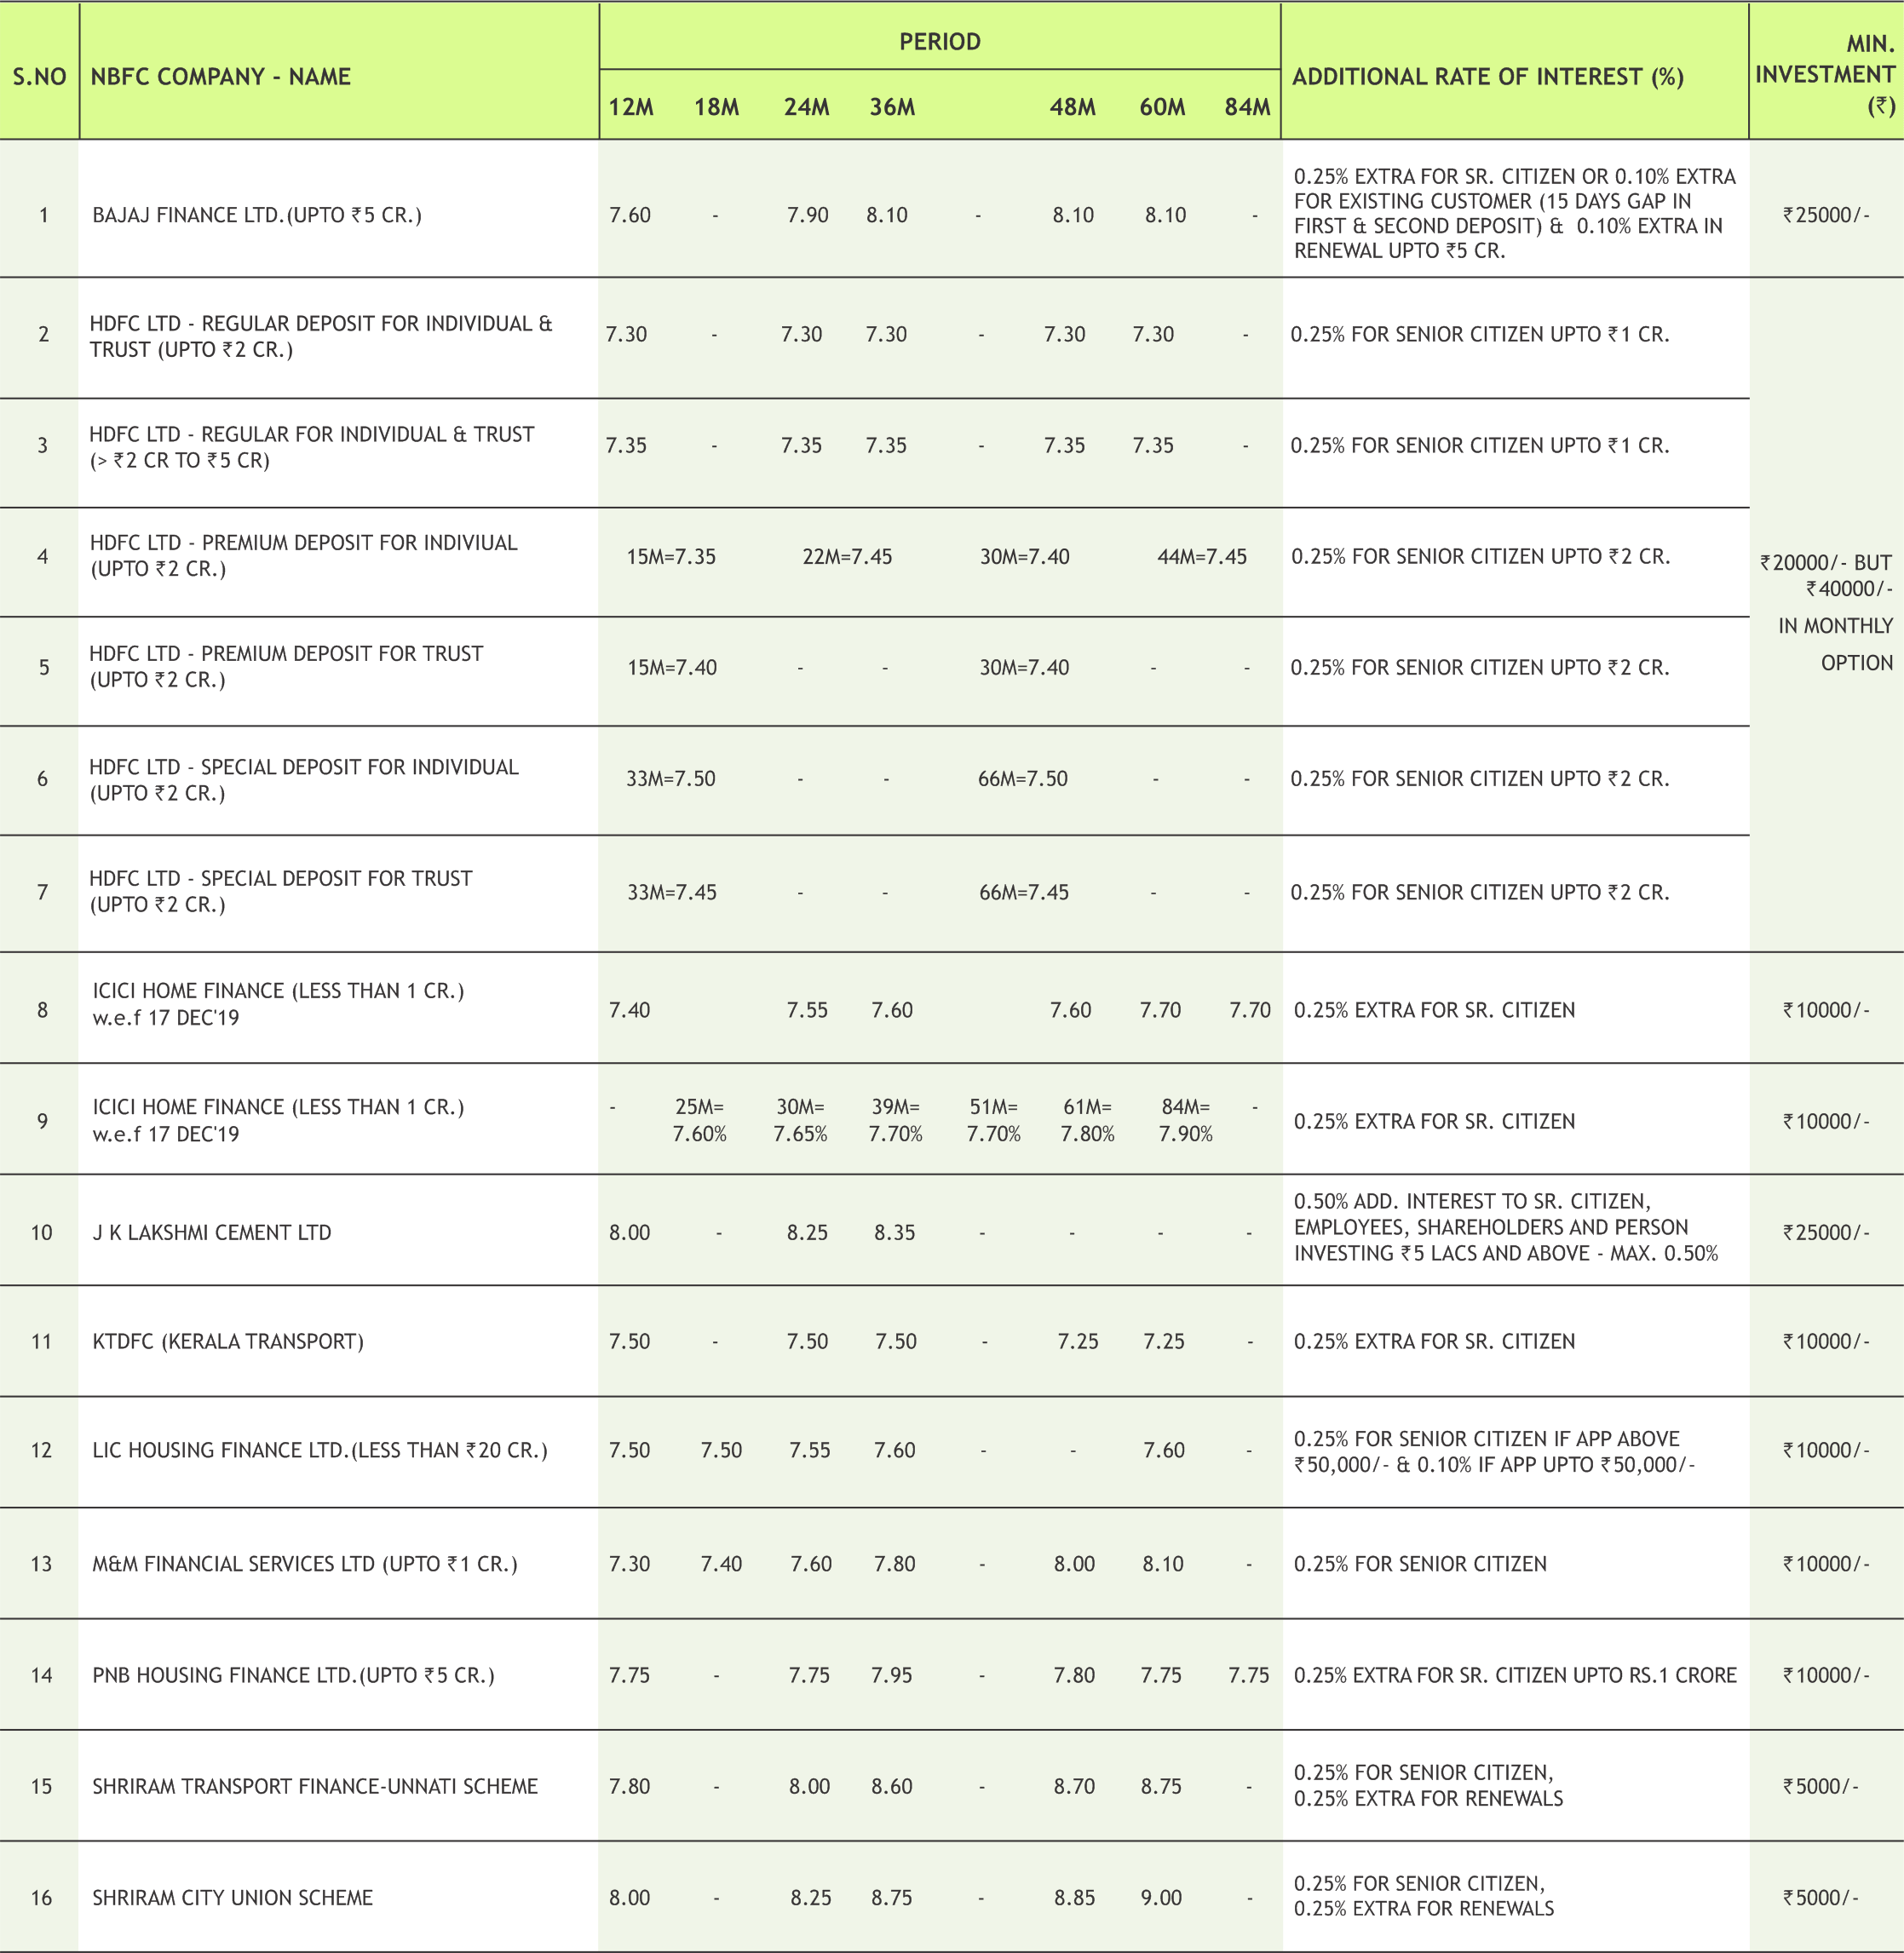
* Interest Rate may be revised by company from time to time. Please confirm Interest rates before submitting the application.
* For Application of Rs.50 Lac & above, Contact to Head Office.
* Email us at fd@smcindiaonline.com

16

|
|

|
|

|
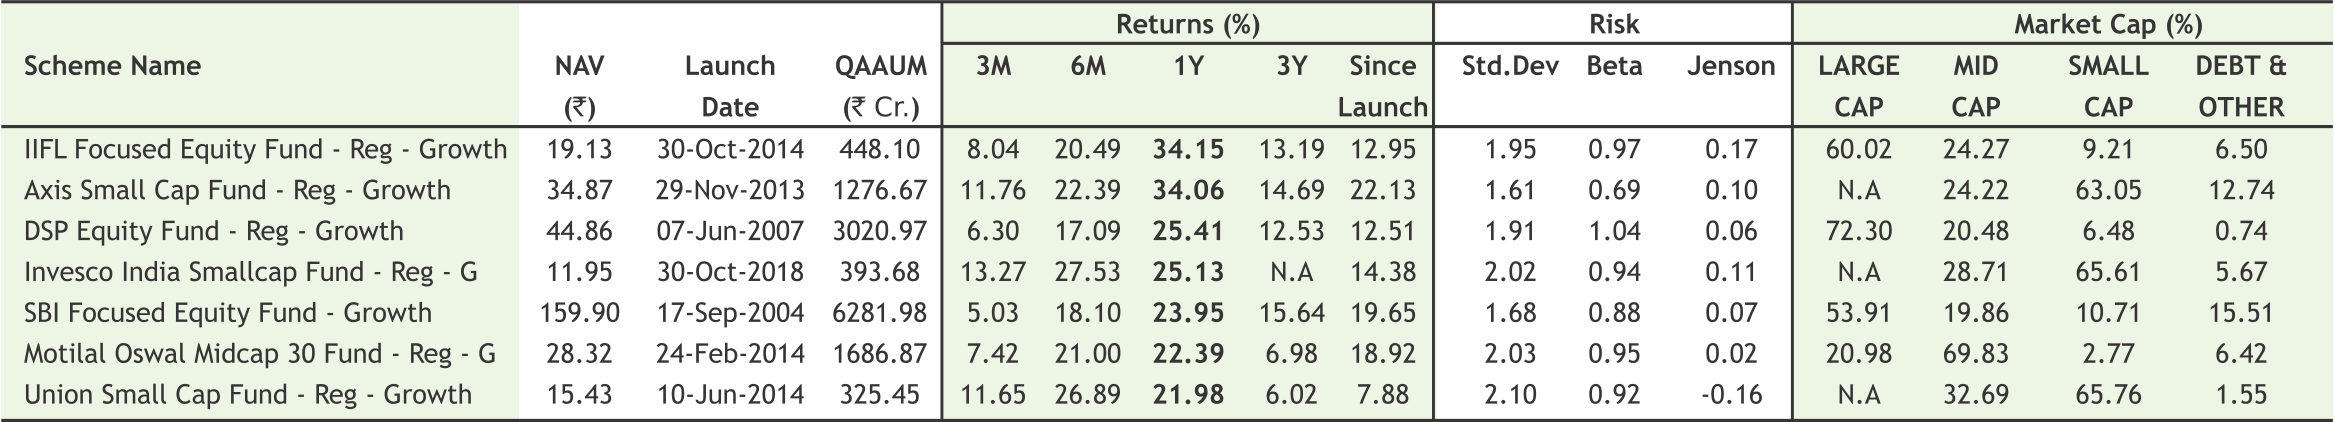
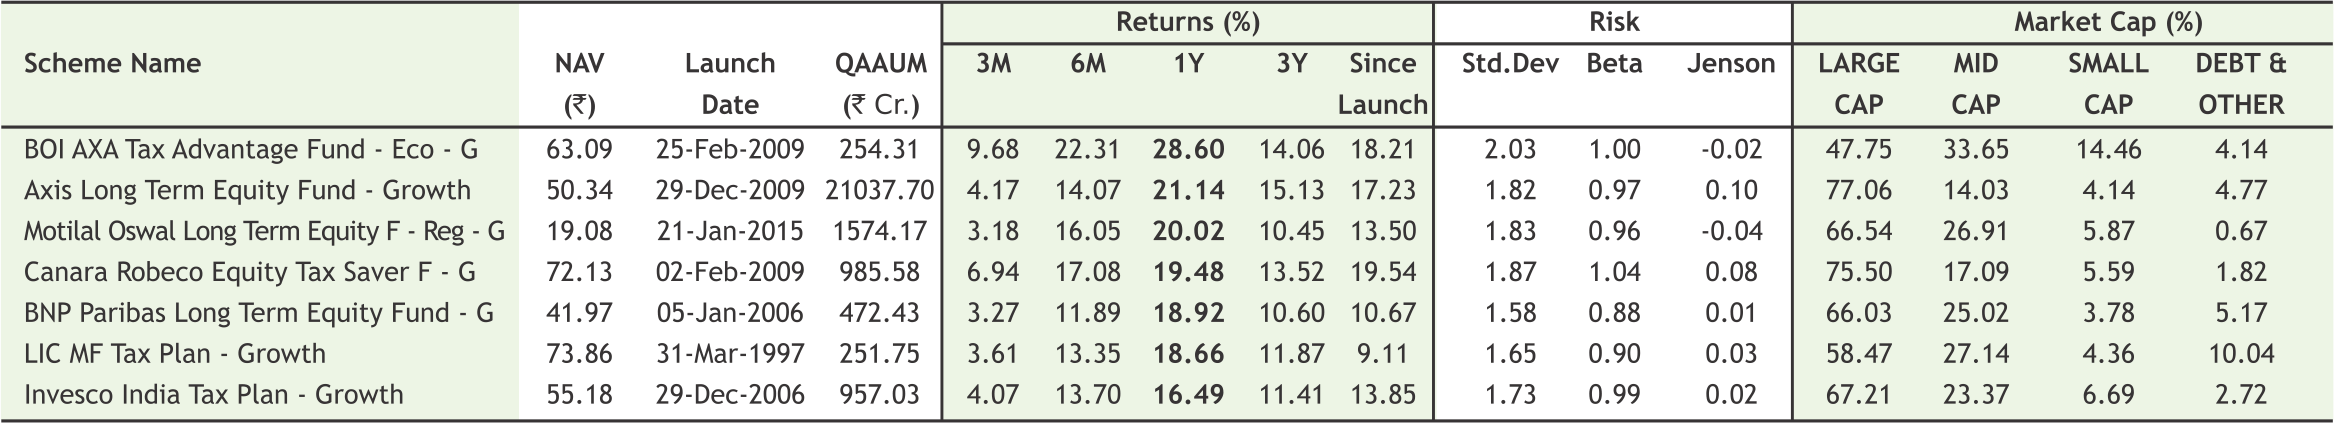
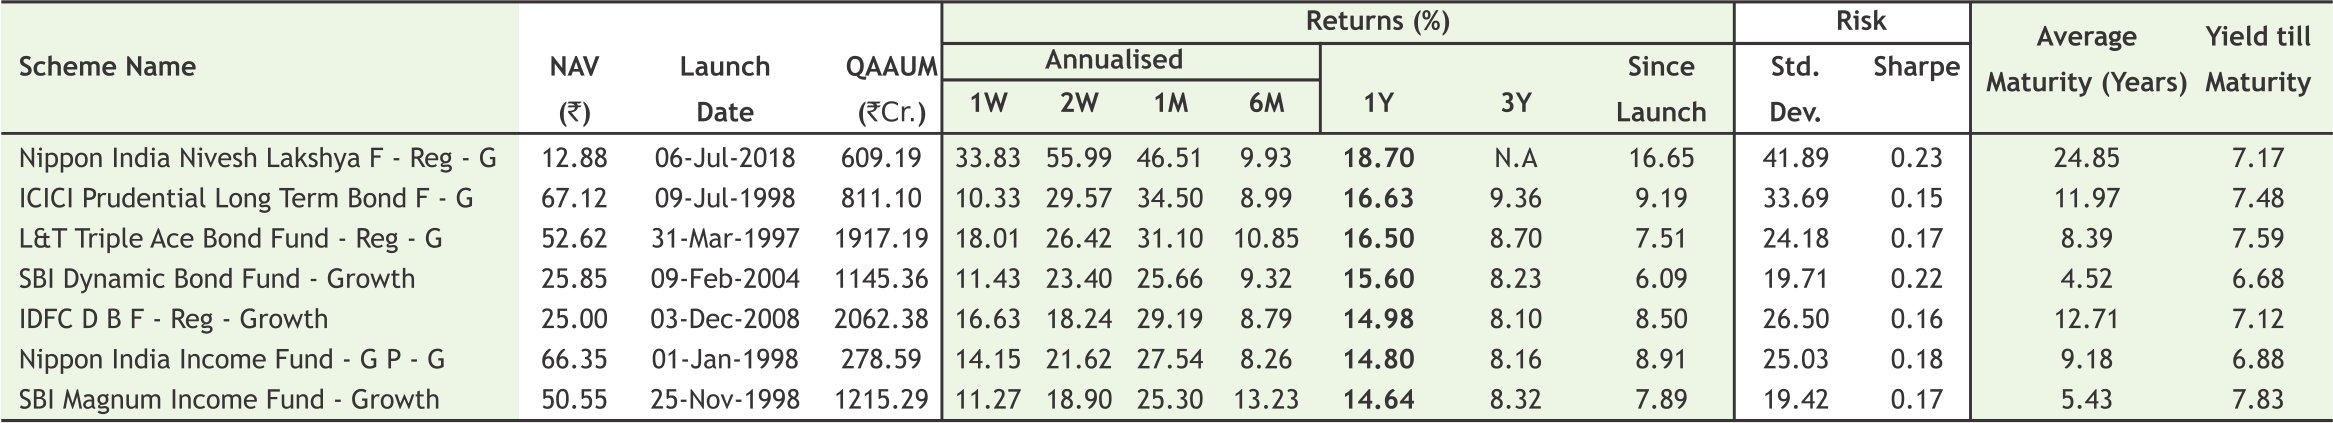
Note:Indicative corpus are including Growth & Dividend option . The above mentioned data is on the basis of 08/08/2019 Beta, Sharpe and Standard Deviation are calculated on the basis of period: 1 year, frequency: Weekly Friday, RF: 7%
*Mutual Fund investments are subject to market risks, read all scheme related documents carefully
18
Dr. D K Aggarwal (CMD, SMC Investments & President, PHDCCI) during the meeting with Shri Ajay Bhushan Pandey, Revenue Secretary, Government of India on 11th December, 2019 at New Delhi.
Mr. Pulin Behari Das (Vice President, SMC Global Securities Ltd.) and Mr. Smruti Ranjan Sahoo (Area Manager, SMC Global Securities Ltd.) during the inauguration of SMC's New Branch at Sambalpur, Odisha.


![]() Customized Plans
Customized Plans
![]() Comprehensive Investment Solutions
Comprehensive Investment Solutions
![]() Long-term Focus
Long-term Focus
![]() Independent & Objective Advise
Independent & Objective Advise
![]() Financial Planning
Financial Planning

Call Toll-Free 180011 0909
Visit www.smcindiaonline.com
REGISTERED OFFICES:
11 / 6B, Shanti Chamber, Pusa Road, New Delhi 110005. Tel: 91-11-30111000, Fax: 91-11-25754365
MUMBAI OFFICE:
Lotus Corporate Park, A Wing 401 / 402 , 4th Floor , Graham Firth Steel Compound, Off Western Express Highway, Jay Coach Signal, Goreagon (East) Mumbai - 400063
Tel: 91-22-67341600, Fax: 91-22-67341697
KOLKATA OFFICE:
18, Rabindra Sarani, Poddar Court, Gate No-4,5th Floor, Kolkata-700001 Tel.: 033 6612 7000/033 4058 7000, Fax: 033 6612 7004/033 4058 7004
AHMEDABAD OFFICE :
10/A, 4th Floor, Kalapurnam Building, Near Municipal Market, C G Road, Ahmedabad-380009, Gujarat
Tel : 91-79-26424801 - 05, 40049801 - 03
CHENNAI OFFICE:
Salzburg Square, Flat No.1, III rd Floor, Door No.107, Harrington Road, Chetpet, Chennai - 600031.
Tel: 044-39109100, Fax -044- 39109111
SECUNDERABAD OFFICE:
315, 4th Floor Above CMR Exclusive, BhuvanaTower, S D Road, Secunderabad, Telangana-500003
Tel : 040-30031007/8/9
DUBAI OFFICE:
2404, 1 Lake Plaza Tower, Cluster T, Jumeriah Lake Towers, PO Box 117210, Dubai, UAE
Tel: 97145139780 Fax : 97145139781
Email ID : pankaj@smccomex.com
smcdmcc@gmail.com
Printed and Published on behalf of
Mr. Saurabh Jain @ Publication Address
11/6B, Shanti Chamber, Pusa Road, New Delhi-110005
Website: www.smcindiaonline.com
Investor Grievance : igc@smcindiaonline.com
Printed at: S&S MARKETING
102, Mahavirji Complex LSC-3, Rishabh Vihar, New Delhi - 110092 (India) Ph.: +91-11- 43035012, 43035014, Email: ss@sandsmarketing.in