2019: Issue 672, Week: 25th February – 01st March
A Weekly Update from SMC (For private circulation only)
WISE M NEY
NEY


2019: Issue 672, Week: 25th February – 01st March
A Weekly Update from SMC (For private circulation only)
NEY


| Equity | 4-7 |
| Derivatives | 8-9 |
| Commodity | 10-13 |
| Currency | 14 |
| IPO | 15 |
| FD Monitor | 16 |
| Mutual Fund | 17-18 |
G
lobal stock markets were mixed in the week gone by with U.S. markets showing Gweakness on account of uneven progress in U.S.-China trade talk and weaker than expected economic data including home sales and durable goods order. Mixed expectations are there among market participants on whether U.S. would move ahead to increase tariffs on Chinese goods on March 1. Minutes of the Federal Reserve Meeting suggested that the central bank would remain patient in interest rate and would inch if economy does well than expectation or in case inflation comes higher than baseline outlook. Japanese manufacturing activity contracted for the first time two-and-a-half years in the month of February as factories cut output amid shrinking domestic and export orders.
Back at home, investors remained cautious after the release of the minutes of RBI's last policy meet, in which governor Shaktikanta Das argued the need to look at growth concerns. Minutes of the Monetary Policy Committee's meeting held on February 5-7 indicated that the central bank would be flexible to address challenges to sustained growth of the Indian economy over the coming months. Government’s decision to infuse Rs 48,239 crore in 12 public-sector banks that are under Reserve Bank of India’s prompt corrective action framework helped in some buying interest emerging in public sector banking stocks. Oil gained for the second consecutive week on the back of optimism rising on the back of cut in supplies by Saudi Arabia and its partners may add to little concerns for the domestic equities and may result in sectoral churning. Going forward, the Global macroeconomic data and trend in global markets will be closely monitored. Also, investment by foreign and domestic investors will give direction to the market along with the movement of rupee against the dollar and crude oil price movement. Stock specific movements are expected in the domestic market going forward.
On the commodity market front, buying emerged in commodities last week and CRB inched higher for the continuous second week. Crude oil prices may continue to remain on upbeat note as oil prices hovered just below 2019 highs recently, bolstered by OPEC-led supply cuts and U.S. sanctions on Venezuela and Iran. Crude oil can test 4250 levels while taking support near 3850 levels. In the base metal counter, prices can trade with sideways to positive path as hopes for further government stimulus in China and optimism regarding US China trade deal to support the prices. Gold can test 33000 levels while facing resistance near 33800 levels. Retail Sales Advance, Powell Testifies Before Senate Banking Panel, Consumer Confidence Index, Advance Goods Trade Balance, Powell to deliver Semi-Annual Testimony to House Panel, BEA Releasing Initial 4Q Gross Domestic Product¸ GDP, Personal Consumption Expenditure Core¸ ISM Manufacturing and ISM Employment form US, CPI of Canada, GDP of Switzerland and Germany, Manufacturing PMI of China, etc are few data that are scheduled this week, which should be taken care of while trading in commodities.

SMC Global Securities Ltd. (hereinafter referred to as “SMC”) is a registered Member of National Stock Exchange of India Limited, Bombay Stock Exchange Limited and its associate is member of MCX stock Exchange Limited. It is also registered as a Depository Participant with CDSL and NSDL. Its associates merchant banker and Portfolio Manager are registered with SEBI and NBFC registered with RBI. It also has registration with AMFI as a Mutual Fund Distributor.
SMC is a SEBI registered Research Analyst having registration number INH100001849. SMC or its associates has not been debarred/ suspended by SEBI or any other regulatory authority for accessing /dealing in securities market.
SMC or its associates including its relatives/analyst do not hold any financial interest/beneficial ownership of more than 1% in the company covered by Analyst. SMC or its associates and relatives does not have any material conflict of interest. SMC or its associates/analyst has not received any compensation from the company covered by Analyst during the past twelve months. The subject company has not been a client of SMC during the past twelve months. SMC or its associates has not received any compensation or other benefits from the company covered by analyst or third party in connection with the research report. The Analyst has not served as an officer, director or employee of company covered by Analyst and SMC has not been engaged in market making activity of the company covered by Analyst.
The views expressed are based solely on information available publicly available/internal data/ other reliable sources believed to be true.
SMC does not represent/ provide any warranty express or implied to the accuracy, contents or views expressed herein and investors are advised to independently evaluate the market conditions/risks involved before making any investment decision.
DOMESTIC NEWS
Economy
• The Central Government has approved Rs 48239 crore of recapitalization to 12 public sector banks (PSBs). With the latest funding, the total amount of capital infusion would increase to Rs 100958 crore of the planned recapitalization of Rs 1.06 lakh crore for PSBs in FY2019.
Pharmaceuticals
• Glenmark Pharmaceuticals has received final approval from the US health regulator for its generic version of clobetasol propionate foam 0.05%, a steroid used to treat inflammation and itching of the skin. Olux Foam, 0.05 per cent, of Mylan Pharmaceuticals achieved annual sales of approximately $50.9 million in the 12-month period ended December 2018.
• Dr Reddy's Laboratories has re-launched its Buprenorphine and Naloxone Sublingual Film, the generic version of Suboxone in the US market. Indivior is in a legal battle against the launch of the copycat version of its opioid addiction treatment by competitors, including Dr Reddy's Laboratories in the US market. Suboxone had sales of around $1.86 billion for the 12 months ended April 2018.
Information Technology
• TCS has entered the automated technology solutions field through a partnership with Utah-based cognitive technology firm Nanoheal. The duo will leverage predictive analytics and deep delivery expertise to offer self-healing solutions to a number of clients. Nanoheal was established in 2012 as a workplace automation platform that specialises in real-time analytics.
Capital Goods
• ABB India has won its largest traction equipment order in India, worth more than Rs 270 crore to supply state-of-the-art converters for electric locomotives from Diesel Locomotive Works (DLW), in Varanasi. The converters are custom designed for Indian Railways and will be manufactured at Nelamangala, near Bengaluru, in southern India.
Automobiles
• Ashok Leyland launched new variants of intermediate commercial vehicle (ICV) GURU 1010 and a medium duty vehicle (MDV) Boss 1616 and 1916. While GURU 1010 is 10 tonne gross vehicle weight (gvw) , Boss will come in 16 and 19 tonne gvw. The company is betting on providing better profitability to the customer with the new variants by providing better operational efficiency in terms of driver comfort and fuel efficiency.
FMCG
• Varun Beverages has acquired the franchise rights for the southern and western regions for bottling, sales and distribution. The company already has the bottling rights for north and east India. Post acquisitions, the company will be a franchisee of PepsiCo’s beverages business across 27 states and seven Union Territories of India.
Infrastructure
• Ashoka Buildcon has won a Rs 1,382 crore highway contract in Karnataka from National Highways Authority of India (NHAI). The contract to build 56 km highway stretch is under hybrid annuity mode (HAM) under which the government provides 40 per cent of the project cost to start work, while the remaining investment is made by the developer.
INTERNATIONAL NEWS
• U.S. Jobless initial jobless claims dropped to 216,000, an decrease of 23000 from the previous week's unrevised level of 239,000. Economists had expected jobless claims to drop to 229,000.
• U.S. durable goods orders surged up by 1.2 percent in December after jumping by an upwardly revised 1.0 percent in November. Economists had expected durable goods orders to soar by 1.5 percent compared to the 0.7 percent increase that had been reported for the previous month.
• Eurozone's private sector expanded at the fastest pace in three months in February, led by stronger growth in services, while manufacturing contracted preliminary survey data from IHS Markit showed. The flash Composite Purchasing Managers' Index rose to 51.4 from 51 in January. Economists had forecast a score of 51.1
• Japan overall nationwide consumer prices were up just 0.2 percent on year in January. That was in line with expectations and down from 0.3 percent in December.
| Stocks | *Closing Price | Trend | Date Trend Changed | Rate Trend Changed | SUPPORT | RESISTANCE | Closing S/l |
|---|---|---|---|---|---|---|---|
| S&P BSE SENSEX | 35871 | UP | 15.02.19 | 34970 | 35400 | 34700 | |
| NIFTY50 | 10792 | UP | 15.02.19 | 10316 | 10600 | 10400 | |
| NIFTY IT* | 15685 | UP | 21.07.17 | 10712 | 15200 | 14800 | |
| NIFTY BANK | 26868 | UP | 30.11.18 | 26863 | 25900 | 25400 | |
| ACC | 1384 | 1384 | 24.01.19 | 1420 | 1420 | 1450 | |
| BHARTIAIRTEL | 314 | DOWN | 25.01.18 | 453 | 330 | 340 | |
| BPCL | 344 | DOWN | 15.02.19 | 328 | 350 | 350 | |
| CIPLA | 541 | DOWN | 26.10.18 | 604 | - | 545 | |
| SBIN | 271 | UP | 02.11.18 | 286 | - | 260 | |
| HINDALCO | 196 | DOWN | 04.01.19 | 211 | 205 | 210 | |
| ICICI BANK | 352 | UP | 02.11.18 | 355 | - | 340 | INFOSYS | 735 | UP | 14.12.18 | 706 | 690 | 670 |
| ITC | 274 | DOWN | 22.01.19 | 274 | 283 | 290 | |
| L&T | 1280 | DOWN | 18.01.19 | 1318 | 1300 | 1330 | |
| MARUTI | 6912 | DOWN | 14.09.18 | 8627 | 7300 | 7500 | |
| NTPC | 140 | DOWN | 26.10.18 | 159 | 143 | 147 | |
| ONGC* | 149 | DOWN | 05.10.18 | 147 | - | 150 | |
| RELIANCE | 1232 | UP | 30.11.18 | 1168 | 1200 | 1170 | |
| TATASTEEL** | 502 | DOWN | 26.10.18 | 552 | - | 510 | |
*LT has breached the resistance of 1300 **ONGC has breached the resistance of 145 ***TATASTEEL has breached the resistance of 490
Closing as on 01-03-2019
NOTES:
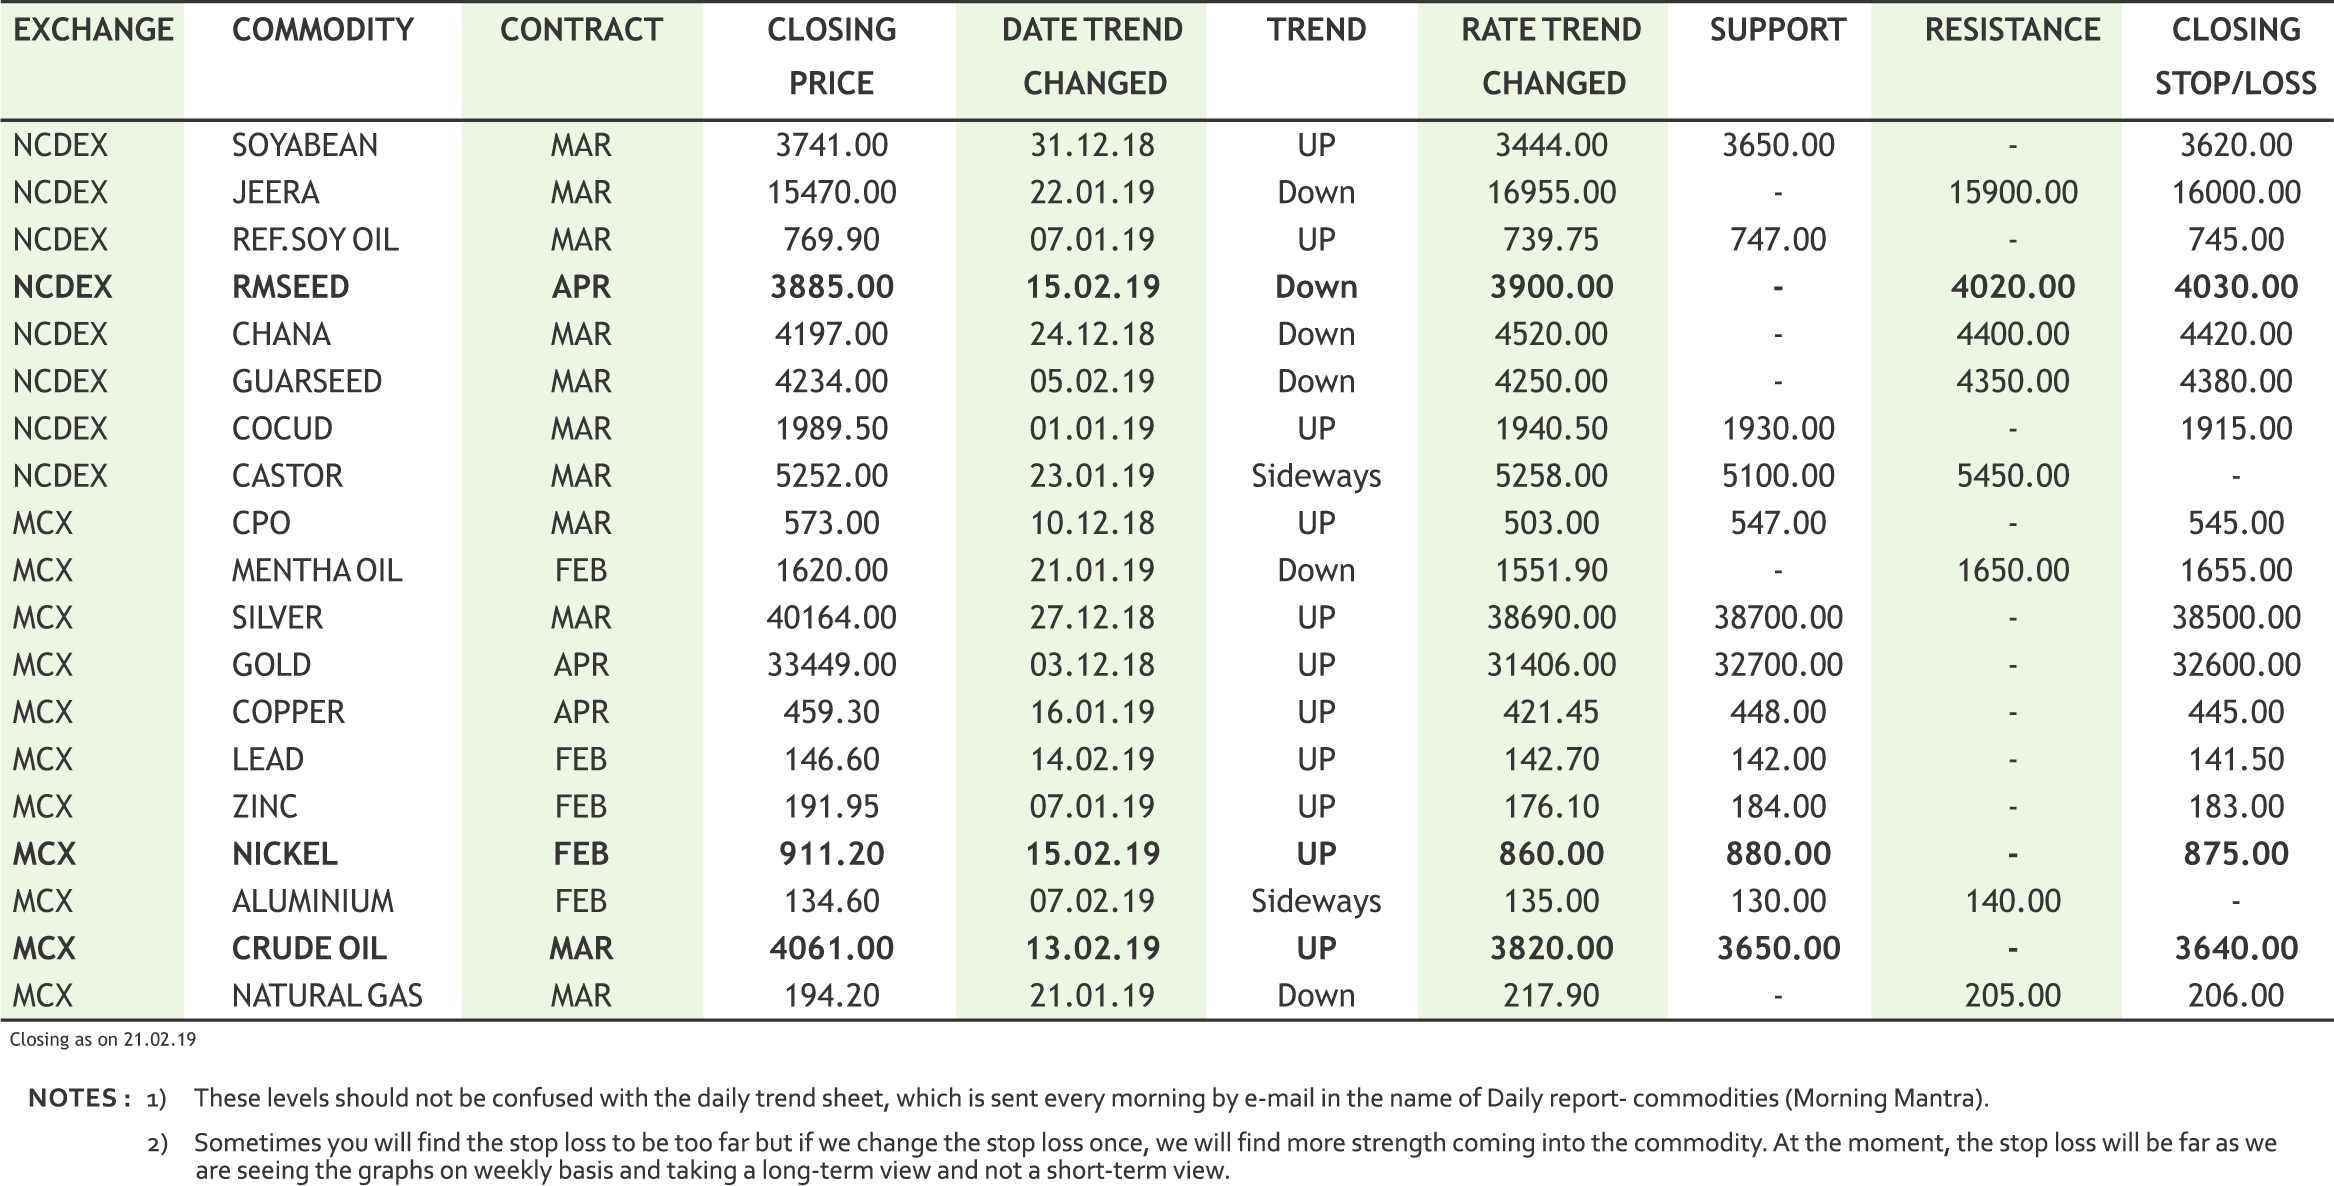
1) These levels should not be confused with the daily trend sheet, which is sent every morning by e-mail in the name of "Morning Mantra ".
2) Sometimes you will find the stop loss to be too far but if we change the stop loss once, we will find more strength coming into the stock. At the moment, the stop loss will be far as we are seeing the graphs on weekly basis and taking a long-term view and not a short-term view.
| Meeting Date | Company | Purpose |
|---|---|---|
| 25-Feb-19 | Corporation Bank | Fund Raising |
| 25-Feb-19 | United Bank of India | Fund Raising |
| 25-Feb-19 | JMT Auto | Dividend |
| 26-Feb-19 | Andhra Bank | Fund Raising |
| 26-Feb-19 | Varun Beverages | Financial Results Other business matters |
| 26-Feb-19 | Union Bank of India | Fund Raising |
| 26-Feb-19 | UCO Bank | Fund Raising |
| 26-Feb-19 | Tata Steel | Fund Raising |
| 26-Feb-19 | Sanofi India | Financial Results/Dividend |
| 26-Feb-19 | Punjab National Bank | Fund Raising |
| 26-Feb-19 | Bank of Maharashtra | Fund Raising |
| 26-Feb-19 | Indian Overseas Bank | Fund Raising |
| 26-Feb-19 | HDFC Asset Management Company | Dividend |
| 27-Feb-19 | Merck | Financial Results/Dividend |
| 27-Feb-19 | Rain Industries | Financial Results |
| 28-Feb-19 | Bharti Airtel | Fund Raising/Other business matters |
| 28-Feb-19 | REC | Dividend |
| 1-Mar-19 | ABB India | Financial Results/Dividend |
| Ex-Date | Company | Purpose |
|---|---|---|
| 25-Feb-19 | Triveni Eng. & Ind. | Interim Dividend - Re 0.70 Per Share |
| 26-Feb-19 | Banco Products (I) | Interim Dividend - Rs 5 Per Share |
| 26-Feb-19 | Advani Hotels & Resorts | Interim Dividend - Re 0.60 Per Share |
| 27-Feb-19 | Ambuja Cements | Dividend - Rs 1.50 Per Share |
| 28-Feb-19 | ONGC | Interim Dividend - Rs 5.25 Per Sh |
| 28-Feb-19 | IDFC First Bank | Interest Payment |
| 5-Mar-19 | Tech Mahindra | Buy Back |
| 5-Mar-19 | ACC | Dividend - Rs 14 Per Share |
| 6-Mar-19 | HDFC AMC | Interim Dividend |
| 7-Mar-19 | Standard Chartered PLC | Dividend |
| 8-Mar-19 | Vijaya Bank | Scheme Of Amalgamation |
| 8-Mar-19 | Dena Bank | Scheme Of Amalgamation |
4

5
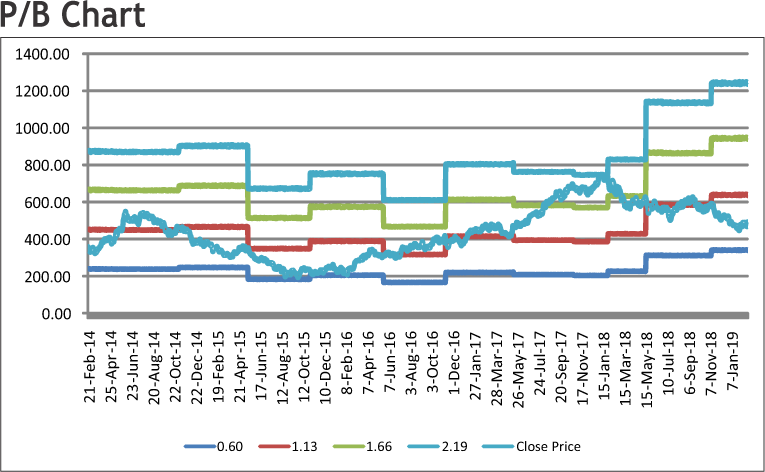
TATA STEEL LIMITED
CMP: 497.90
Target Price: 571
Upside: 15%
| Face Value (Rs.) | 10.00 |
| 52 Week High/Low | 692.00/442.10 |
| M.Cap (Rs. in Cr.) | 56094.24 |
| EPS (Rs.) | 54.32 |
| P/E Ratio (times) | 0.88 |
| P/B Ratio (times) | 2.04 |
| Stock Exchange | BSE |
Investment Rationale
• Tata Steel continued to increase its market share in chosen segments. Automotive segment sales increased by 24%YoY; Industrial Products and Projects segment sales grew by 29%YoY. Branded products, Retail & Solutions segment sales grew by 16%YoY; Tata Steel now touches 3 million retail customers.
• Consolidated volumes were at 7.0 million tonne (mt ) up by 5% YoY with inventory accumulation of 250- 300 thousand tonne at standalone operations. However, the company is hopeful that this will be liquidated through higher sales in Q4FY19.
• Tata Steel BSL integration is progressing smoothly and the focus continues to be on ramping up production and realizing synergies. Tata Steel BSL EBITDA for the quarter was Rs.1,008 crore and the EBITDA margin was 20.6%. Moreover, Usha Martin slump sale transaction and restructuring of TSE (Tata Steel Europe) & SEA (South East Asia) operations expected to be completed in Q4FY19 and Q1FY20, respectively.
• Tata Steel and thyssenkrupp AG are working together to secure the required regulatory approvals for the proposed 50:50 joint venture in Europe. The European Commission Phase II merger control review is currently underway. Both Tata Steel and thyssenkrupp have announced the executive leadership of the planned joint venture.
• Its consolidated gross debt has declined by Rs.9,083 crores during the quarter including de-leveraging of over Rs.6,000 crores. Consolidated net debt stood at Rs 101000 crore. The company is targeting debt reduction of US$ 1 billion over the next 12 months through internal cash generation. The completion of the European JV would further reduce net debt by Rs 20000 crore, while divestment of SEA (South-East
Asia) assets to the HBIS Group would lead to net debt reduction of US$ 500 million.
Risk
• Fluctuation in Commodity prices
• Regulatory risk
Valuation
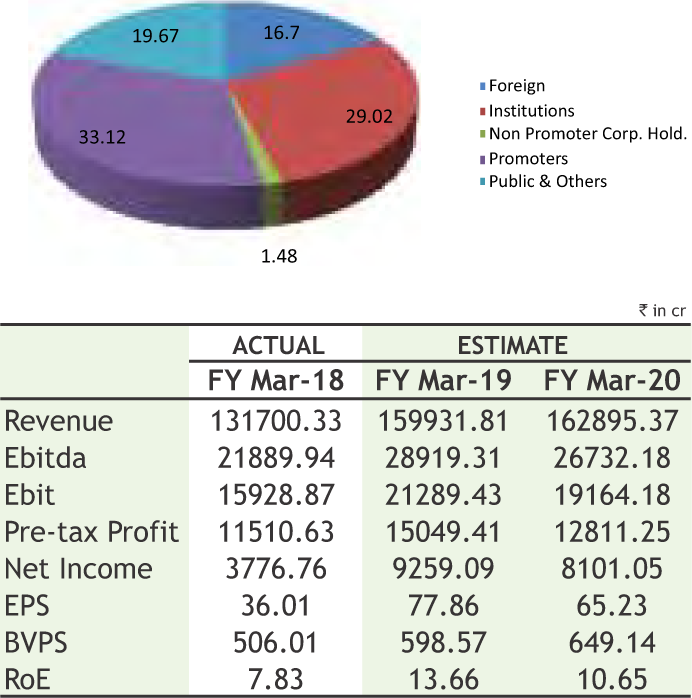
The management of the company expects the demand for steel products to be strong in the developing economies and it proposes to utilize it as well as its Group's existing network to meet this increased demand. Moreover, the company plans to ramp up its production to 25 million tonne (mt) per annum by 2025. Tata Steel main Jamshedpur plant has become 11 mt, while the capacity of the plant which has become operational in Kalinganagar (Odisha) is 3 MT.The company is focusing on capacity expansion of its Kalinganagar plant to 8MT. The project will cost the company Rs 23,500 crore and will be completed within 48 months. Thus, it is expected that the stock will see a price target of Rs.571 in 8 to 10 months time frame on current P/BVx of 0.88x and FY20 BVPS of Rs.649.14.
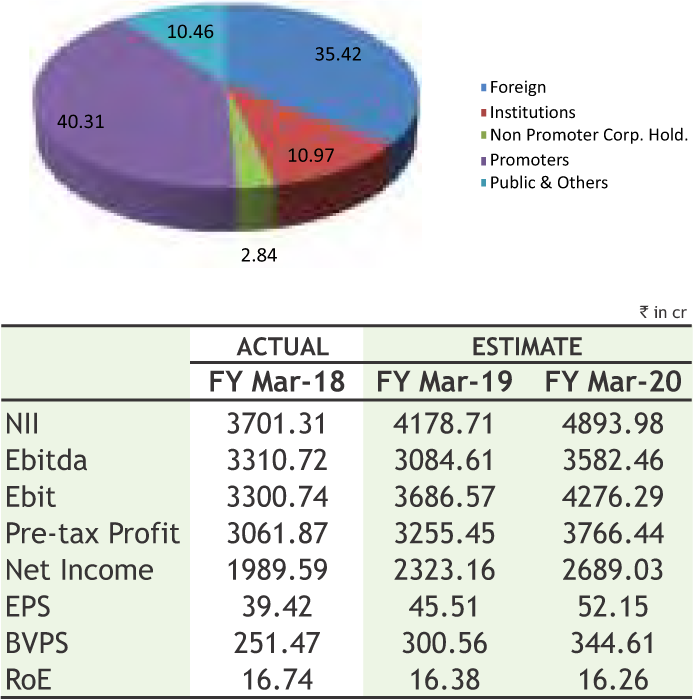
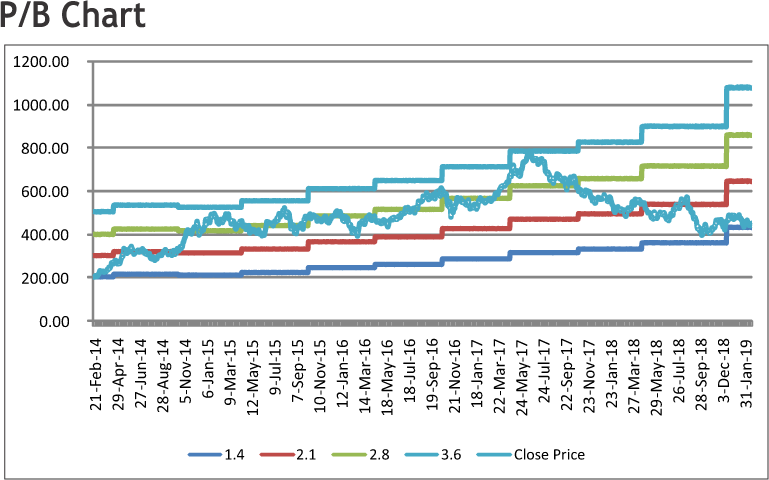
LIC HOUSING FINANCE LIMITED
CMP: 463.95
Target Price: 531
Upside: 14%
| Face Value (Rs.) | 2.00 |
| 52 Week High/Low | 583.20/387.60 |
| M.Cap (Rs. in Cr.) | 23413.24 |
| EPS (Rs.) | 45.12 |
| P/E Ratio (times) | 10.28 |
| P/B Ratio (times) | 1.54 |
| Stock Exchange | BSE |
Investment Rationale
• LIC Housing Finance Ltd is one of the largest housing finance companies in India having one of the widest networks of offices across the country and representative offices at Dubai & Kuwait. In addition, the Company also distributes its products through branches of its subsidiary LICHFL Financial Services Ltd.
• The company was selective in disbursements in the current atmosphere. Total disbursement during the quarter Rs. 12778 crs as against Rs. 12293 crs for the same period in previous year. During the quarter, disbursements in the individual home loan category was Rs. 9170 crore as compared to Rs 8935 crore. The disbursements in developer loan segment was Rs 1238 crore as against Rs 970 crore for Q3 FY18, a growth of 28%.
• Net interest income (NII) was Rs 1042 crores, as against Rs 737 cr for the same period last year. Net Interest Margins (NIM) for the Q3 FY19 stood at 2.33% as against 2.35% for Q2 FY19.
• Net Non-performing asset (NPA) stood at 0.85% as on December 31, 2018 as against 0.49 % as on December 31, 2017. Total provision including general provision on standard loans is Rs 1491 crores as on December 31, 2018 against Gross NPAs of Rs 2290 crores on the same date.
• Net Non-performing asset (NPA) stood at 0.85% as on December 31, 2018 as against 0.49 % as on December 31, 2017. Total provision including general provision on standard loans is Rs 1491 crores as on December 31, 2018 against Gross NPAs of Rs 2290 crores on the same date.
31, 2018 as against Rs 6189 cr as on December 31, 2017, a growth of 84%. Total outstanding portfolio grew at 16% from Rs. 156176 cr to Rs. 181698 cr.
Risk
• Interest Rate Risk
• Liquidity risk
Valuation
It has registered stable numbers across all areas of business in Q3 FY19 which has been in a challenging and turbulent environment. The company looks forward to maintaining this growth journey with a focus on healthy asset quality, cost improvement and better market presence across India. With the positive push by the government, housing finance is being perceived as the most lucrative sector in the current times. Thus, it is expected that the stock will see a price target of Rs. 531 in 8 to 10 months time frame on a current P/Bvx 1.54 and FY20 (BVPS) of Rs.344.61.
Source: Company Website Reuters Capitaline
Above calls are recommended with a time horizon of 8 to 10 months.
6

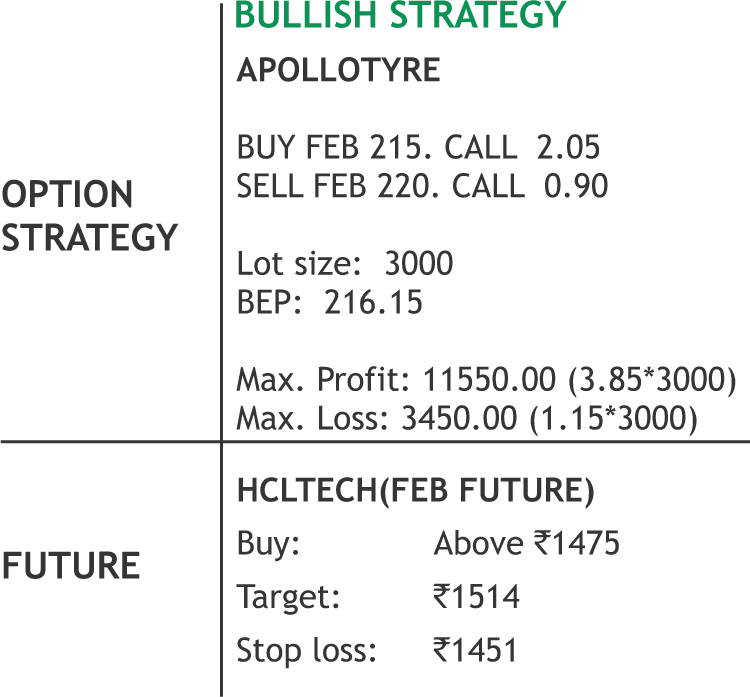
The stock closed at Rs 1487.90 on 22nd February, 2019. It made a 52-week low of Rs 1125.75 on 23rd October 2018 and a 52-week high of Rs. 1698.70 on 19th December 2018. The 200 days Exponential Moving Average (DEMA) of the stock on the daily chart is currently at Rs 1433.40
Stock has been hovering around its 200 days exponential moving average on daily charts, along with consistent buying at lower levels. At current juncture stock has formed a “Cup and Handle” pattern, which is bullish in nature. Alongside, the positive divergence on secondary indicators also pointing towards more upside in prices moving forward. Therefore, one can buy the stock in the range of 1480-1490 levels for the upside target of 1630-1640 levels with SL below 1400.
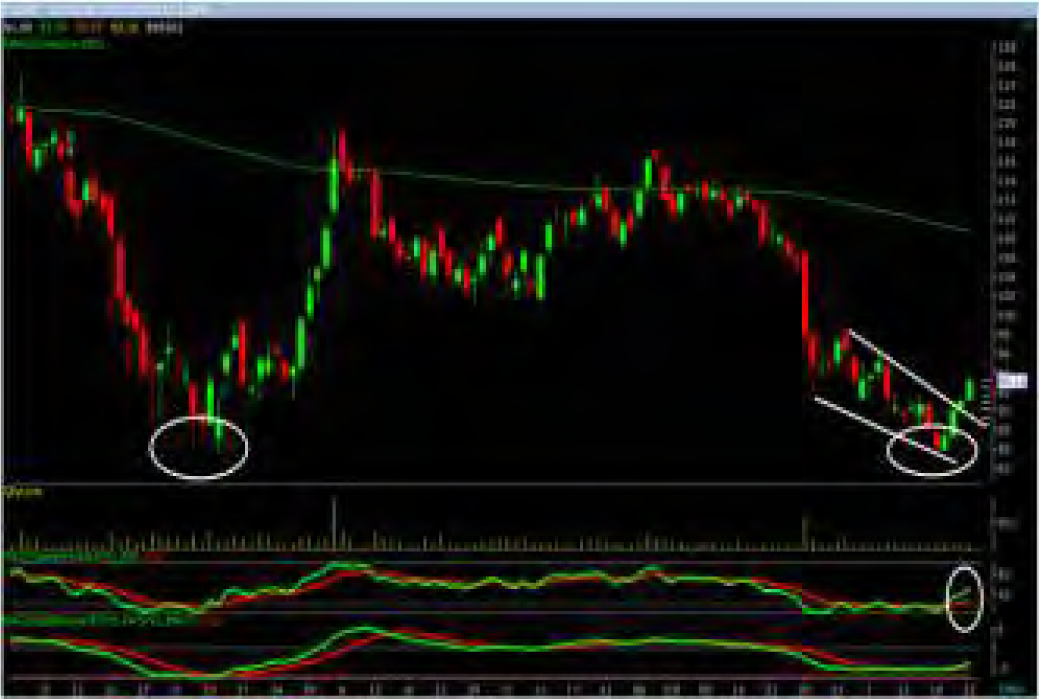
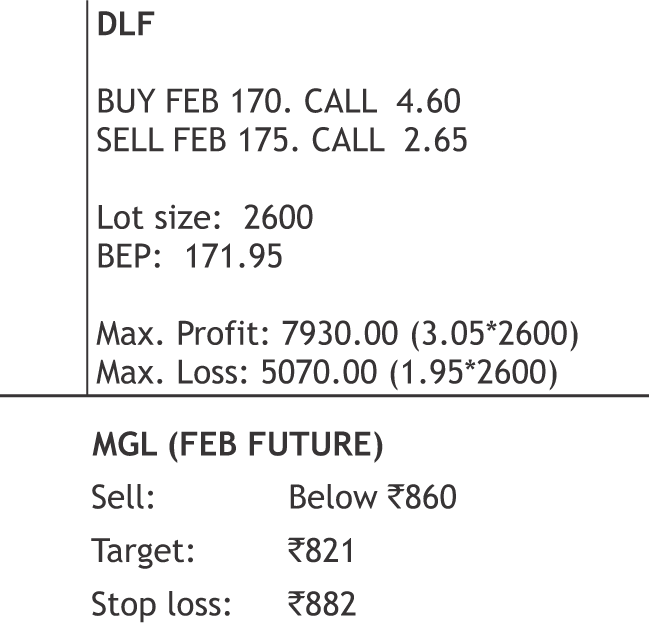
The stock closed at Rs 93.10 on 22nd February, 2019. It made a 52-week low at Rs 85.50 on 11th Oct 2018 and a 52-week high of Rs. 137.60 on 09th May 2018. The 200 days Exponential Moving Average (DEMA) of the stock on the daily chart is currently at Rs 108.71
On broader interval stock made a “DOUBLE BOTTOM” pattern on daily charts and bounce back sharply. Additionally stock has also given a breakout above the “Falling Wedge” pattern visible on daily charts. The sharp recovery in prices from lower levels after a breakout; along with positive divergence on secondary oscillators can get extended in coming sessions as well. Therefore, one can buy the stock in range of 92-93 levels for the upside target of 100-102 levels with SL below 87.
Disclaimer : The analyst and its affiliates companies make no representation or warranty in relation to the accuracy, completeness or reliability of the information contained in its research. The analysis contained in the analyst research is based on numerous assumptions. Different assumptions could result in materially different results.
The analyst not any of its affiliated companies not any of their, members, directors, employees or agents accepts any liability for any loss or damage arising out of the use of all or any part of the analysis research.
SOURCE: CAPITAL LINE
Charts by Spider Software India Ltd
Above calls are recommended with a time horizon of 1-2 months
7
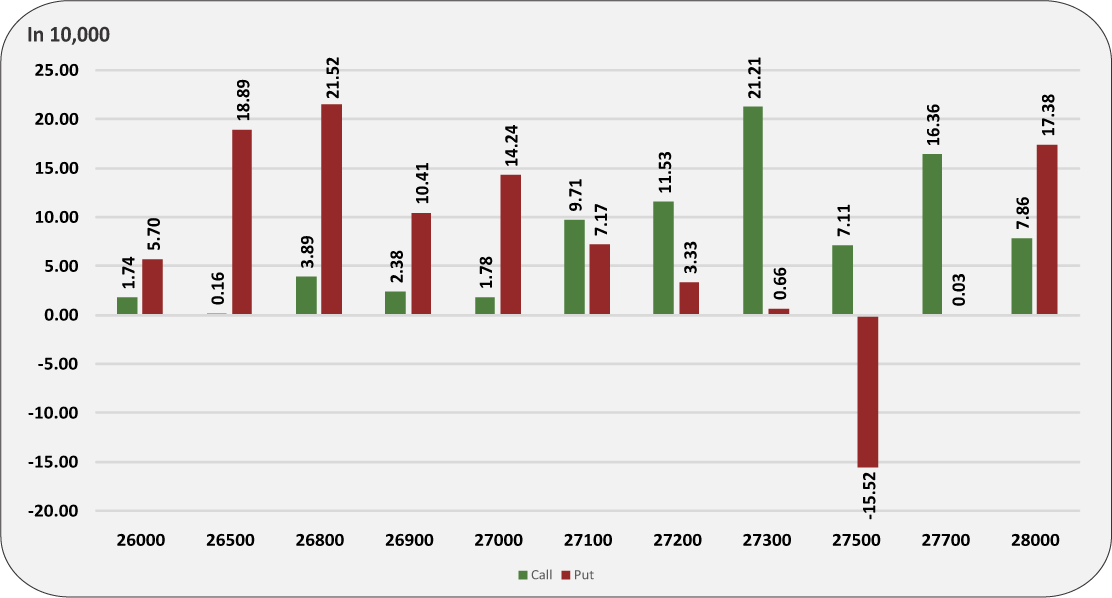
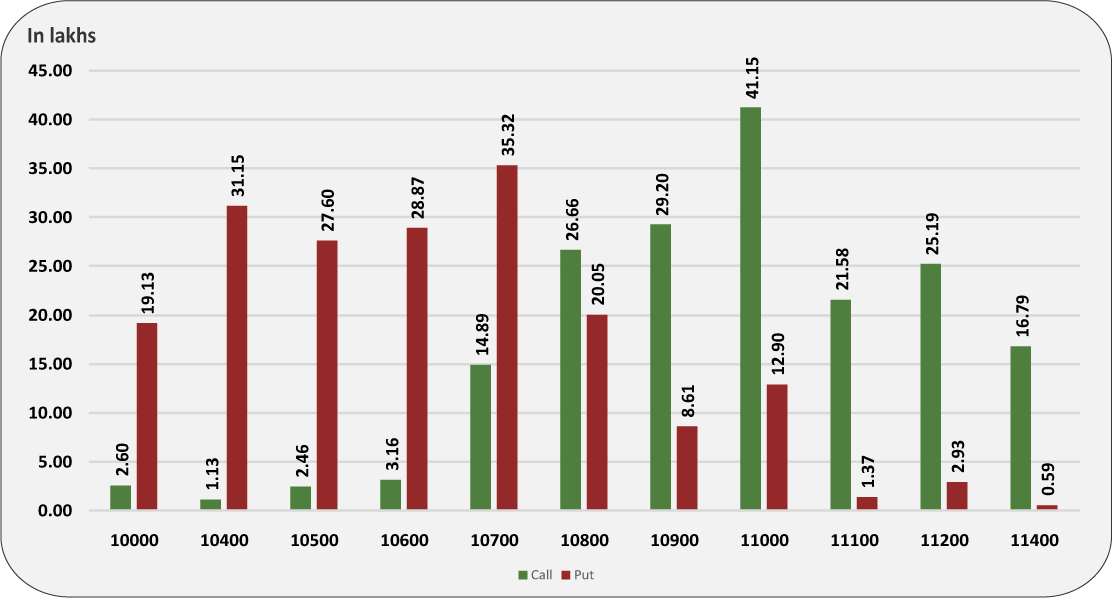
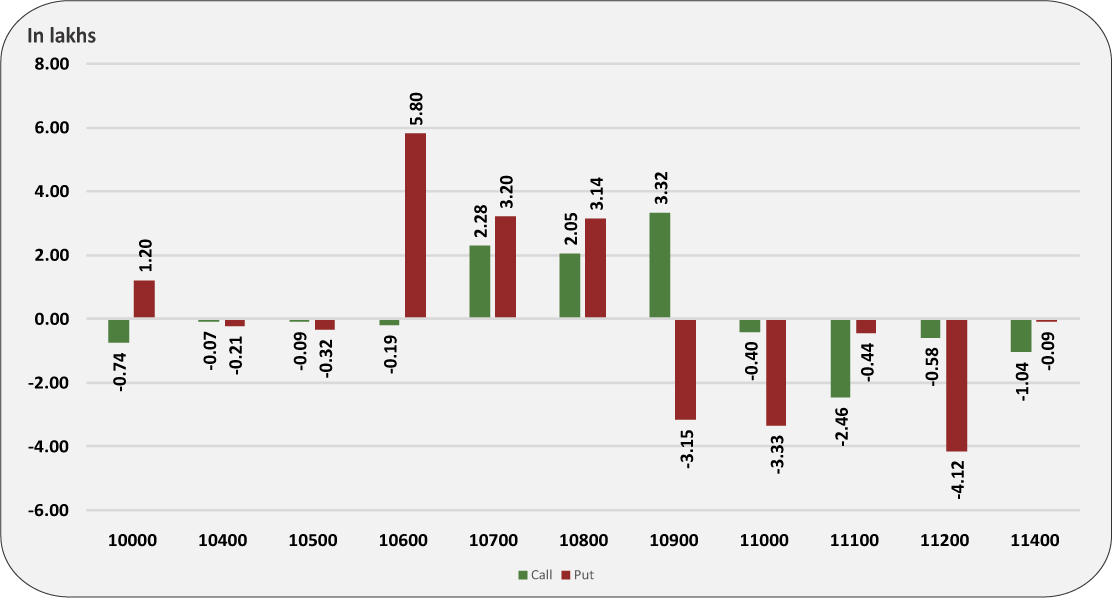
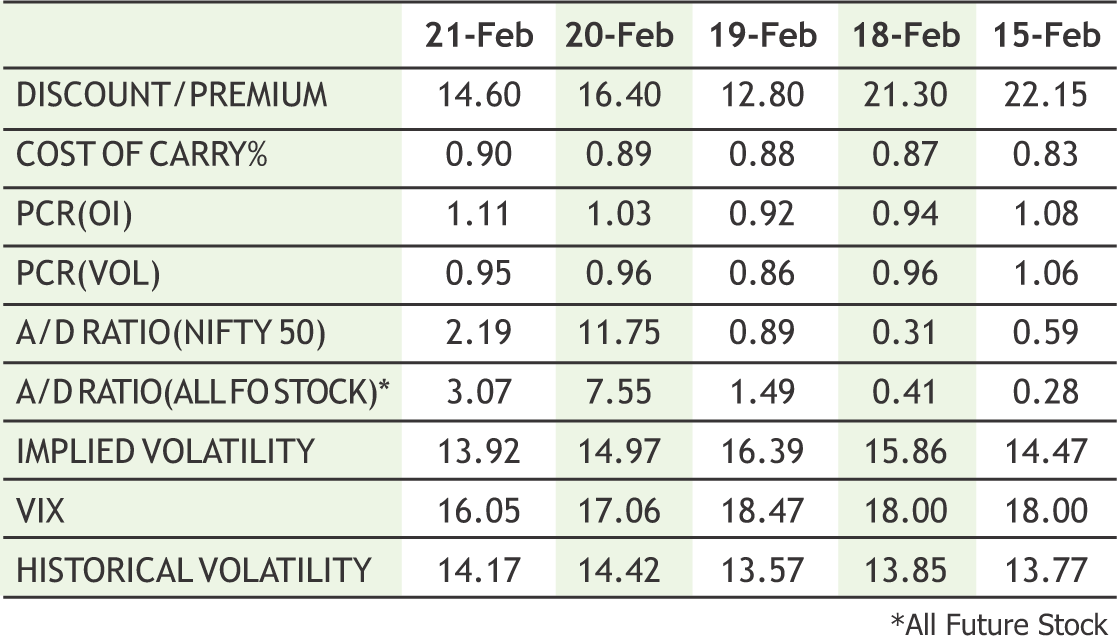
Smart recovery was seen led by short covering from lower levels. Calls writers covered their short positions and put writers were actively selling puts. Derivative data has turned positive. Maximum put open interest is buildup of more than 35 lakh shares at 10700 puts which should act as strong support zone. Nifty is most likely to trade in the range of 10700 to 10900 with positive bias in the expiry week. Nifty has support at lower levels. Various supports are 10750 & 10700 spot levels. Implied Volatility (IV) of calls was down and closed at 13.92% while that for put options closed at 13.55%. The Nifty VIX for the week closed at 16.05% and is expected to remain sideways. The PCR OI for the week closed at 1.11 indicating put writing in recent rally. Put writing was seen in 10700, 10600 strike puts. On the technical front, 10700-10720 spot levels is strong support zone and current bounce is likely to continue towards 10900-10920 levels.
8
|
|

|

|
**The highest call open interest acts as resistance and highest put open interest acts as support.
# Price rise with rise in open interest suggests long buildup | Price fall with rise in open interest suggests short buildup
# Price fall with fall in open interest suggests long unwinding | Price rise with fall in open interest suggests short covering
9
Turmeric futures (Apr) is expected to break the previous contract low of 6182 & descend to test 6100 levels. At the spot markets, the prices of various varieties of turmeric are witnessing a decreasing trend due to increase in the arrivals from fresh harvested crop. At the Regulated Marketing Committee and Erode Cooperative Marketing Society, the prices of old finger and root turmeric is going down day by day price due to quality issue. On the supply side, the crop is good in most parts of the country except Maharashtra. Drought in some parts of Maharashtra will impact production. Earlier, it was reported that the new crop will be higher by 20 %, but initial estimates show that that it would be more or less similar to last year’s production. The downtrend is likely to continue in jeera futures (Mar) as it can witness 15000 levels. This season, favourable weather expected to drive good output despite reduction in sowing area. Last week, the weather had turned cloudy, with unseasonal showers, caused concerns about possible crop damage. However the loss is not significant and will not impact the overall crop provided the weather remains favourable in February. Coriander futures (Apr) is likely to witness consolidation in the range of 6100-6400 levels. The upside may remain capped due to sluggish demand for the new crop, as heavy rainfall in Rajasthan last week resulted in higher moisture content. It is reported that the arrivals have dropped 65% so far this year as compared to the same period last year. New crops with moisture content were sold at Rs.4200 to Rs.4600 per quintal at major markets in Madhya Pradesh.
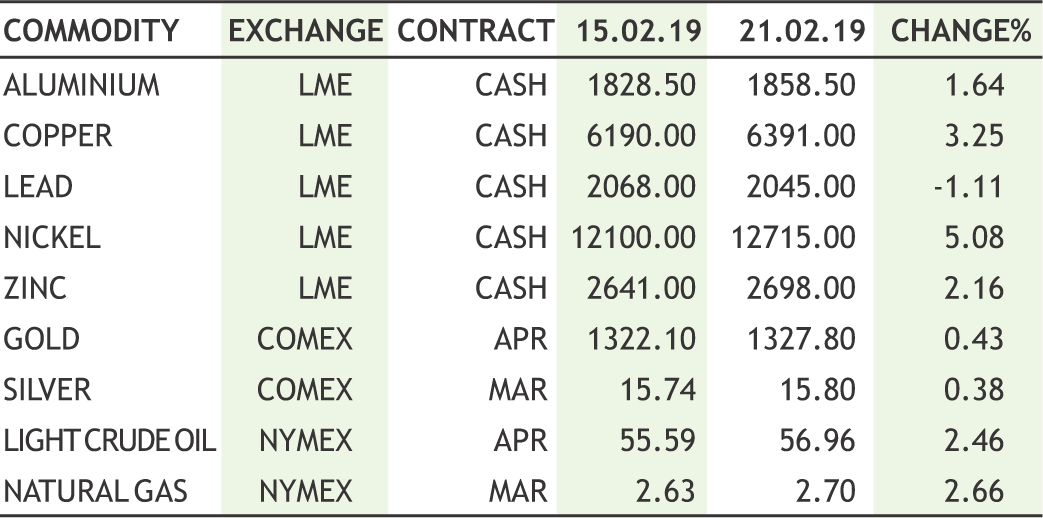
Bullion counter may witness further profit booking at higher levels as the latest FOMC minutes showed that some fed officials were unsure regarding further interest rate hike in US. Federal Reserve officials widely favored ending the runoff of the central bank’s balance sheet this year while expressing uncertainty over whether they would raise interest rates again in 2019, minutes of their January meeting showed. Gold can test 33000 levels while facing resistance near 33800 levels while silver can take key support near 39700 levels while facing resistance near 40450 levels. Top U.S. and Chinese trade negotiators resumed high-level talks last week to hash out a deal that could end their trade war, just over a week before a U.S.-imposed deadline to reach agreement expires and triggers a new round of tariffs. U.S. President Donald Trump and North Korean leader Kim Jong Un will hold their second summit in the Vietnamese capital of Hanoi on Feb. 27-28.Meanwhile uncertainty regarding Brexit concerns will keep the investors jittery. Britain and the European Union played down the chances of clinching an immediate Brexit divorce deal but diplomats stated that they were edging closer to a legal compromise that Prime Minister Theresa May hopes will win over the British parliament. Meanwhile strong demand from China continue to support the yellow metal after the World Gold Council reported robust demand in 2018, despite dismal demand in the last three months of the year. In its 2018 full-year Gold Demand Trends report, the Chinese jewelry remand hit a threeyear high last year of 672.5 tonnes, an increase of 3% from 2017.
Bullion counter may witness further profit booking at higher levels as the latest FOMC minutes showed that some fed officials were unsure regarding further interest rate hike in US. Federal Reserve officials widely favored ending the runoff of the central bank’s balance sheet this year while expressing uncertainty over whether they would raise interest rates again in 2019, minutes of their January meeting showed. Gold can test 33000 levels while facing resistance near 33800 levels while silver can take key support near 39700 levels while facing resistance near 40450 levels. Top U.S. and Chinese trade negotiators resumed high-level talks last week to hash out a deal that could end their trade war, just over a week before a U.S.-imposed deadline to reach agreement expires and triggers a new round of tariffs. U.S. President Donald Trump and North Korean leader Kim Jong Un will hold their second summit in the Vietnamese capital of Hanoi on Feb. 27-28.Meanwhile uncertainty regarding Brexit concerns will keep the investors jittery. Britain and the European Union played down the chances of clinching an immediate Brexit divorce deal but diplomats stated that they were edging closer to a legal compromise that Prime Minister Theresa May hopes will win over the British parliament. Meanwhile strong demand from China continue to support the yellow metal after the World Gold Council reported robust demand in 2018, despite dismal demand in the last three months of the year. In its 2018 full-year Gold Demand Trends report, the Chinese jewelry remand hit a threeyear high last year of 672.5 tonnes, an increase of 3% from 2017.
Crude oil prices may continue to remain on upbeat note as oil prices hovered just below 2019 highs recently, bolstered by OPEC-led supply cuts and U.S. sanctions on Venezuela and Iran. Hopes that talks between Washington and Beijing would soon resolve the trade disputes between the world’s biggest economies also supported markets. Prices have been driven up this year by supply cuts led by the Organization of the Petroleum Exporting Countries (OPEC). Crude oil can test 4250 while taking support near 3850. OPEC as well as some non-affiliated producers such as Russia agreed late last year to cut output by 1.2 million barrels per day (bpd) to prevent a large supply overhang from growing. Another price driver has been U.S. sanctions against oil exporters Iran and Venezuela. OPEC as well as some non-affiliated producers such as Russia agreed late last year to cut output by 1.2 million barrels per day (bpd) to prevent a large supply overhang from swelling. Standing against the supply cuts and sanctions is U.S. crude output which soared by more than 2 million bpd in 2018 to a record 11.9 million bpd, thanks to booming shale oil production, which the EIA was expected to keep rising. Natural gas counter may remain sideways with negative bias as it may take support near 180-185 range and can face resistance near 205 levels. U.S. natural gas output was projected to increase to a record 77.9 bcfd in March. That would be up more than 0.8 bcfd over the February forecast and mark the 14th consecutive monthly increase.
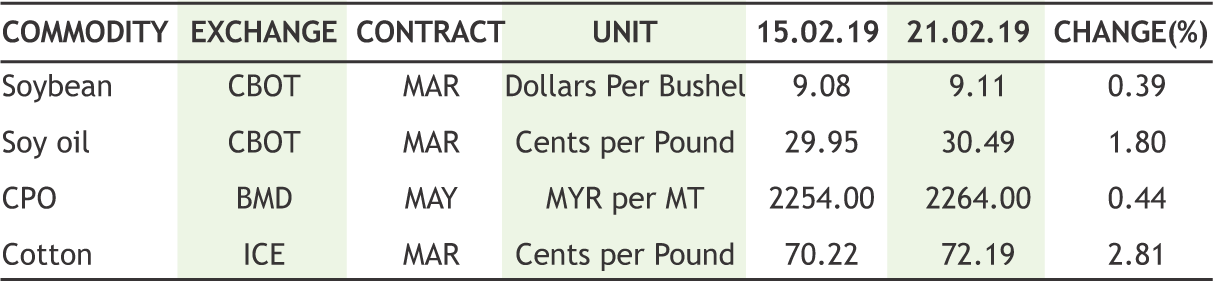
Cotton futures (Mar) is likely to trade sideways trend & hover in the range of 20200-21000 levels with upside getting capped. The fundamentals cite that the imports are subdued as the arrival season is at its peak and there is sufficient supply in the market. For the time being, Indian spinning mills await for clarity on market trend in the wake of uncertainties over the US-China trade talks and currency moves. In the international market, a positive settlement between US-China trade talks resulted in a sharp rally & gave some support to the oversold counter near 70 cents for the time being. Chana futures (Mar) is continuously taking support near 4165 since past 5 weeks & day’s ahead it is expected to remain stable above the said levels. The selling pressure that is being seen is due to NAFED selling the government stock in the states of Madhya Pradesh and Rajasthan. However, amidst the bearish sentiments, the market participants are optimistic on rise in prices owing to the reports that yield of the chana crop in Madhya Pradesh and Rajasthan is likely to take a hit this year due to several incidents of hailstorm, while on the contrary the output is seen falling as acreage in Maharashtra and Karnataka declined sharply due to severe water stress. Mentha oil (Feb) is likely to witness selling & is expected to come down to test 1520-1505 levels. The sowing of the crop has started towards the end of last month, and with couple of weeks passing by the initial estimates are showing up that production of mentha oil is expected to rise to 48,000-50,000 tons in 2019 from 33,000- 35,000 tons last year.
In base metal counter, prices can trade with sideways to positive path as hopes for further government stimulus and optimism regarding US China trade deal to support the prices. Chinese banks extended a record 3.23 trillion yuan ($476.87 billion) in net new yuan loans in January, sharply more than expected, as policymakers try to prevent a sharper economic slowdown in the world's top metals consumer. Copper may find some support near 435 and can recover towards 470. Intense rains at the start of this month in Chile, the world's top copper miner, likely hurt productivity at state-owned miner Codelco's Chuquicamata and Radomiro Tomic mines. Miner and trader Glencore lowered its 2019 copper output forecast to 1.5 million tonnes from 1.54 million tonnes, citing production cuts at its Mutanda mine in the Democratic Republic of Congo. Meanwhile Lead may take support near 142 and can recover towards 150. Aluminium can recover towards 138 taking support near 128. Global primary aluminium output fell to 5.304 million tonnes in January from revised 5.498 million tonnes in December, data from the International Aluminium Institute showed. The Malaysian government stated that it would not extend its moratorium on bauxite mining which ends on March 31 due to strong demand for the ore. Zinc may find support near 185 levels and can recover towards 198 levels. The premium for cash zinc over the three-month LME contract rose to $26.50 as stocks in LME warehouses fell to their lowest since 2017 at 83,250 tonnes. Nickel can also find some support near 860 levels and can recover towards 960 levels.
10
|

CRUDE OIL MCX (MARCH) contract closed at Rs. 4061 on 21st Feb’19. The contract made its high of Rs. 4110 on 21st Feb’19 and a low of Rs. 3090 on 26th Dec’18. The 18-day Exponential Moving Average of the commodity is currently at Rs. 3892.On the daily chart, the commodity has Relative Strength Index (14-day) value of 64.66.
One can buy at Rs. 3950 for a target of Rs. 4400 with the stop loss of Rs. 3650.

COPPER MCX (APRIL) contract closed at Rs. 459.30 on 21st Feb’19. The contract made its high of Rs. 466.25 on 22nd Feb’19 and a low of Rs. 401.90 on 3rd Jan’19. The 18-day Exponential Moving Average of the commodity is currently at Rs. 443.05.On the daily chart, the commodity has Relative Strength Index (14-day) value of 69.58.
One can buy at Rs. 460 for a target of Rs. 490 with the stop loss of Rs. 448.

Chana NCDEX (MAR) contract was closed at Rs. 4197 on 21st Feb’19. The contract made its high of Rs. 4790 on 14th Dec’18 and a low of Rs. 4166 on 31st Jan’19. The 18-day Exponential Moving Average of the commodity is currently at Rs. 4250.On the daily chart, the commodity has Relative Strength Index (14-day) value of 42.07.
One can sell at Rs. 4250 for a target of Rs. 4000 with the stop loss of Rs 4350.
11
• MCX has waived off storage charges for Base Metal inventory deposited at MCXCCL accredited warehouses (MAW) during the first expiry month of the respective Metal contract converted to compulsory delivery settlement mode.
• India's sugar production in 2018-19 season till February 15 is higher by 7.7% over same period of previous year as the total production has hit 21.93 million tonnes. - Indian Sugar Mills Association (ISMA).
• Saudi Aramco, the world's top oil exporter, is in talks on possible investments in Indian projects involving companies including Reliance Industries.
• European Central Bank policymakers took a gloomy view on the euro zone economy at their last policy meeting and asked for swift preparations for giving banks more long-term loans.
• Japan's exports fell 8.4 percent year-on-year in January a bigger decline than the 5.5 percent fall expected by economists.
• Output of cotton in Haryana in 2018-19 (Jul-Jun) is likely to rise 5% on year to 1.7 mln bales (1 bale = 170 kg) because of higher yields, according to the state's second advance estimate.
• The wheat output might cross 100 million tonnes (mt), an all-time-high level. - Indian Council of Agriculture Research (ICAR)
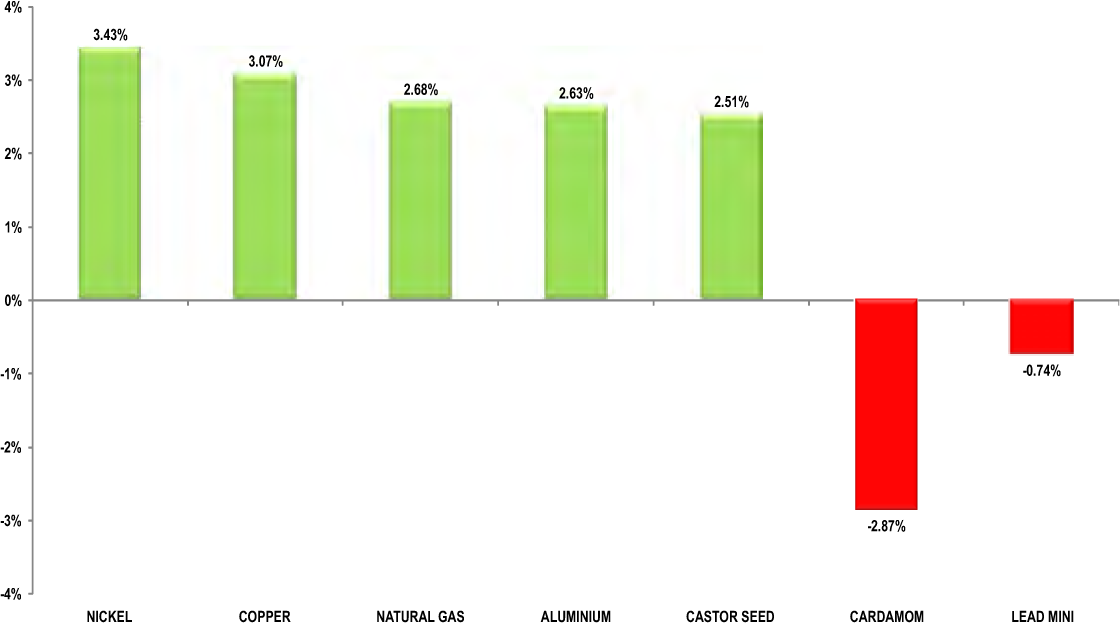
More buying emerged in commodities last week and CRB inched higher for the continuous second week. Oil extended gains from a three-month high on signs that the U.S. and China are moving closer to a trade deal. Crude has rallied about 25 percent this year as the OPEC+ coalition got off to a strong start with their output cuts, led by higher-than-pledged reductions by Saudi Arabia, the world's top oil exporter. Natural gas was consolidating after a steep fall on the colder weather forecast in first fifteen days in March together with dropdown in inventories. The U.S. Energy Information Administration (EIA) reported Thursday morning that U.S. natural gas stockpiles decreased by 177 billion cubic feet for the week ending February 15. Gold slipped from a 10-month peak on Thursday, pressured by signals the U.S. Federal Reserve will not adopt as dovish a stance on monetary policy as previously thought and as investors booked profits. In the minutes of its Jan. 29- 30 meeting, the Fed said the U.S. economy and its labour market remained strong, prompting some expectations of at least one more rate hike this year. Gold made a high of $1350 and gave up its weekly strength and closed sideways though in Indian market it closed in negative territory on appreciation in rupee. Silver followed the footsteps of gold and traded higher near $16.2, in similar fashion it gave up its weekly strength and closed sideways. Some better economic data boosted up the prices of base metals; most of them closed up excluding lead. Dollar index traded weak amid ambiguity in the market regarding Sino-US trade talk; gave further strength to the base metals prices. Copper prices hit a seven month peak overnight as the market worried about low stocks ahead of seasonally strong demand in top consumer China, while rising hopes of an end to the USChina trade dispute also lent support. Lead was down on increasing supply issue. As per the ILZSG, the global lead market is forecasted to remain in surplus in 2019 on account of increasing mine production and falling demand in China.
In agri commodities; chana, guar counter and mentha saw profitbooking from higher levels. Mentha continued to trade down on rise in production concern amid lower export demand. Turmeric traded sharply down on early arrivals of fresh crop in the market. Jeera is too victim of lower export demand despite lower availability in turkey and Syria. Cotton counter traded mix whereas soyabean and R M Seed were down on swelling supply.


|
|
12

|
|
Global scenario of diamond
Major Diamond mines are in Botswana, Zimbabwe, Namibia, South Africa, Angola, Russia, Canada and Australia. Major cutting and Polishing countries of Diamonds are Belgium, Israel, USA, India and China. Important centres of diamond cutting and trading are Surat (India), Antwerp (Belgium), London (UK), New York (USA), Tel Aviv (Israel), Amsterdam (Netherlands). More than 50% of the world’s production of rough, polished and industrial diamond passes through Antwerp. USA, Japan, China, Gulf region and India constitutes approximately 70% of Diamond Jewellery sales. Total diamond production in 2018 is expected to fall slightly from 2017 levels, due largely to Alrosa’s suspension of operations at the Mir mine and Rio Tinto’s guided fall in production at its operations.
Indian scenario of diamond
Production or mining of rough diamond in India is negligible. But India is the world’s largest cutting and polishing centre for diamonds where 14 out of every 15 rough diamonds in the world are polished. Surat is the major centre for cutting, polishing and processing of rough diamonds. It contributes more than 85% of diamonds trading in India.
India is the world's third largest diamond consumer with 8% market share. India ranks first with 16.7 % market share in total export of diamond. India exports 95 per cent of total imported rough diamond the world’s diamonds, as per statistics from the Gems and Jewellery Export promotion Council (GJEPC).
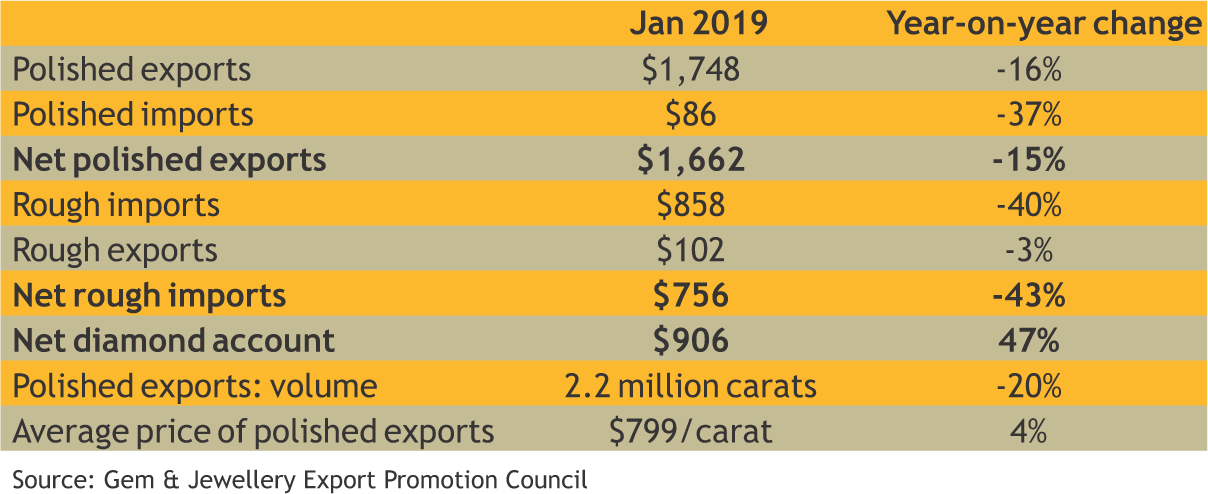
India Trade Data for January 2019
|
• India’s polished-diamond exports dropped 16% to $1.75 billion in January, continuing their recent weakness. A slide in the volume of shipments outweighed a higher average price, according to the Gem & Jewellery Export Promotion Council (GJEPC). Rough imports also plunged, mirroring a similar trend in the Belgian market in January as demand from manufacturers slowed.
Latest update
• Russian diamond producer Alrosa this month sold 92 rough diamonds of a special size (more than 10.8 carats) weighing 1,570 carats in total at an auction in Israel. It was Alrosa’s first auction of 2019. The total sales revenue was $9.6 million.
• Belgium’s shipments of rough and polished slid in January amid a slowdown in the global industry. A 10% drop in the volume of polished exports outweighed growth in the average price, with the total value down 4% for the month, according to data the Antwerp World Diamond Centre.
13

|
| 18th FEB | RBI board to decide on paying interim dividend to government. |
| 19th FEB | RBI board okays Rs 28000 cr as interim dividend to govt. |
| 19th FEB | BoE would pump in emergency money after no-deal Brexit, says minister. |
| 20th FEB | ECB to discuss new round of loans to banks soon, says Praet. |
| 20th FEB | Trump threatened tariffs on European cars if no EU trade deal. |
| 21st FEB | Global sovereign debt to jump to $50 trillion, as per S&P Global. |
| 21st FEB | RBI's Panel member said interest rates could fall by more than 0.5%. |
| 21st FEB | J.P. Morgan cuts U.S. first-quarter GDP growth view to 1.5 percent. |
The reversal in monetary policy stance across global central bank leads to low volatility in FX space. Admittedly this change cannot be destined to slow growth, in-fact the global markets are witnessing a gradual transition in inflation trends. This week was packed with MPC meeting minutes from RBI, RBA,ECB and FOMC and every leading central bankers are reluctant to remain biased towards tightening policy tools. As far as RBI is concerned, most of the members are pro to ease of policy by more than 25 bps amid de-risk in food inflation. Indian Rupee this week was moderately drifted lower helped by weekly bond purchases program by RBI and report from Ministry of Finance – PDMC (Public Debt Management Cell ) that they had discussed the prospects of issuing sovereign bonds overseas which in-turns lead to some thought to follow-up in next financial year. Meanwhile, the threat of high energy prices still persists for Indian economy as the benign domestic inflation can reverse its direction to push RBI in a hawkish zone. In January, Indian oil demand headed north to 4.62 mb/d, a 0.28 mb/d rise on YoY basis, though demand was boosted by rate cut. Expect USDINR to stay in the tight range of 70.80 to 71.60.

|

USD/INR (MAR) contract closed at 71.49 on 21st Feb’ 19. The contract made its high of 71.8350 on 18th Feb’19 and a low of 71.19 on 21st Feb’ 18 (Weekly Basis). The 14-day Exponential Moving Average of the USD/INR is currently at 71.53
On the daily chart, the USD/INR has Relative Strength Index (14-day) value of 49.05. One can buy at 71.15 for the target of 71.75 with the stop loss of 70.85.

EUR/INR (MAR) contract closed at 81.2950 on 21st Feb’ 19. The contract made its high of 81.49 on 20th Feb’19 and a low of 80.9925 on 21st Feb’19 (Weekly Basis). The 14-day Exponential Moving Average of the EUR/INR is currently at 81.33
On the daily chart, EUR/INR has Relative Strength Index (14-day) value of 52.07. One can sell at 81.60 for a target of 81 with the stop loss of 81.90.

GBP/INR (MAR) contract closed at 93.50 on 21st Feb’ 19. The contract made its high of 93.68 on 20th Feb’19 and a low of 92.32 on 18th Feb’18 (Weekly Basis). The 14-day Exponential Moving Average of the GBP/INR is currently at 92.81
On the daily chart, GBP/INR has Relative Strength Index (14-day) value of 54.18. One can sell at 93.85 for a target of 93.25 with the stop loss of 94.15.

JPY/INR (MAR) contract closed at 64.6650 on 21st Feb’ 19. The contract made its high of 65.14 on 18th Feb’19 and a low of 64.40 on 21st Feb’19 (Weekly Basis). The 14-day Exponential Moving Average of the JPY/INR is currently at 64.92
On the daily chart, JPY/INR has Relative Strength Index (14-day) value of 49.87. One can sell at 64.85 for a target of 64.25 with the stop loss of 65.15.
14
PNB Metlife IPO likely next fiscal
State-run Punjab National Bank may look at listing its life insurance arm next financial year and is currently in the process of selling its 4 percent of 30 percent stake in PNB Metlife to discover price. The insurance company has been talking about an IPO since 2016 and the issue is necessitated by the American financial services major and its partner Metlife Inc's plans to exit the company. Founded in 2001, PNB Metlife, based in Mumbai, is a joint venture between the state-run bank with a 30 percent shareholding, Metlife owns 26 percent, Elpro 21 percent, M Pallonji & Company 18 percent, and Jammu & Kashmir Bank owns the remaining 5 percent stake.

|
15
|
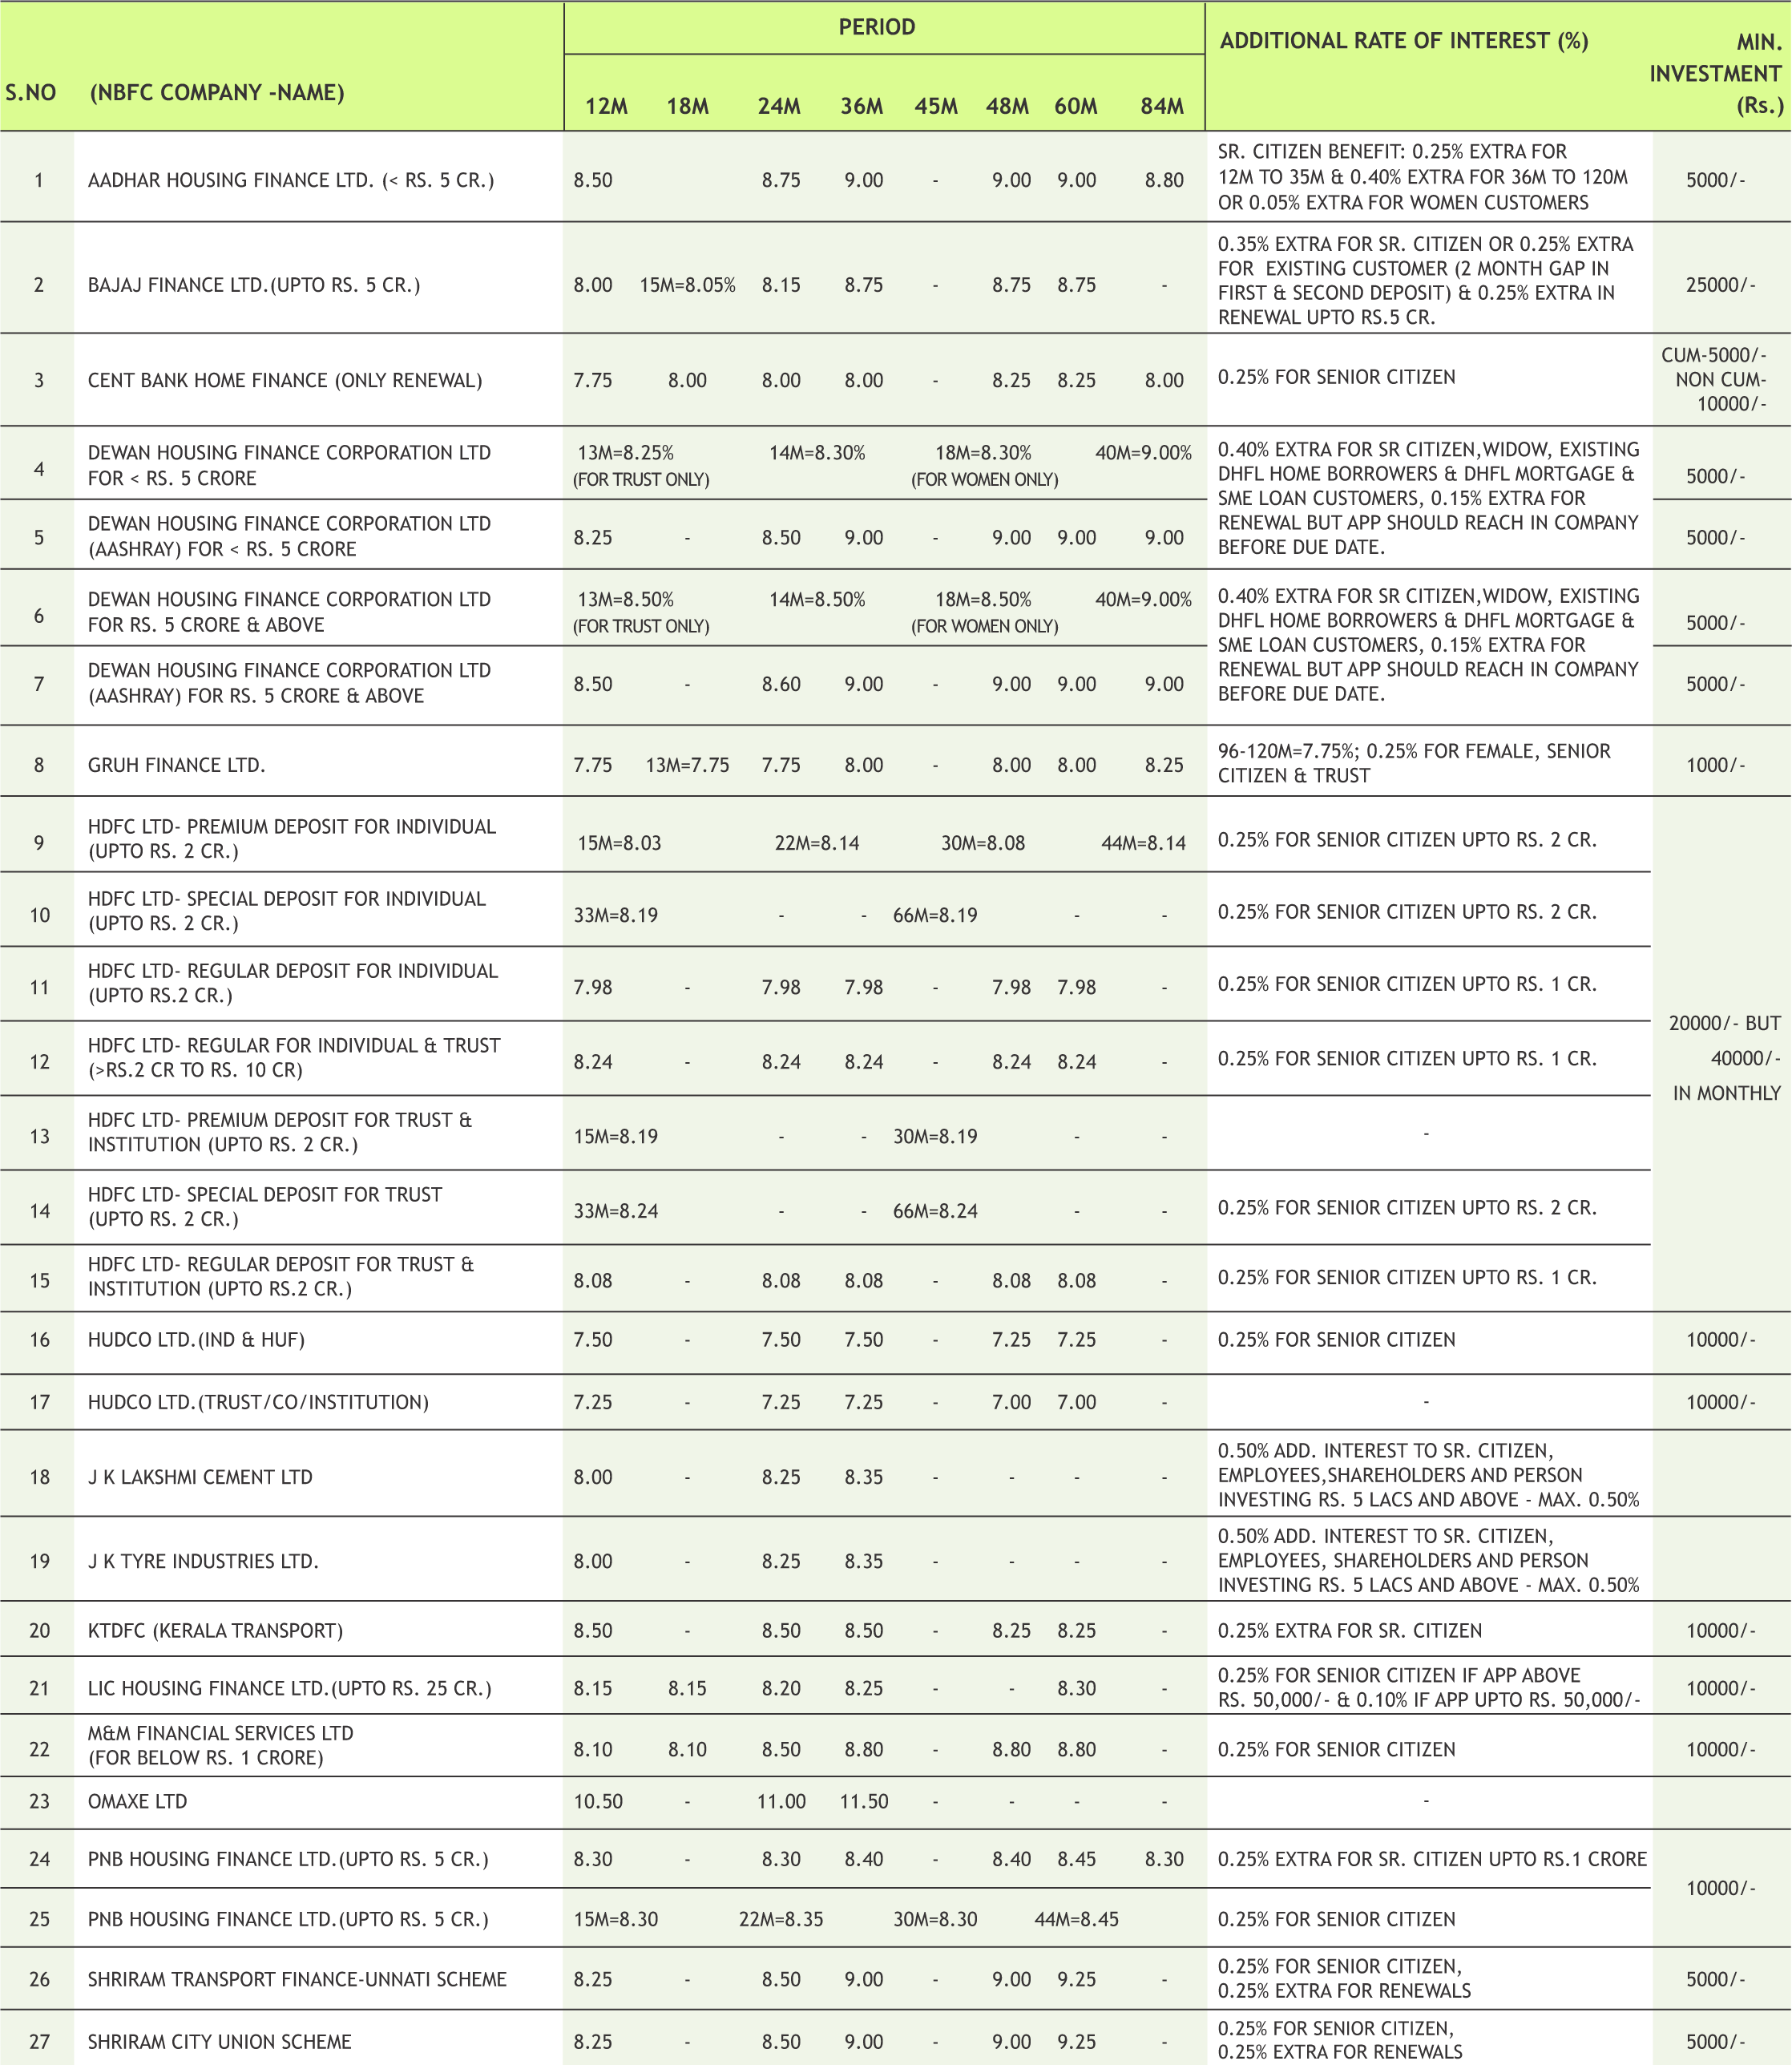
* Interest Rate may be revised by company from time to time. Please confirm Interest rates before submitting the application.
* For Application of Rs.50 Lac & above, Contact to Head Office.
* Email us at fd@smcindiaonline.com

16
Aditya Birla Sun Life Mutual Fund launches retirement scheme; offer closes on March 5
Aditya Birla Sun Life Mutual Fund has launched an open-ended retirement solution oriented scheme having a lock-in of 5 years or till retirement age, whichever is earlier, according to the press release from the fund house. Subscription to Aditya Birla Sun Life Retirement Fund will remain open until March 5. The fund offers four investment options designed as per suitability of various age groups. This includes the 30s plan where 80-100 percent of the corpus will be invested in equity and equity related instruments and the rest in debt and money market instruments. The 40s plan has a flexible equity exposure between 65-80 percent and the 50s plan has a flexible debt exposure in the range of 75-100 percent. In addition to these, there is a 50s Plus Debt Plan for those nearing retirement age, which invests its entire corpus in debt and money market instruments. The fund will be managed by Ajay Garg and Pranay Sinha and has no exit load.
Kotak MF first fund house to file offer document for International REIT Fund
Kotak Mutual Fund has sought the Securities and Exchange Board of India’s approval to launch Kotak International REIT Fund, according to a draft offer document on the SEBI website. If it gets SEBI approval, this will be the first REIT fund to be available to Indian investors. The open-ended fund of fund scheme will invest 95 percent of assets in units of SMAM ASIA REIT Sub Trust fund and /or other similar overseas funds, while the balance will be allocated to debt, money market instruments, or units of liquid schemes, the offer document stated. The underlying fund is an open-ended series trust of SMAM Global Investment Trust, based in the Cayman Islands. The scheme will be benchmarked against FTSE EPRA Nareit Asia Pacific Index, which is designed to track the performance of listed real estate companies and REITS in both developed and emerging markets. The index value would be converted into Indian rupees, using RBI reference rate, the document said.
17

|
|
|
|
|
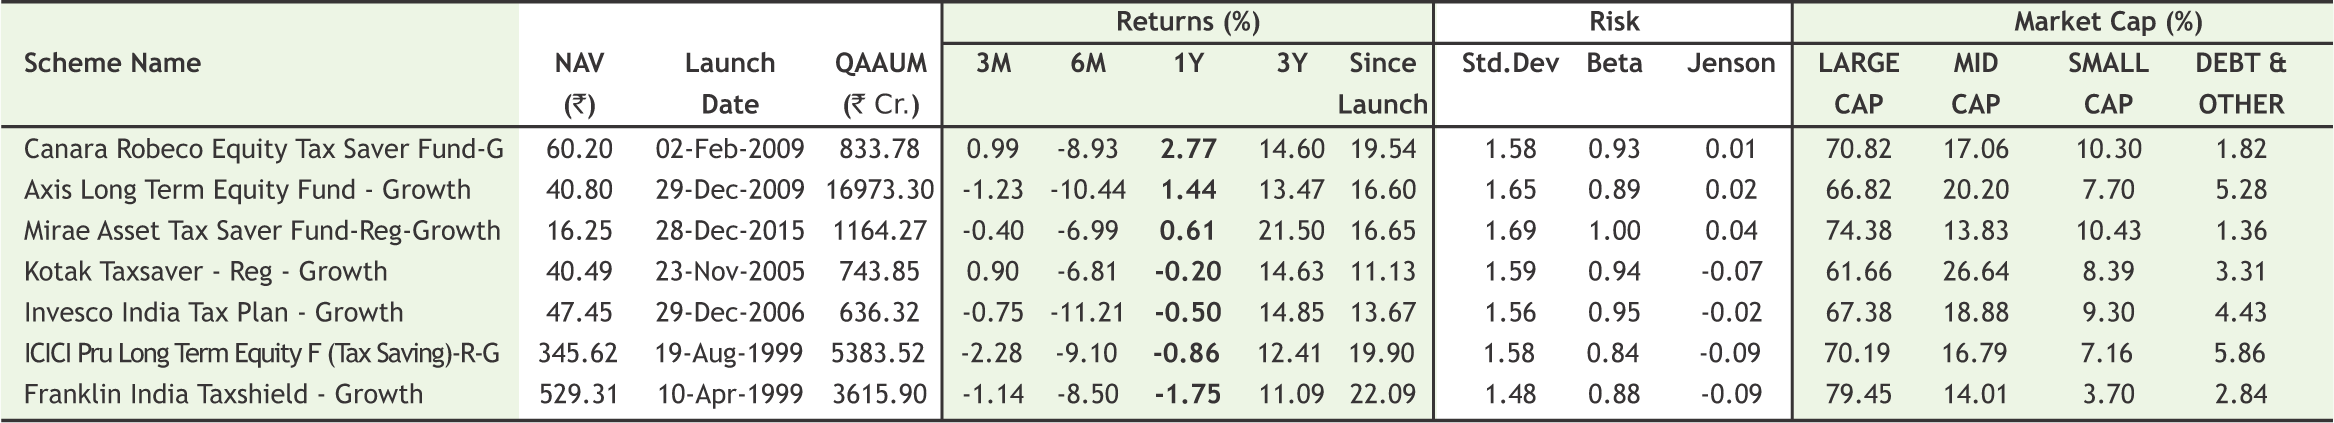
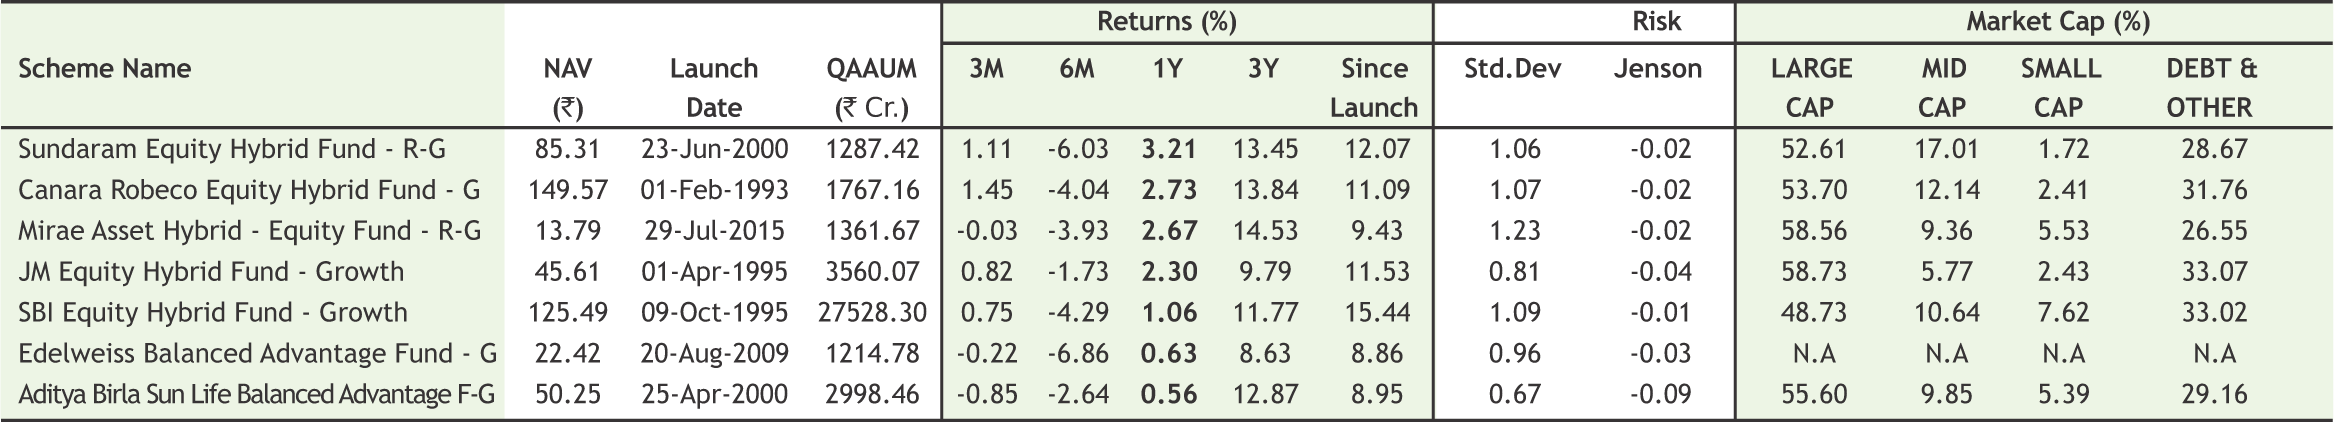
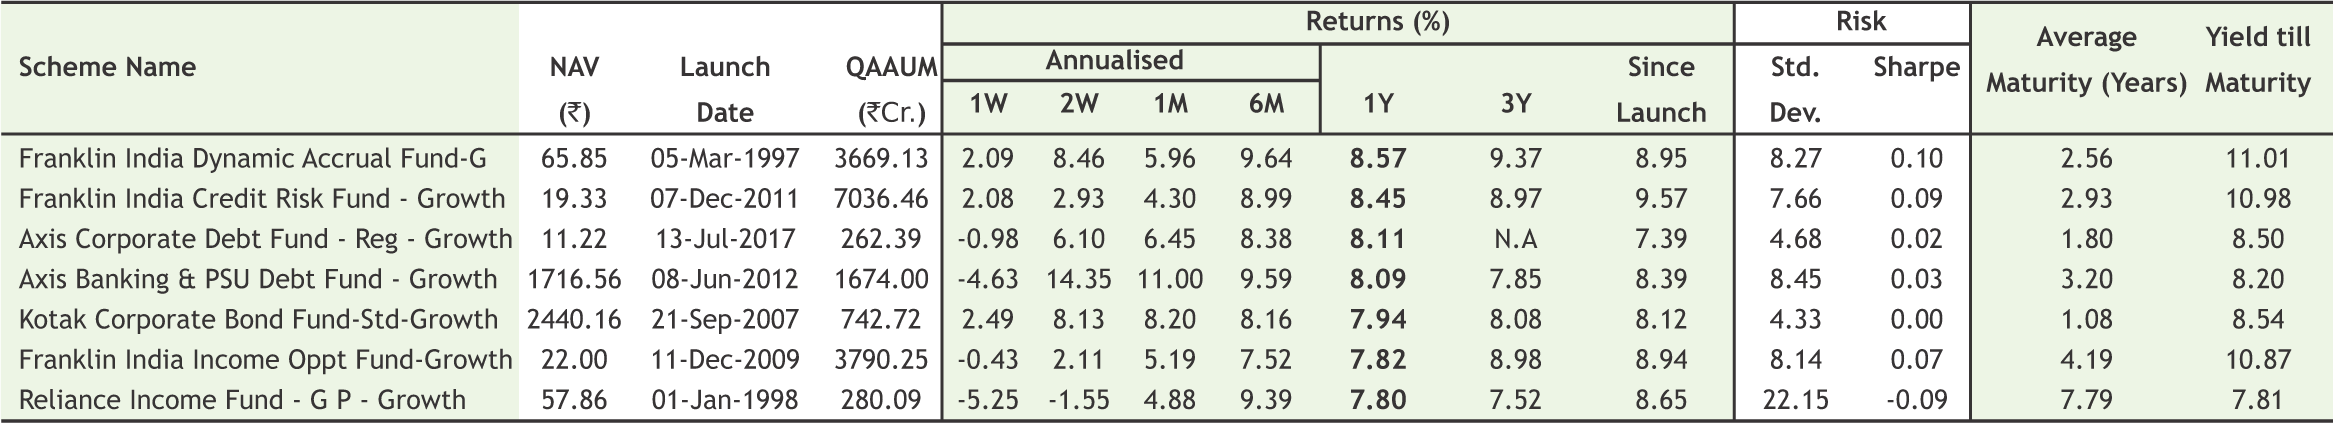
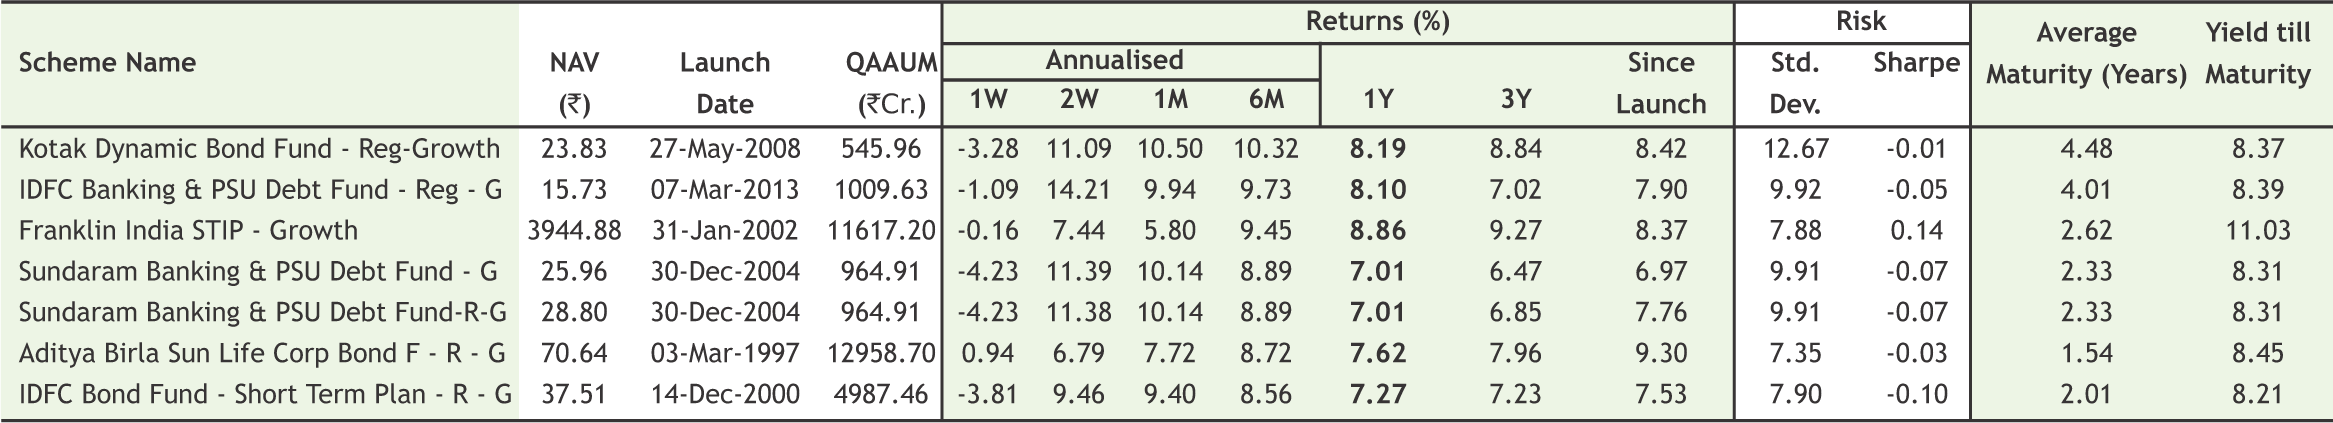
Note:Indicative corpus are including Growth & Dividend option . The above mentioned data is on the basis of 08/08/2019 Beta, Sharpe and Standard Deviation are calculated on the basis of period: 1 year, frequency: Weekly Friday, RF: 7%
*Mutual Fund investments are subject to market risks, read all scheme related documents carefully
17

Mr. Ajay Garg (CEO & Director, SMC Global Securities Ltd), Mr. B. Sanjeev Kumar (Head Online Trading, SMC Global Securities Ltd) and Mr. Uday Prabhakar Powale (Zonal Head, SMC Global Securities Ltd) along with Mr. R K Verma (Executive Director, Union Bank of India), Mr. R K Kashyap (General Manager- Personal Banking & Operations, Union Bank of India) and Mr. Gokulananda Das (Deputy General Manger- Personal Banking & Operations Deptt., Union Bank of India) during Cake Cutting Ceremony of Online Trading tie-up with Union Bank of India held on Monday, 18th February, 2019 at Union Bank of India Head Office, Mumbai.

Mr. S C Aggarwal (CMD, SMC Group), Mr. Mahesh C Gupta (Vice CMD, SMC Group), Mr. Ajay Garg (Director & CEO, SMC Global Securities Ltd), Mrs. Reema Garg (Director & CHRO, SMC Group) and Mr. Pranay Aggarwal (Director, SMC Comtrade Limited) during Cake Cutting Ceremony on the occasion of tie up with Union Bank of India held on Thursday, 21st February, 2019 at SMC Head Office, New Delhi.


REGISTERED OFFICES:
11 / 6B, Shanti Chamber, Pusa Road, New Delhi 110005. Tel: 91-11-30111000, Fax: 91-11-25754365
MUMBAI OFFICE:
Lotus Corporate Park, A Wing 401 / 402 , 4th Floor , Graham Firth Steel Compound, Off Western Express Highway, Jay Coach Signal, Goreagon (East) Mumbai - 400063
Tel: 91-22-67341600, Fax: 91-22-67341697
KOLKATA OFFICE:
18, Rabindra Sarani, Poddar Court, Gate No-4,5th Floor, Kolkata-700001 Tel.: 033 6612 7000/033 4058 7000, Fax: 033 6612 7004/033 4058 7004
AHMEDABAD OFFICE :
10/A, 4th Floor, Kalapurnam Building, Near Municipal Market, C G Road, Ahmedabad-380009, Gujarat
Tel : 91-79-26424801 - 05, 40049801 - 03
CHENNAI OFFICE:
Salzburg Square, Flat No.1, III rd Floor, Door No.107, Harrington Road, Chetpet, Chennai - 600031.
Tel: 044-39109100, Fax -044- 39109111
SECUNDERABAD OFFICE:
315, 4th Floor Above CMR Exclusive, BhuvanaTower, S D Road, Secunderabad, Telangana-500003
Tel : 040-30031007/8/9
DUBAI OFFICE:
2404, 1 Lake Plaza Tower, Cluster T, Jumeriah Lake Towers, PO Box 117210, Dubai, UAE
Tel: 97145139780 Fax : 97145139781
Email ID : pankaj@smccomex.com
smcdmcc@gmail.com
Printed and Published on behalf of
Mr. Saurabh Jain @ Publication Address
11/6B, Shanti Chamber, Pusa Road, New Delhi-110005
Website: www.smcindiaonline.com
Investor Grievance : igc@smcindiaonline.com
Printed at: S&S MARKETING
102, Mahavirji Complex LSC-3, Rishabh Vihar, New Delhi - 110092 (India) Ph.: +91-11- 43035012, 43035014, Email: ss@sandsmarketing.in