2019: Issue 675, Week: 18th – 22nd March
A Weekly Update from SMC (For private circulation only)
2019: Issue 675, Week: 18th – 22nd March
A Weekly Update from SMC (For private circulation only)
 NEY
NEY www.smcindiaonline.com

| Equity | 4-7 |
| Derivatives | 8-9 |
| Commodity | 10-13 |
| Currency | 14 |
| IPO | 15 |
| FD Monitor | 16 |
| Mutual Fund | 17-18 |
G
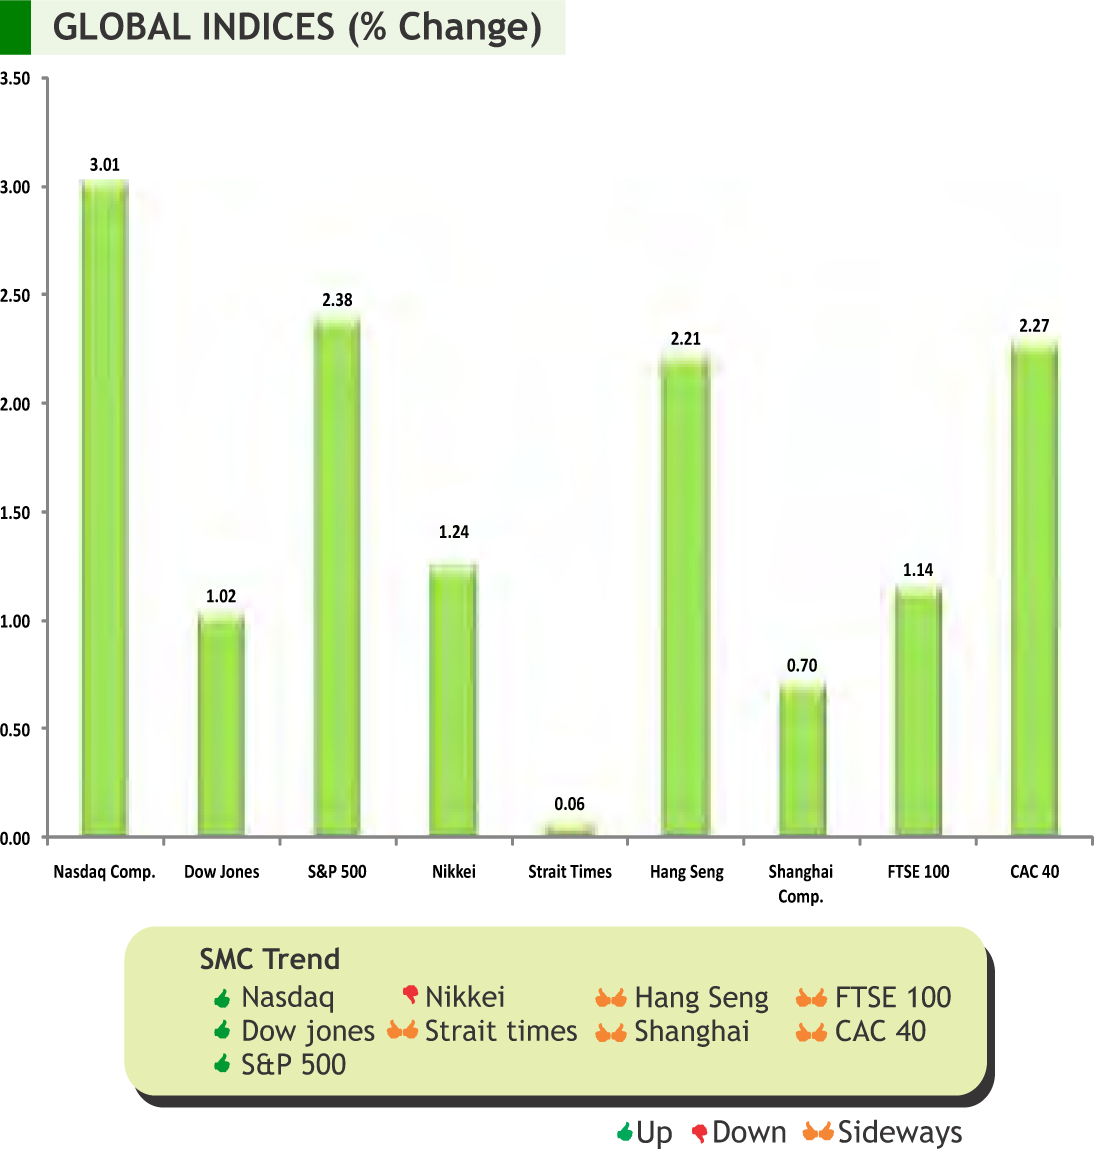
lobal markets gained during the week defying rising U.S.-China trade tensions. In GEurope, uncertainty over the exit of Britain from European Union continues to be there after U.K. parliament rejected Prime Minister Theresa May’s revised Brexit deal. Chinese authorities are expected to take measures to support the weakness in the economy as industrial output fell to seventeen years low in the first two months of the year. Bank of Japan kept monetary policy unchanged stating that the current price levels are not high enough to justify tightening. The bank said that Japanese economy continued to expand moderately, but the global slowdown had caused "some weakness" recently in exports and industrial production.
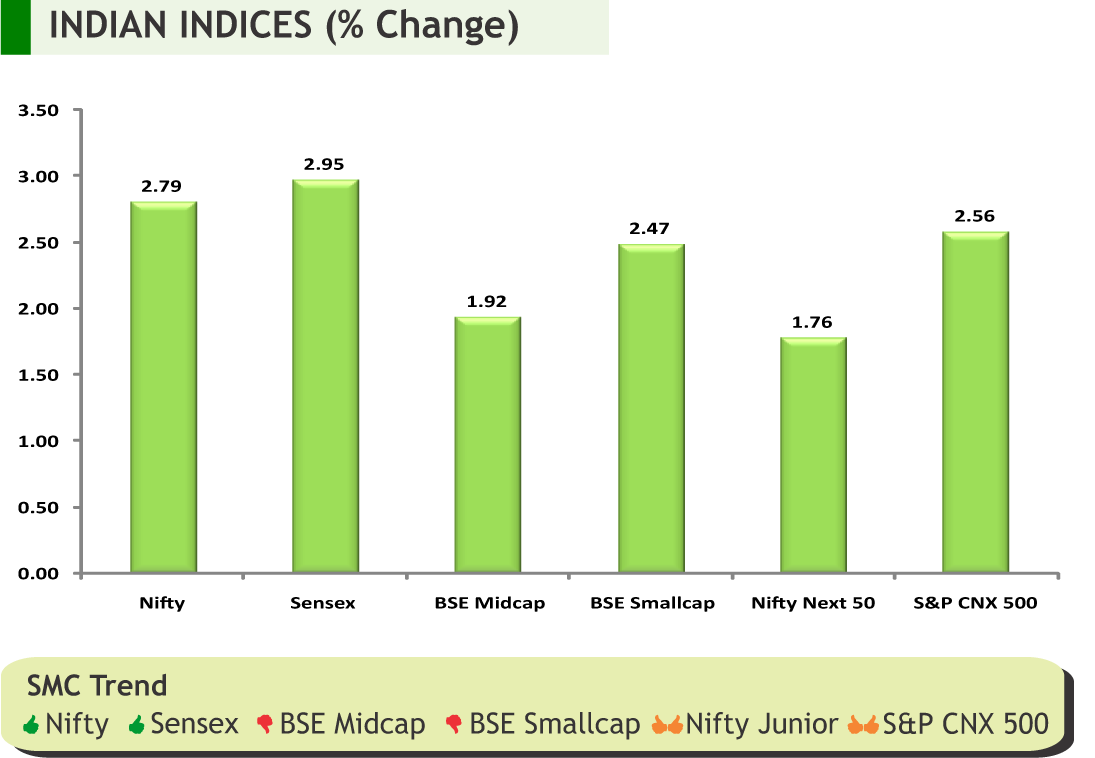
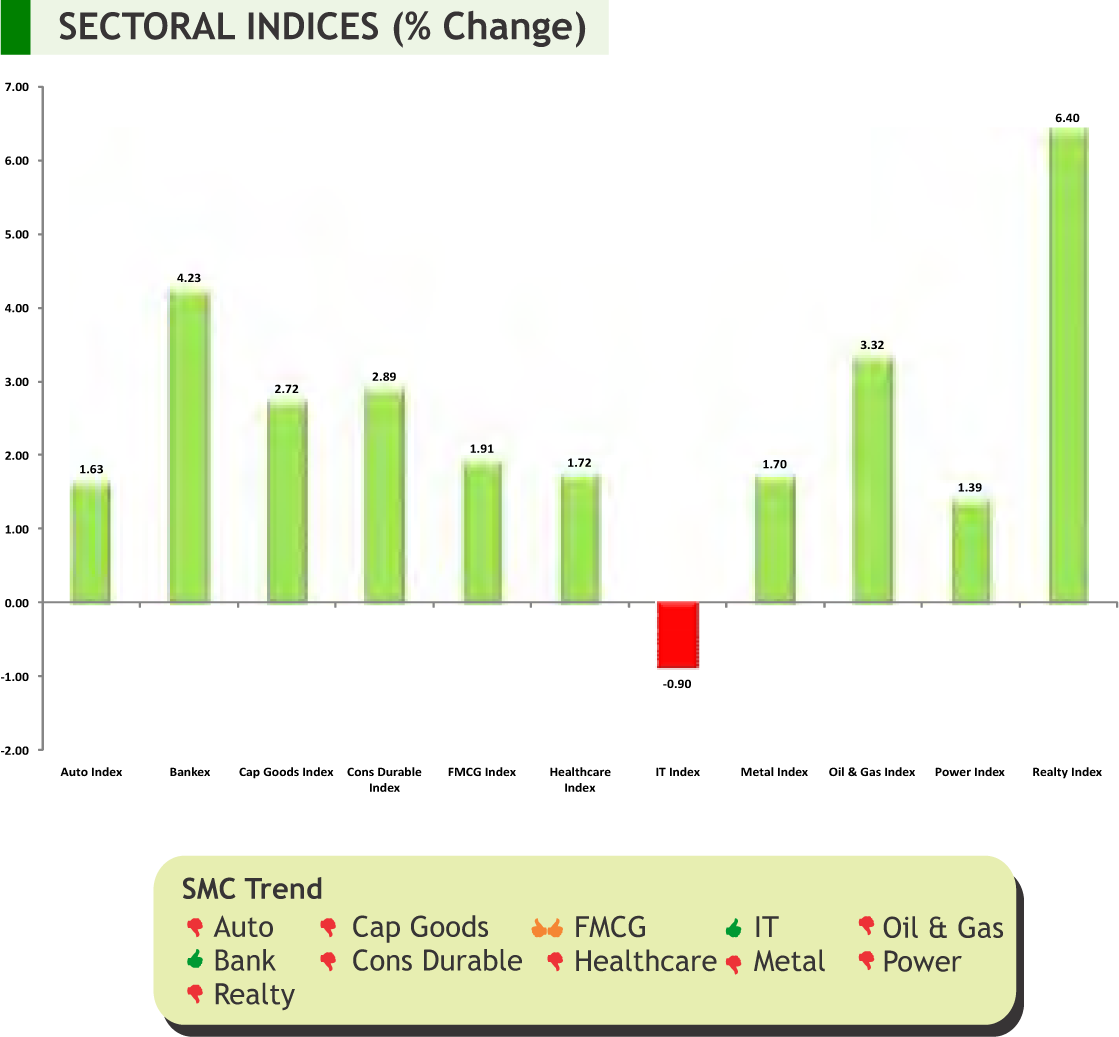
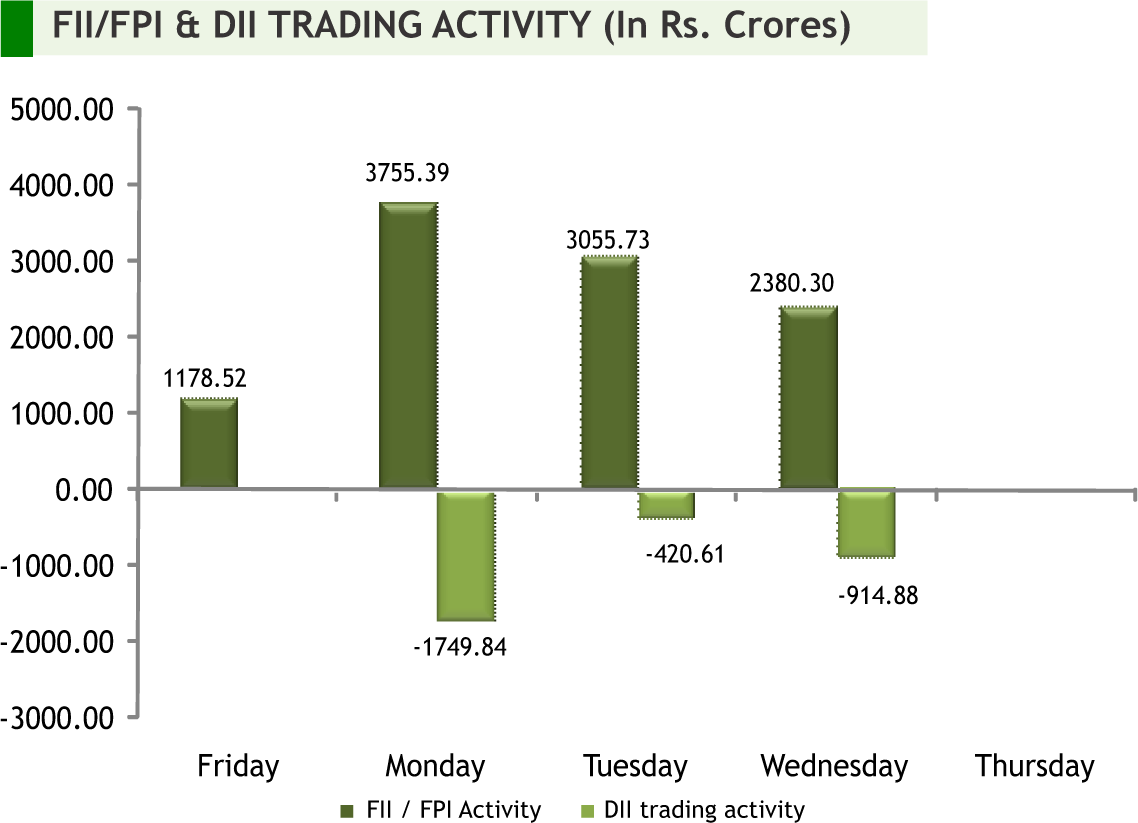
Back at home, Indian markets posted strong gains with banking index moving to fresh highs underpinned by capital inflows in the light of hopes that the RBI may go for a rate cut as the inflation remained under the central bank's projection. Also reduced geopolitical tension, an expectation of a stable government post election, strengthening rupee and the recent FII buying activities boosted the sentiments of the investors. It could also be seen that market has already started pricing in a stronger election outcome. Foreign institutional investors poured in close to fifteen thousand crores this month in the Indian equities. Retail inflation inched up for the first time in four months to 2.57 percent in the month of February compared to a revised 1.97 percent in January 2019. Wholesale inflation too came a bit higher to 2.93 percent in the month of February from 2.76 percent in the prior month. Softer inflation is expected to put Reserve Bank in a position to support economic growth. The Index of Industrial Production (IIP) saw growth slip below the 2% for the second time in three months in January, with the previous occurrence being the 0.32% growth seen in November 2018.Going forward, movement of rupee against the US dollar, crude oil prices and other global cues are likely to give the direction to the markets. Besides, Investment by foreign portfolio investors (FPIs) and domestic institutional investors (DIIs) will also be closely watched.
On the commodity market front, it was a volatile week for commodities; full of event risk and therefore market saw wild swings in both sides. Bullion counter witnessed extreme volatility due to the Brexit dilemma, which has now lacking any real progress. Crude oil prices may remain on a positive path as production cuts led by OPEC and U.S. sanctions against Venezuela and Iran likely created a slight deficit in global supply in the first quarter of 2019. Crude oil can test 4200 levels while taking support near 3900 levels. In base metal counter, prices may trade in range amid uncertainty regarding the trade dispute between US and China. German ZEW Survey Expectations, Euro-Zone ZEW Survey, CPI of UK, FOMC Rate Decision, GDP of New Zeland, Unemployment Rate of Australia, Bank of England Bank Rate¸ CPI of Japan and Canada, etc are few data that are scheduled this week, which should be taken care of while trading in commodities.

SMC Global Securities Ltd. (hereinafter referred to as “SMC”) is a registered Member of National Stock Exchange of India Limited, Bombay Stock Exchange Limited and its associate is member of MCX stock Exchange Limited. It is also registered as a Depository Participant with CDSL and NSDL. Its associates merchant banker and Portfolio Manager are registered with SEBI and NBFC registered with RBI. It also has registration with AMFI as a Mutual Fund Distributor.
SMC is a SEBI registered Research Analyst having registration number INH100001849. SMC or its associates has not been debarred/ suspended by SEBI or any other regulatory authority for accessing /dealing in securities market.
SMC or its associates including its relatives/analyst do not hold any financial interest/beneficial ownership of more than 1% in the company covered by Analyst. SMC or its associates and relatives does not have any material conflict of interest. SMC or its associates/analyst has not received any compensation from the company covered by Analyst during the past twelve months. The subject company has not been a client of SMC during the past twelve months. SMC or its associates has not received any compensation or other benefits from the company covered by analyst or third party in connection with the research report. The Analyst has not served as an officer, director or employee of company covered by Analyst and SMC has not been engaged in market making activity of the company covered by Analyst.
The views expressed are based solely on information available publicly available/internal data/ other reliable sources believed to be true.
SMC does not represent/ provide any warranty express or implied to the accuracy, contents or views expressed herein and investors are advised to independently evaluate the market conditions/risks involved before making any investment decision.
DOMESTIC NEWS
Economy
• India's wholesale price inflation rose to 2.93 percent year-on-year in February, data from the Ministry of Commerce & Industry showed following a 2.76 percent climb in January.
• CPI inflation stood at 2.57 percent in February compared to a revised 1.97 percent in January 2019. Core inflation, however remained elevated at close to 5.5 percent in February.
• Index of Industrial Production (IIP) IIP output growth slowed to 1.7 per cent in January from 7.5 per cent a year ago, primarily due to weak manufacturing and electricity output coupled with an adverse base effect.
Pharmaceuticals
• Unichem Laboratories received approval from the US health regulator to market its Allopurinol tablets in the strengths of 100 mg and 300 mg. The tablets are generic version of Zyloprim talets. The tablets are indicated for management of patients with signs and symptoms of primary or secondary gout and those with leukemia and lymphoma.
Technology
• Tech Mahindra will acquire Japan-based mobile network solution firm K-Vision for $1.5 million in an all-cash deal to support 4G and 5G telecom network roll out in Japan. K-Vision provides network services for mobile communications to telecom operators in Japan. The company earned revenue of $4.8 million during 12-month period ended January 31, 2019.
FMCG
• Jubilant FoodWorks Ltd announced its foray into fast casual Chinese dining with the launch of Hong’s Kitchen restaurant in Eros mall, Gurugram. Hong’s Kitchen will be company’s first own restaurant brand and the third overall in its portfolio of brands. The company operates more than 1,200 stores in 271 cities.
Capital Goods
• GE T&D India has been awarded a technology driven grid modernisation project by Rajasthan Rajya Vidyut Prasaran Nigam as part of the utility's roadmap to implement grid initiatives and augmenting renewable energy in the state, which will benefit the Rajasthan's population.
Hotels
• Lemon Tree Hotels has signed a non-binding agreement with Berggruen Hotels Pvt. Ltd. to acquire 100 percent stake in Keys Hotels. Its portfolio includes 21 owned/managed hotels with 1,911 rooms in 19 cities in India. The company also owns two land parcels for hotel development in Goa and Raipur.
Engineering
• BGR Energy Systems announced that the Electrical Projects Division (EPD) and Environmental Engineering Division (EED) of the Company have secured the following two orders for an aggregate value of Rs.324.46 crore.
INTERNATIONAL NEWS
• U.S. Jobless claims rose in the week ended March 9th, to 229,000, a increase of 6000 from the previous week's unrevised level of 223,000 the Labor Department said. Economists had expected jobless claims to edge up to the 225,000.
• U.S. new home sales plunged by 6.9 percent to an annual rate of 607,000 in January from a revised rate of 652,000 in December. Economists had expected new home sales to edge down to a rate of 620,000 from the 621,000 originally reported for the previous month.
• U.S. import prices climbed by 0.6 percent in February after inching up by a revised 0.1 percent in January, while export prices also increased by 0.6 percent in February after falling by a revised 0.5 percent in January.
• U.S. producer price index for final demand inched up by 0.1 percent in February after edging down by 0.1 percent in January. Economists had expected prices to rise by 0.2 percent.
• China Industrial production rose 5.3 percent year-on-year in the January to February period, the National Bureau of Statistics said, which was less than the 5.6 percent gain economists had forecast. The pace of growth was reportedly the weakest since 2002.
• Japan’s total value of core machine orders dropped a seasonally adjusted 5.4 percent in January, coming in at 822.3 billion yen. That missed expectations for a decline of 1.5 percent following the downwardly revised 0.3 percent fall in December (originally -0.1 percent).
| Stocks | *Closing Price | Trend | Date Trend Changed | Rate Trend Changed | SUPPORT | RESISTANCE | Closing S/l |
|---|---|---|---|---|---|---|---|
| S&P BSE SENSEX | 38024 | UP | 08.02.19 | 36546 | 36300 | 35300 | |
| NIFTY50 | 11427 | UP | 08.02.19 | 10944 | 10900 | 10600 | |
| NIFTY IT | 15547 | UP | 21.07.17 | 10712 | 15200 | 14800 | |
| NIFTY BANK* | 29381 | UP | 30.11.18 | 26863 | 27700 | 27000 | |
| ACC | 1532 | UP | 01.03.19 | 1482 | 1480 | 1440 | |
| BHARTIAIRTEL | 338 | UP | 15.03.19 | 338 | 360 | 345 | |
| BPCL | 396 | UP | 08.03.19 | 367 | 360 | 350 | |
| CIPLA | 533 | UP | 01.03.19 | 552 | 530 | 520 | |
| SBIN | 298 | UP | 02.11.18 | 286 | 270 | 260 | |
| HINDALCO | 199 | DOWN | 04.10.19 | 211 | 205 | 210 | |
| ICICI BANK | 395 | UP | 02.11.18 | 355 | 360 | 350 | INFOSYS | 719 | UP | 02.11.18 | 706 | 690 | 670 |
| ITC | 291 | UP | 08.03.19 | 292 | 280 | 275 | |
| L&T | 1397 | UP | 08.03.19 | 1339 | 1320 | 1290 | |
| MARUTI | 7084 | DOWN | 14.09.18 | 8627 | 7300 | 7500 | |
| NTPC | 158 | UP | 08.03.19 | 152 | 143 | 136 | |
| ONGC | 156 | UP | 08.03.19 | 150 | 145 | 143 | |
| RELIANCE | 1322 | UP | 30.11.18 | 1168 | 1240 | 1200 | |
| TATASTEEL | 515 | UP | 15.03.19 | 515 | 490 | 475 | |
Closing as on 15-03-2019
NOTES:
1) These levels should not be confused with the daily trend sheet, which is sent every morning by e-mail in the name of "Morning Mantra ".
2) Sometimes you will find the stop loss to be too far but if we change the stop loss once, we will find more strength coming into the stock. At the moment, the stop loss will be far as we are seeing the graphs on weekly basis and taking a long-term view and not a short-term view.
| Meeting Date | Company | Purpose |
|---|---|---|
| 18-Mar-19 | Bharat Dynamics | Dividend |
| 18-Mar-19 | NLC India | Dividend |
| 18-Mar-19 | Hindustan Aeronautics | Dividend |
| 18-Mar-19 | Fiem Industries | Dividend |
| 18-Mar-19 | Aegis Logistics | Dividend |
| 19-Mar-19 | IDBI Bank | Fund Raising |
| 19-Mar-19 | Indian Oil Corporation | Dividend |
| 20-Mar-19 | Adani Transmission | Buyback/Other business matters |
| 26-Mar-19 | GOCL Corporation | Dividend |
| Ex-Date | Company | Purpose |
|---|---|---|
| 18-Mar-19 | Sundaram Clayton | Interim Dividend - Rs 16 Per Share |
| 18-Mar-19 | TVS Motor Company | Interim Dividend - Rs 1.40 Per Share |
| 19-Mar-19 | Bharat Electronics | Interim Dividend - Re 0.70 Per Share |
| 19-Mar-19 | Meghmani Organics | Interim Dividend - Re 0.60 Per Share |
| 19-Mar-19 | NTPC | Bonus 1:5 |
| 20-Mar-19 | Ujjivan Financial Services | Interim Dividend |
| 20-Mar-19 | RITES | Interim Dividend - Rs 4 Per Share |
| 20-Mar-19 | HUDCO | Interim Dividend - Re 0.675 Per Share |
| 20-Mar-19 | Sun TV Network | Interim Dividend |
| 22-Mar-19 | Coal India | Interim Dividend |
| 22-Mar-19 | NMDC | Interim Dividend - Rs 5.52 Per Share |
| 25-Mar-19 | Mishra Dhatu Nigam | Interim Dividend |
| 26-Mar-19 | Bharat Dynamics | Interim Dividend |
| 26-Mar-19 | NLC India | Interim Dividend |
| 27-Mar-19 | Indian Oil Corporation | Interim Dividend |
| 28-Mar-19 | CRISIL | Dividend Rs - 11 Per Share |
4
5
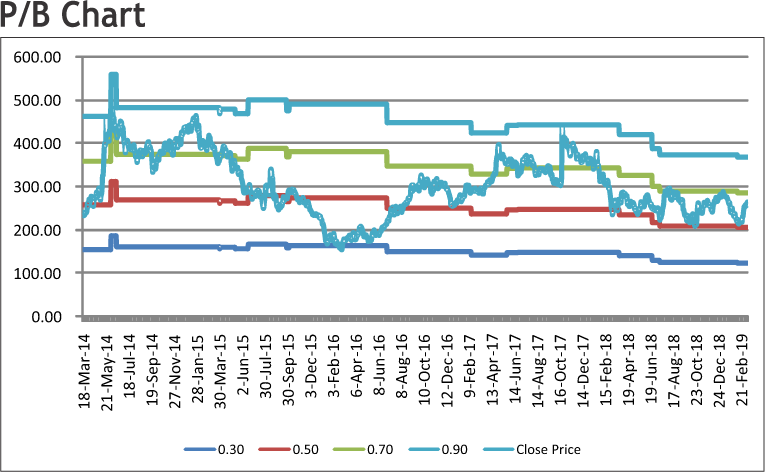
CANARA BANK LIMITED
CMP: 262.30
Target Price: 305
Upside: 16%
| Face Value (Rs.) | 10.00 |
| 52 Week High/Low | 302.10/205.15 |
| M.Cap (Rs. in Cr.) | 19757.61 |
| EPS (Rs.) | 0.00 |
| P/E Ratio (times) | 0.00 |
| P/B Ratio (times) | 0.65 | Stock Exchange | BSE |
Investment Rationale
• The business of the bank has posted healthy core operating performance led by domestic business growth which was propelled by 16.1% growth in deposits and 15.1% growth in advances. Consequently the domestic market share of the bank has improved YoY by 18 bps under deposits to 4.33% and 19 bps under advances to 4.34%. The domestic advances grew by a robust 24. 6% YoY and CASA (Current Account Savings Account) deposits by 10. 7% with Savings deposits growing at 11.42%. The CASA ratio stood at 32.2%.
• The efforts of the bank for improving the asset quality yielded results with the Gross NPA decreasing by 31 bps to 10.25% and Net NPA at 6. 37%, backed by significant recoveries and upgradations.
• The global business of the bank also surged 13.2% to reach Rs. 9.93 lakh crores. The global deposits of the bank improved 14.2% to Rs. Rs.5.76 lakh crores and the global net advances grew by 11.8% YoY to reach Rs. 4.17 lakh crores with a CD ratio of 72.50%.
• The Net Interest Margin of the Bank improved to 2.65%, from 2.39% YoY and a healthy CASA growth. The provision coverage ratio has improved a healthy 670 bps to 62.54% from 55.81% YoY. Management of the bank further expects it to improve up to 70% and having aim to provide adequate cushion for an organic growth. Moreover, also expects to reduce GNPA below 10% and NNPA below 6% by Q4 FY19.
• The capital optimization measures taken by the bank have led to decrease in risk-weight density to 87.39% as at Dec 2018 from 91.27% YoY. The well capitalized position of the bank will be supportive for further credit growth.
Risk
• Regulatory provisioning on assets
• Unidentified asset slippages
Valuation
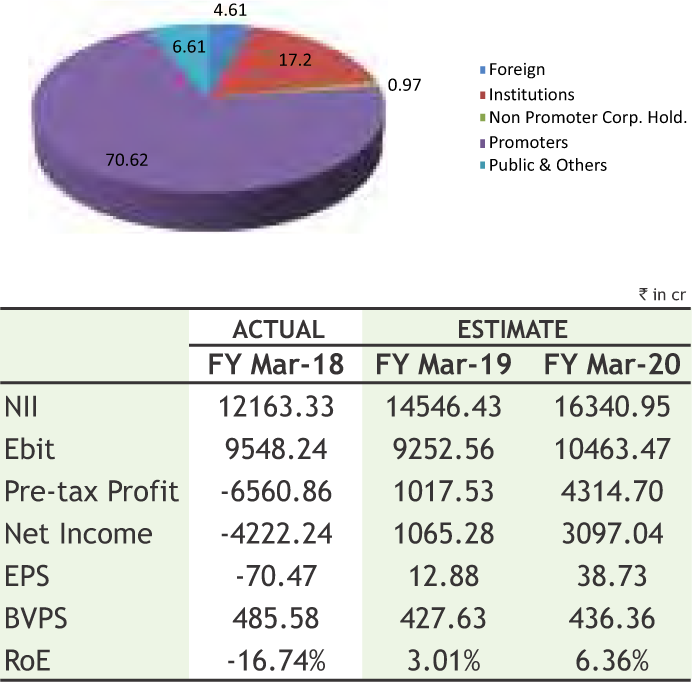
Going ahead, the bank aims at improving the bottomline further with balanced thrust on both retail and corporate advances coupled with increased adoption of digitalization for efficiency improvement. The management of the bank intends to continue focusing on improvement in corporate book with high rated corporate advances. Bank has exhibited healthy improvement in asset quality. Thus, it is expected that the stock will see a price target of Rs. 305 in 8 to 10 months time frame on the P/Bv of 0.7x and FY20 BVPS of 436.36.
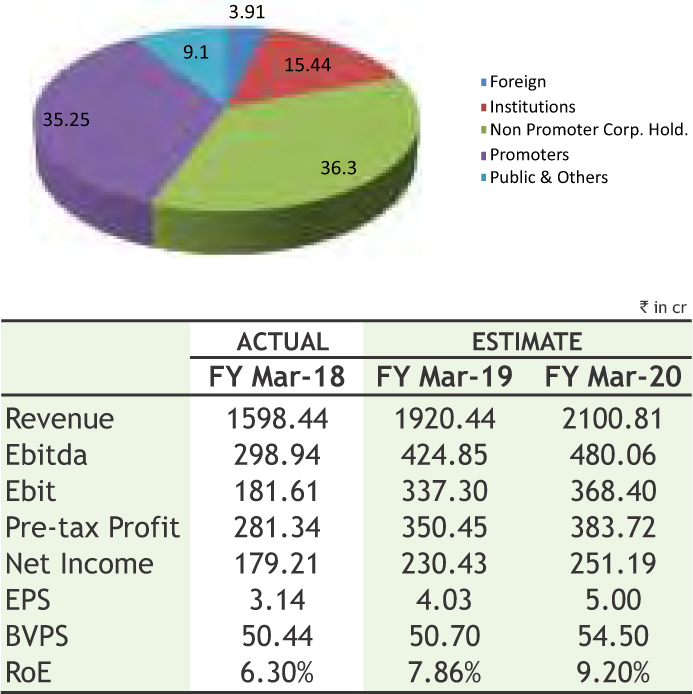
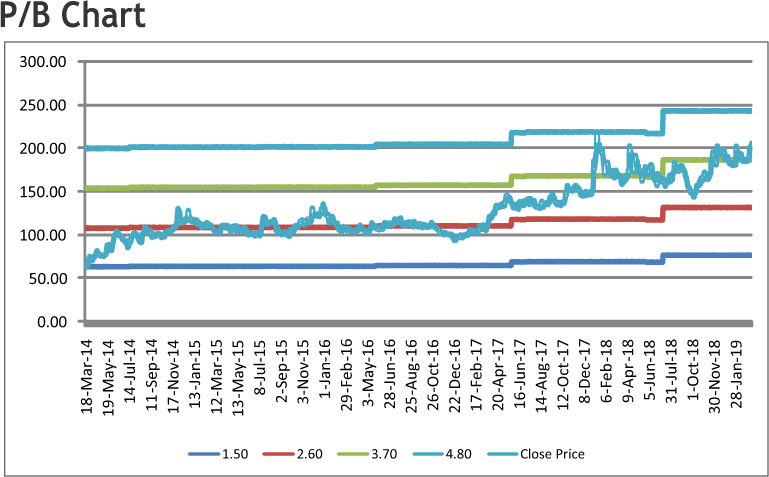
EIH LIMITED
CMP: 204.80
Target Price: 262
Upside: 28%
| Face Value (Rs.) | 2.00 |
| 52 Week High/Low | 214.95/137.60 |
| M.Cap (Rs. in Cr.) | 11705.34 |
| EPS (Rs.) | 2.55 |
| P/E Ratio (times) | 80.31 |
| P/B Ratio (times) | 4.21 |
| Dividend Yield (%) | 0.44 |
| Stock Exchange | BSE |
Investment Rationale
• EIH Limited is engaged in hospitality and related services. The Company operates luxury hotels under the brand name Oberoi and five-star hotels under the brand Trident.
• The Company has a 100% equity interest in the six ‘The Oberoi Hotels’ located in Mumbai, New Delhi, Kolkata, Bengaluru, Udaipur and Ranthambhore.The Oberoi Hotels and Resorts are luxury properties serving foreign and domestic business customers and high-end leisure travellers. The Oberoi Hotels are widely recognised as being among the leading hotels in their markets and several have been assigned five star deluxe ratings, the highest available rating in India, by the Ministry of Tourism.
• The Company also has equity interests in nine hotels that operate under the “Trident” name. Trident Hotels target business and leisure travellers to metropolitan and tier two cities in India who seek high-quality boarding, lodging and business or recreational facilities at more affordable rates than the five star deluxe segment.
• The Oberoi Gir, a Luxury Jungle Resort spread over 50 acres, is located on the periphery of Gir National Park in Gujarat. The Resort, scheduled to open in the last quarter of 2019 will be managed by the Company and shall consist of 22 Luxury Tents.
• With the reopening of the Delhi property, occupancies and revenues are expected to improve further in coming quarters. Moreover, it has a strong pipeline of rooms which will help drive growth in the longer run.
• Hotel Industry reported an overall improvement in financial performance, supported by favourable overall demand and supply situation in the hotel
industry in India and internal efficiencies. With limited rooms entering the system and rapid uptick in demand, room rates saw an improvement, translating in an improvement in revenue per available room (RevPAR). With expectation of an improvement in occupancies, this uptick is expected to continue in coming quarters.
Risk
• Terrorism and political risk
• Competitive industry and regulatory compliances
Valuation
The company business strategy moves for continued emphasis on high-end, upscale accommodation through the existing ‘The Oberoi and Trident Hotels’, as well as selective expansion in both the five star deluxe and five star segments of the Indian hotel industry by participating in the development and management of new hotel properties in destinations where it sees significant opportunities. Thus we expect the stock to see a price target of Rs 262 in 8 to 10 months time frame on an current P/Bvx of 4.80 and FY20 (BVPS) of Rs 54.50.
Source: Company Website Reuters Capitaline
Above calls are recommended with a time horizon of 8 to 10 months.
6

The stock closed at Rs 359.35 on 15th March, 2019. It made a 52-week low of Rs 295.25 on 05th October 2018 and a 52-week high of Rs. 399.40 on 16th August 2018. The 200 days Exponential Moving Average (DEMA) of the stock on the daily chart is currently at Rs 344.44
After registering all time high of 399 levels, stock witnessed profit booking from higher levels and tested 310 levels, which was their earlier support on charts. Then after, it started moving higher and crossed its downward sloping resistance line and also managed to close above the same. Therefore, one can buy in the range of 353-356 levels for the upside target of 380-385 levels with SL below 338.

The stock closed at Rs 127.75 on 15th March, 2019. It made a 52-week low at Rs 92.65 on 23rd Oct 2018 and a 52-week high of Rs. 130.90 on 14th March 2019. The 200 days Exponential Moving Average (DEMA) of the stock on the daily chart is currently at Rs 115.87
As we can see on charts that stock was consolidated in the wide range of 95 to 125 levels for ten months and formed an “Inverted Head and Shoulder” pattern on weekly charts, which is bullish in nature. Last week, stock has given the breakout of same by registering gains around 8% and also has managed to close above the same so further buying is anticipated from current levels. Therefore, one can buy in the range of 123-125 levels for the upside target of 137-140 levels with SL below 115.
Disclaimer : The analyst and its affiliates companies make no representation or warranty in relation to the accuracy, completeness or reliability of the information contained in its research. The analysis contained in the analyst research is based on numerous assumptions. Different assumptions could result in materially different results.
The analyst not any of its affiliated companies not any of their, members, directors, employees or agents accepts any liability for any loss or damage arising out of the use of all or any part of the analysis research.
SOURCE: CAPITAL LINE
Charts by Spider Software India Ltd
Above calls are recommended with a time horizon of 1-2 months
7
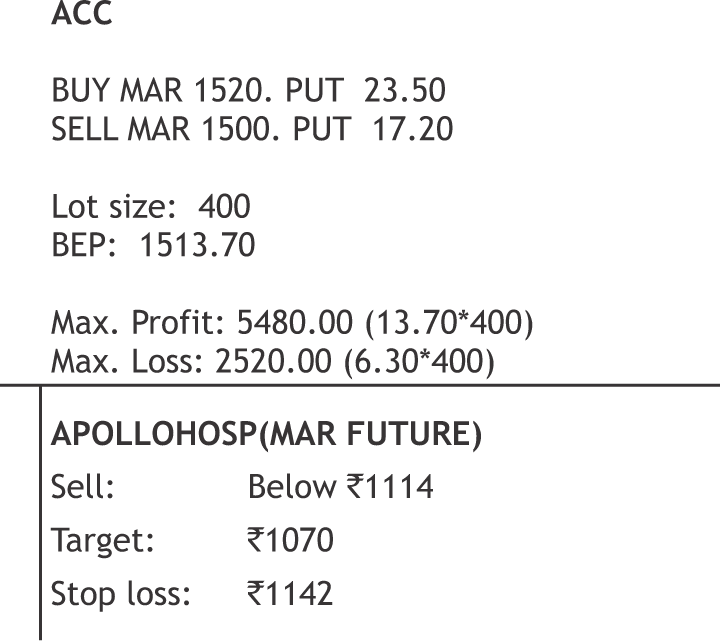
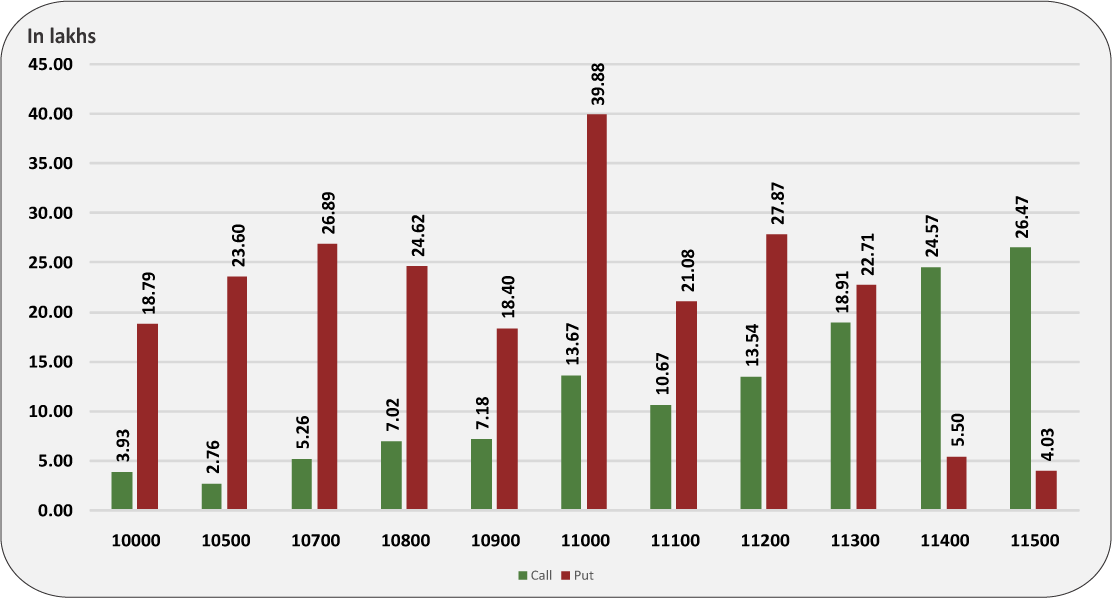
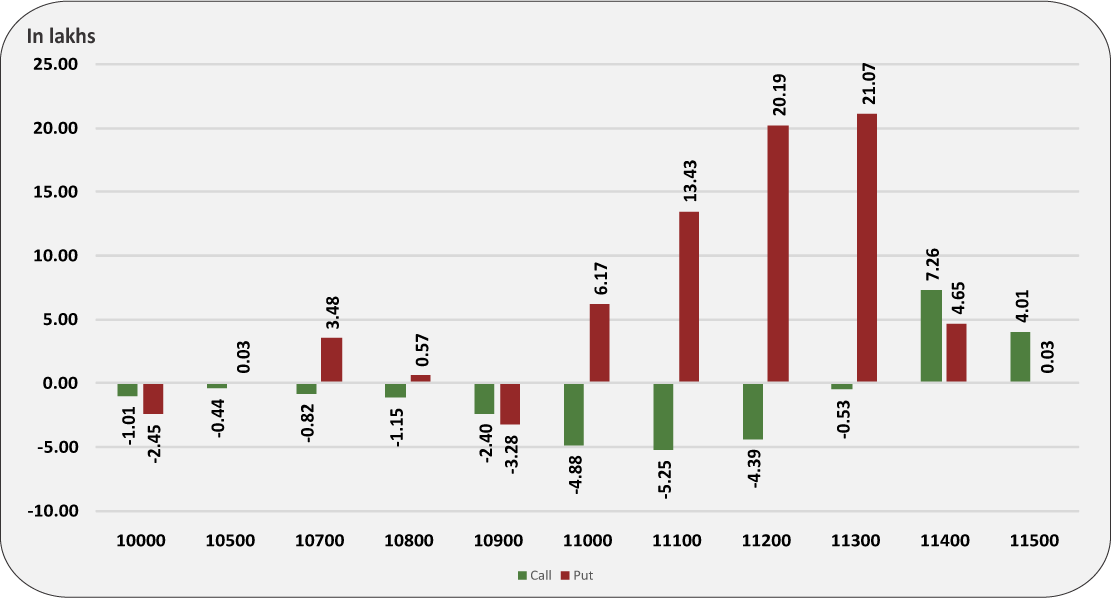
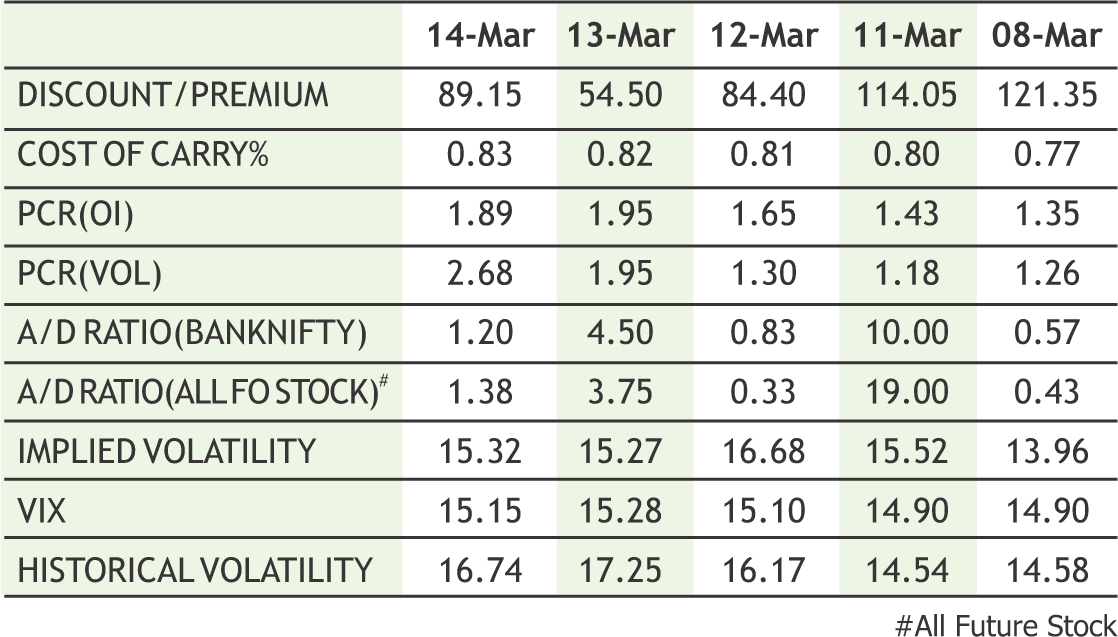
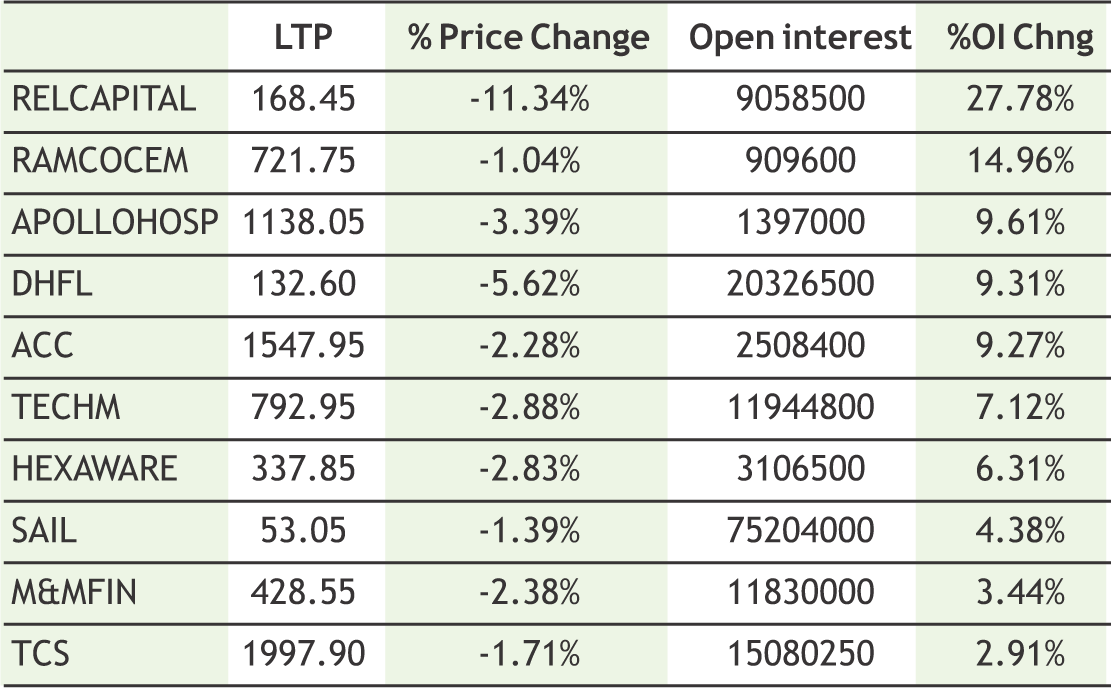
Nifty has again closed near weekly high, data reflects that at current levels still there is lot of outstanding short position in Nifty and Index calls and we can expect another round of short covering. As per current derivative data, Nifty can move towards 11500-11550 mark this week as the market undertone remains bullish with support of consistent short covering. Derivative data indicate bullish scenario to continue with Nifty having multiple strong supports at lower levels around 11300 & 11350 spot. Currently, Nifty is moving up, with decent addition in open interest which indicates strength in the current trend. Option writers were seen active in recent rally as put writings are seen in 11200 & 11300 strikes along with the unwinding in calls. Among Nifty Call options, the 11500 strike call has the highest open interest of more than 20 lakh shares, while in put options 11300 strike hold the maximum open interest of more than 25 lakh shares. The Implied Volatility (IV) of calls closed at 12.89% while that for put options closed at 12.20%. The Nifty VIX for the week closed at 15.15% and is expected to remain volatile. The PCR OI for the week closed at 1.51 which indicates put writing. On the technical front, 11300-11350 spot levels is strong support zone and current trend is likely to continue towards 11500-11550 levels.
8
|
|
|
|
**The highest call open interest acts as resistance and highest put open interest acts as support.
# Price rise with rise in open interest suggests long buildup | Price fall with rise in open interest suggests short buildup
# Price fall with fall in open interest suggests long unwinding | Price rise with fall in open interest suggests short covering
9
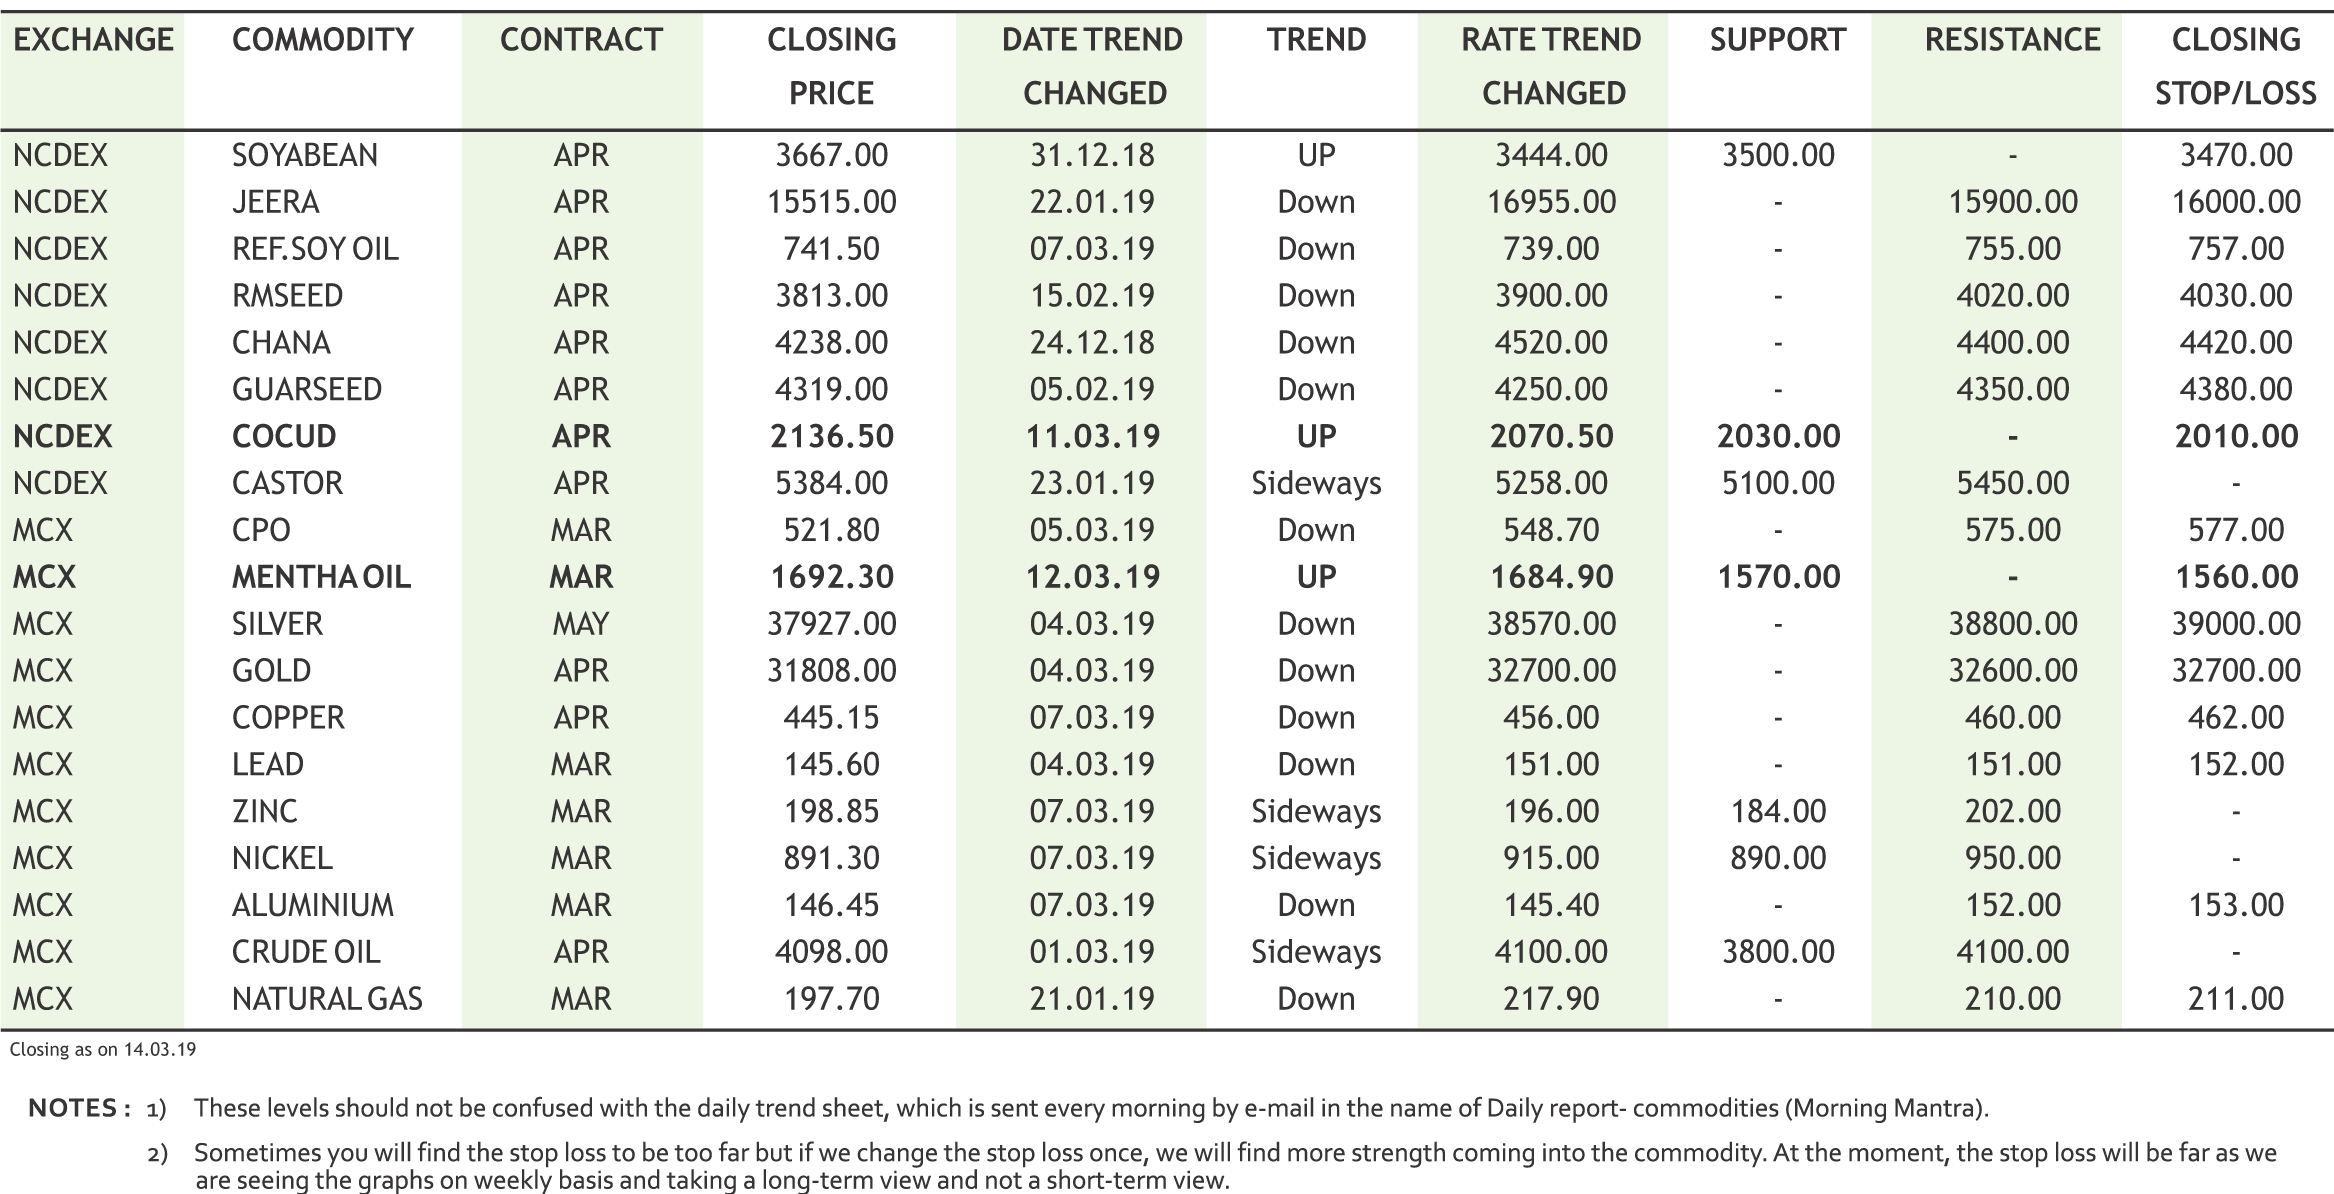
The bearish trend is likely to prevail in turmeric futures (Apr) as the downside may get extended towards 6100-6000 levels. In the present scenario, almost all the traders are buying for their requirement alone and they do not want to stock turmeric, as they are expecting the new Erode Turmeric may arrive for sale by the middle of April and also they may get fresh upcountry demand for the new turmeric soon. The recovery seen last week in jeera futures (Apr) faced resistance near 15775 levels & then retraced on the back of profit booking. This phenomenon may drag down the counter to 14500, if breached the support near 15000 levels. Overall, the sentiments are bearish on better output prospects. The traders are optimistic of higher output because of adequate availability of water. India’s cumin seed (jeera) output is set to touch 4,16,000 tonnes for 2019, about 9% higher than the previous year, supported by a sharp jump in production in Rajasthan. Besides, lower export demand in the physical market also capping the upside. Coriander futures (Apr) may witness a consolidation in the range of 6300-6680 levels. Spot prices remained steady at major markets of Rajasthan amid matching demand and supply whereas in Guna, the major market of Madhya Pradesh, prices are declining with rise in new arrivals of low quality and higher moisture content. Cardamom futures (ApriL) may see a rise till 1530-1560 levels as demand is outweighing the supply. The growing areas have not received rains for some time coupled with protracted dry spell has changed the market sentiment to bullish. The period between now and the next crop remains wider compelling many to cover whatever material arriving at the auctions.
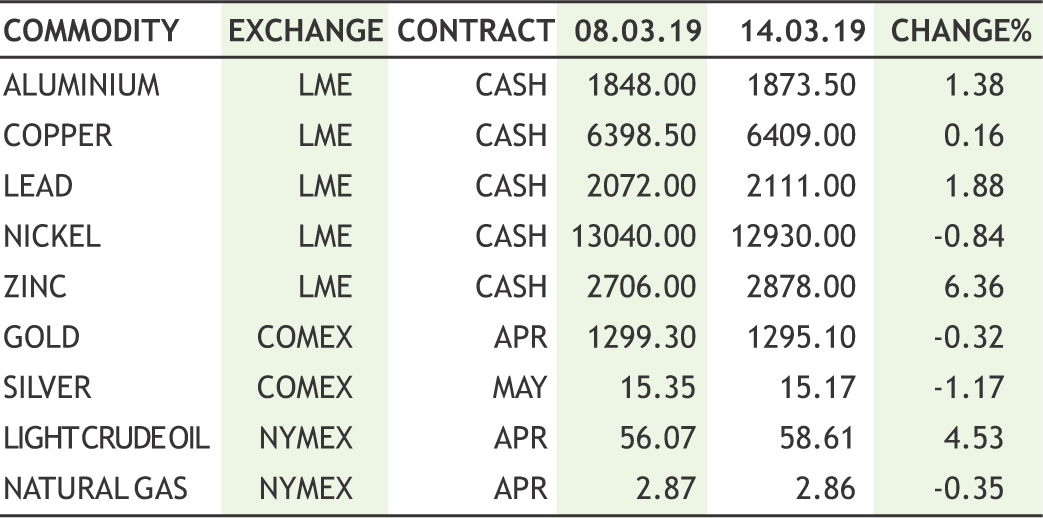
Bullion counter has witnessed extreme volatility recently due to the Brexit dilemma, which has now resulted in a stalemate lacking any real progress to resolve their current dilemma. There is also the factor of recent volatility seen in the British pound and Euro dollar, a direct result of Brexit issues. British lawmakers voted last week to seek to delay Brexit - maybe for weeks, maybe for months - after Prime Minister Theresa May's plans for leaving the European Union have been repeatedly rejected by a UK Parliament trying to wrest control from her. Meanwhile stronger local currency rupee is also capping the upside which appreciated to nearly 69.20 on robust foreign inflows ahead of general elections. FIIs have flooded Indian markets with $1.8 billion till date in March, which has partially helped market rally. Gold can take support near 31400 levels while facing resistance near 32400 levels while silver can dip towards 37000 levels while facing resistance near 38500 levels. Federal Reserve chairman Jerome Powell said the U.S. central bank does “not feel any hurry” to change the level of interest rates again as it watches how a slowing global economy affects local conditions in the U.S. The number of Americans filing applications for unemployment benefits increased more than expected in penultimate week, suggesting the labour market was slowing, while new home sales fell more than expected in January. US sales of both gold and silver coins jumped to two-year highs in January, but then slumped again in February.
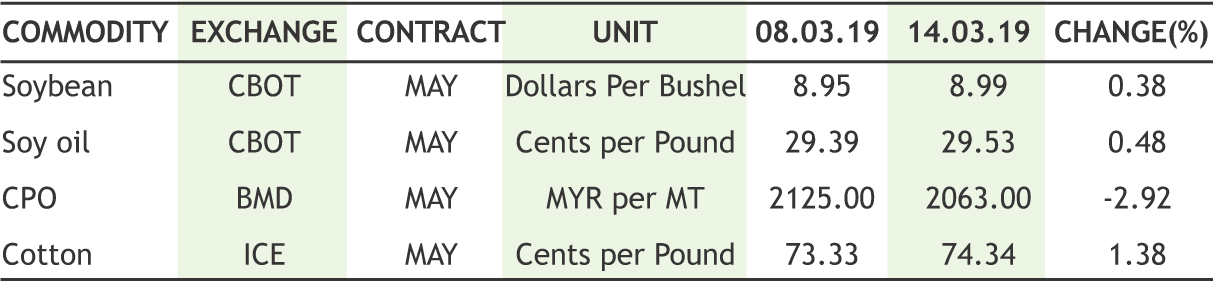
Soybean futures (Apr) is trading near its two months low & this bearish trend is likely to persist as it can fall further towards 3550 levels, if breaks the near term support of 3625 levels. Demand in the physical market is continuing to remain subdued from millers and crushers with ongoing lean season for soybean and oil market. Soy oil futures (Apr) is likely to witness sell on rise & touch 725 levels owing to increasing supply pressure of imported edible oil in the domestic market. The overall import of vegetable oils during November 2018 to February 2019 is reported at 4,862,849 tons compared to 4,785,778 tons i.e. up by 1.61%. The bearish trend of CPO futures (Mar) is expected to continue till 510-505 levels, taking negative cues from the fundamental factors emerging in the international market. The European Commission concluded that palm oil should be phased out from transport fuel due to environmental concerns. Apart from this, there is ample supply of palm oil in India which is exerting pressure on domestic edible oil prices. During Nov.’18-Feb.’19, Palm Oil import has marginally increased to 3,070,466 tons from 3,034,514 tons during the same period of last year; however Soft Oils import decreased to 1,541,346 tonnes from 1,620,936 tonnes during the same period of last year. Total stock at ports and in pipelines on 1st March is reported at 2,195,000 tons, increased by 85,000 tons from 2,110,000 tons as on 1st February, 2019. The downtrend of mustard futures (Apr) is likely to go down further to test 3730 levels. The ongoing phase of lean demand, significant arrivals amid expectations of bumper crop output this season would drag down the prices.
Crude oil prices may remain on positive path as production cuts led by OPEC and U.S. sanctions against Venezuela and Iran likely created a slight deficit in global supply in the first quarter of 2019. However, oil prices have been capped by concerns that an economic slowdown will soon start denting growth in fuel demand. Crude oil can test 4200 while taking support near 3900. The Organization of the Petroleum Exporting Countries (OPEC) and non-affiliated allies such as Russia - known as the OPEC+ alliance pledged to withhold 1.2 million barrels per day (bpd) in crude supply from the start of the year to tighten markets and prop up prices. U.S. crude oil production is expected to grow slower than previously expected in 2019 and average about 12.30 million barrels per day (bpd) the U.S. Energy Information Administration (EIA) stated recently. Meanwhile, U.S. sanctions against Venezuela as well as Iran have further tightened oil markets. With OPEC voluntarily withholding supply and U.S. sanctions preventing Iranian and Venezuelan oil from entering markets, global crude flow data in showed a slight supply deficit likely appeared in the first quarter. Natural gas counter may witness short covering at lower levels as it may take support near 190 and can recover towards 215 levels. U.S. natural gas futures got support after the release of a federal report showing the biggest weekly storage draw ever during the month of March. The rapid drop in demand reflected in the latest weather outlooks has occurred as production has shown signs of rebounding from earlier lows.
The upside move of cotton futures (Mar) may remain restricted near 21320 levels. After the recent spurt in cotton prices, many ginning factories in Telangana and Gujarat have stopped their operation as the cotton production has gone down. So, arrival of the cotton bales to Tamil Nadu markets has decreased, and resulted in sudden increase of the cotton price. However, the prices are expected to cool down as the Cotton Corporation of India (CCI) is likely to start selling its existing stocks, procured in the ongoing 2018-19 season (Oct-Sept) from April.. On the international market, ICE cotton futures (May) is facing resistance near 76 cents per pound. In days to come may trade with a downside bias reacting negative to the news that a meeting between President Donald Trump and President Xi Jinping to sign an agreement to end their trade war won’t occur this month and is more likely to happen in April at the earliest. Chana futures (Apr) may show a break out of its resistance near 4270 & move higher to test 4350 levels. The near term support is 4250 levels. The positive factor which may lift the sentiments is that the festival demand for chana ahead of Holi. The Besan or Gram flour is used in making a variety of savoury and sweet dishes. Mentha oil (Mar) is likely to gain further to test 1730-1760 levels. The overall sentiments are still bullish as demand from both domestic and export fronts are emerging at existing price levels. While, the major producing belts of Chandausi in Uttar Pradesh are witnessing lower arrivals as farmers are holding back their produce anticipating rise in prices ahead.
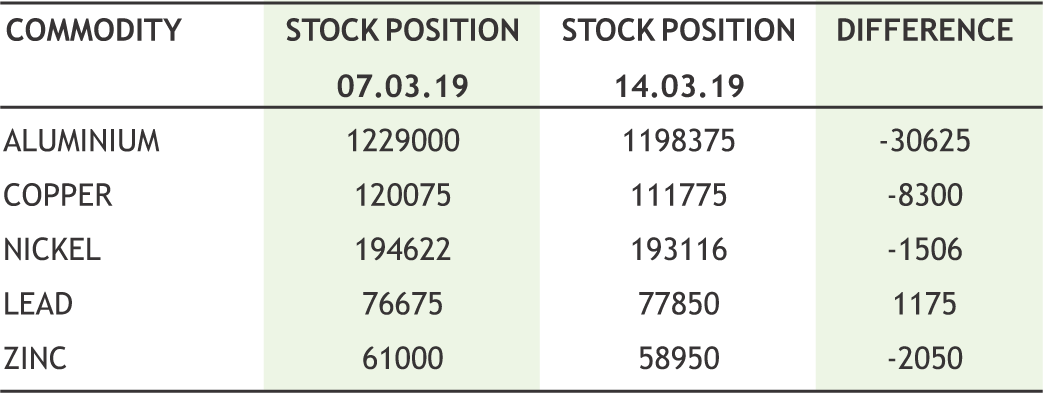
In base metal counter, prices can trade with sideways bias amid uncertainty regarding the trade dispute between US and China. According to the Treasury Secretary Steven Mnuchin “A summit to seal a trade deal between U.S. President Donald Trump and Chinese President Xi Jinping will not happen at the end of March as previously discussed because more work is needed in U.S.-China negotiations”. Copper may take the support of 435 levels and resistance near 455 levels. On warrant stocks of copper, those not earmarked for delivery, in LME-approved warehouses jumped 34,900 tonnes to 66,325 tonnes. The premium of cash copper over the three-month LME contract eased to $20 a tonne from a discount of $70 recently, indicating worries over tight supply were easing. Meanwhile Lead may dip towards 144 levels while facing resistance near 150 levels. Aluminium can remain sideways as it can take support near 142 levels while facing resistance near 149 levels. The United States is working on a plan to lift tariffs from Mexican and Canadian steel and aluminum but preserve the gains that domestic producers have received from the duties so far. Zinc may dip lower towards 190 levels while facing resistance near 205 levels. LME zinc stocks have fallen to 58,950 tonnes, the lowest since October 2007. Meanwhile investors have been holding metal outside LME warehouses where storage is cheaper. Nickel can also witness some profit booking at higher levels as it can test 860 levels while facing resistance near 925 levels.
10
|

CRUDE MCX (APR) contract closed at Rs. 4098 on 14th Mar’19. The contract made its high of Rs. 4170 on 22nd Feb’19 and a low of Rs. 3302 on 31st Dec’18. The 18-day Exponential Moving Average of the commodity is currently at Rs. 4022.80.On the daily chart, the commodity has Relative Strength Index (14-day) value of 56.66.
One can sell below Rs. 4025 for a target of Rs. 3880 with the stop loss of Rs. 4090.

NATURAL GAS MCX (MAR) contract closed at Rs. 197.70 on 14th Mar’19. The contract made its high of Rs. 211.40 on 15th Jan’19 and a low of Rs. 185.10 on 7th Feb’19. The 18- day Exponential Moving Average of the commodity is currently at Rs. 197.39. On the daily chart, the commodity has Relative Strength Index (14-day) value of 49.39.
One can buy at Rs. 192 for a target of Rs. 206 with the stop loss of Rs. 185.

GUARGUM NCDEX (APR) contract was closed at Rs. 8789 on 14th Mar’19. The contract made its high of Rs. 9006 on 21th Jan’19 and a low of Rs. 8295 on 27th Feb’19. The 18-day Exponential Moving Average of the commodity is currently at Rs. 8606.5.On the daily chart, the commodity has Relative Strength Index (14-day) value of 59.06.
One can buy at Rs. 8600 for a target of Rs. 9000 with the stop loss of Rs. 8400.
11
• U.S. consumer prices rose for the first time in four months in Februaryt, resulting in the smallest annual gain in nearly 2-1/2 years.
• Commodity trader Trafigura is shipping gasoline and gasoline blendstocks to South America from Asia in a crude tanker.
• U.S. crude oil production is expected to grow slower than previously expected in 2019 and average about 12.30 million barrels per day (bpd).
• China's daily steel output rose in January and February, as ramped up production.
• Pre Expiry Margins for Coriander futures contract shall now be levied at 1.5% per trading day in the last 11 trading days till the expiry day of the respective contracts. The revised pre-expiry margin will be applicable in all the running contracts expiring from April 2019 and in contracts to be launched.
• Additional Margin of 5% on buy (long) and sell (short) side of all running contracts and yet to be launched contracts of Cardamom withdrawn with effect from Tuesday, March 12, 2019.
• The European Commission restricted the types of biofuels from palm oil that may be counted toward the EU’s renewable-energy goals and introduced a certification system.
• DGCX will launch two new base metal products, aluminum futures and zinc futures. They will go live on March 22.
• LME launched seven new cash-settled futures contracts 11th March, including hot-rolled coil (HRC) steel, alumina and cobalt.
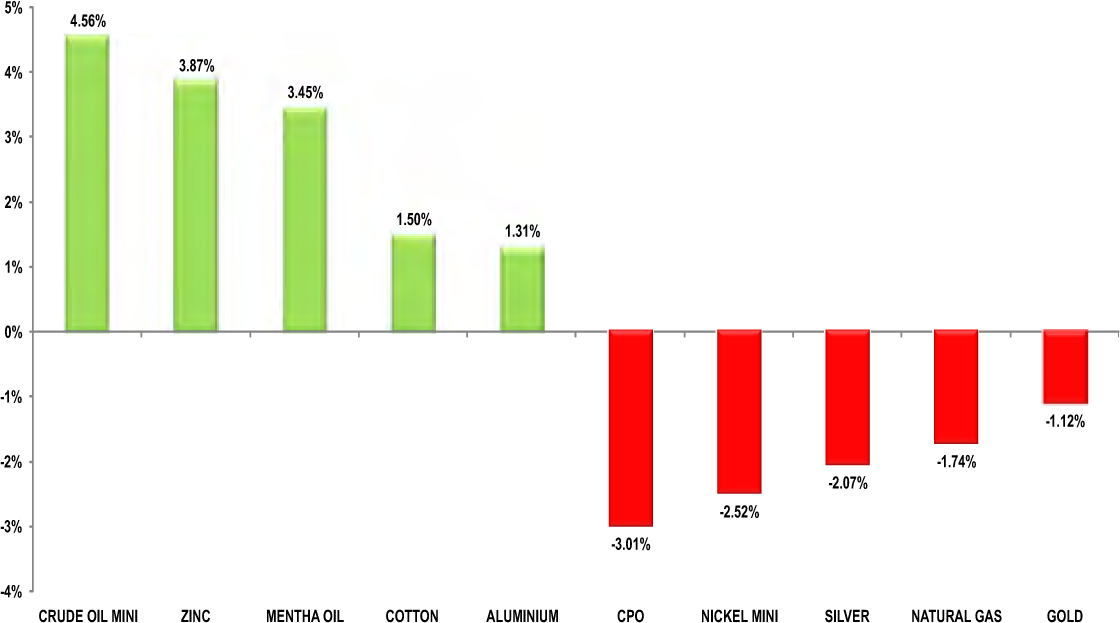
It was a volatile week for commodities; full of event risk and therefore market saw wild swings in both sides. The British Parliament rejected Prime Minister Theresa May's deal to quit the European Union for a second time, deepening the country's political crisis days before the planned departure date on March 29. Gold scaled a near two-week peak on Wednesday, after reclaiming the key $1,300 level in the previous session, as investors opted for the safe-haven metal after British lawmakers rejected an amended exit deal, while a weaker dollar lent further support. The disappointing U.S. data, which followed a spate of weak reports from other economies, cascaded concerns on slowdown in global growth. U.S. consumer prices rose for the first time in four months in February, but the pace of the increase was modest, resulting in the smallest annual gain in nearly 2-1/2 years, supporting the Federal Reserve's 'patient' stance on U.S. interest rate hikes. Though in the second half of the week, gold took correction and settled in sideways zone. Silver was down in both international and domestic market; tracking the weaker trend in base metals. Back at home, sharp appreciation in INR kept the precious metals on lower side. USD hit the low of 69.10 on improved flow of FII’s. Disappointing data from US and China, lingering trade war issue & BREXIT delay etc lowered the sentiments in base metals counter due to which copper, nickel and lead traded bearish while aluminium and zinc hold the gain. Crude gradually showed its strength, reacted on various statements given by OPEC for supply cut. The U.S. Energy Information Administration reported that crude oil inventories fell by 3.86 million barrels in the week to March 8 versus forecasts for a stockpile build of 2.66 million. It traded near four month high. Natural gas prices are consolidating and showing gradual upside move.
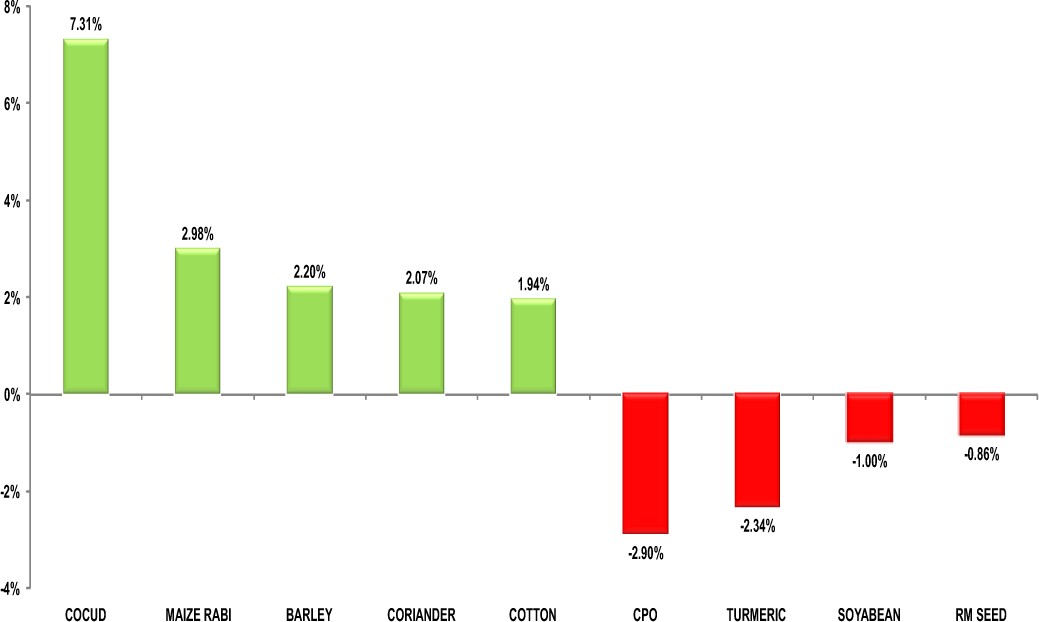
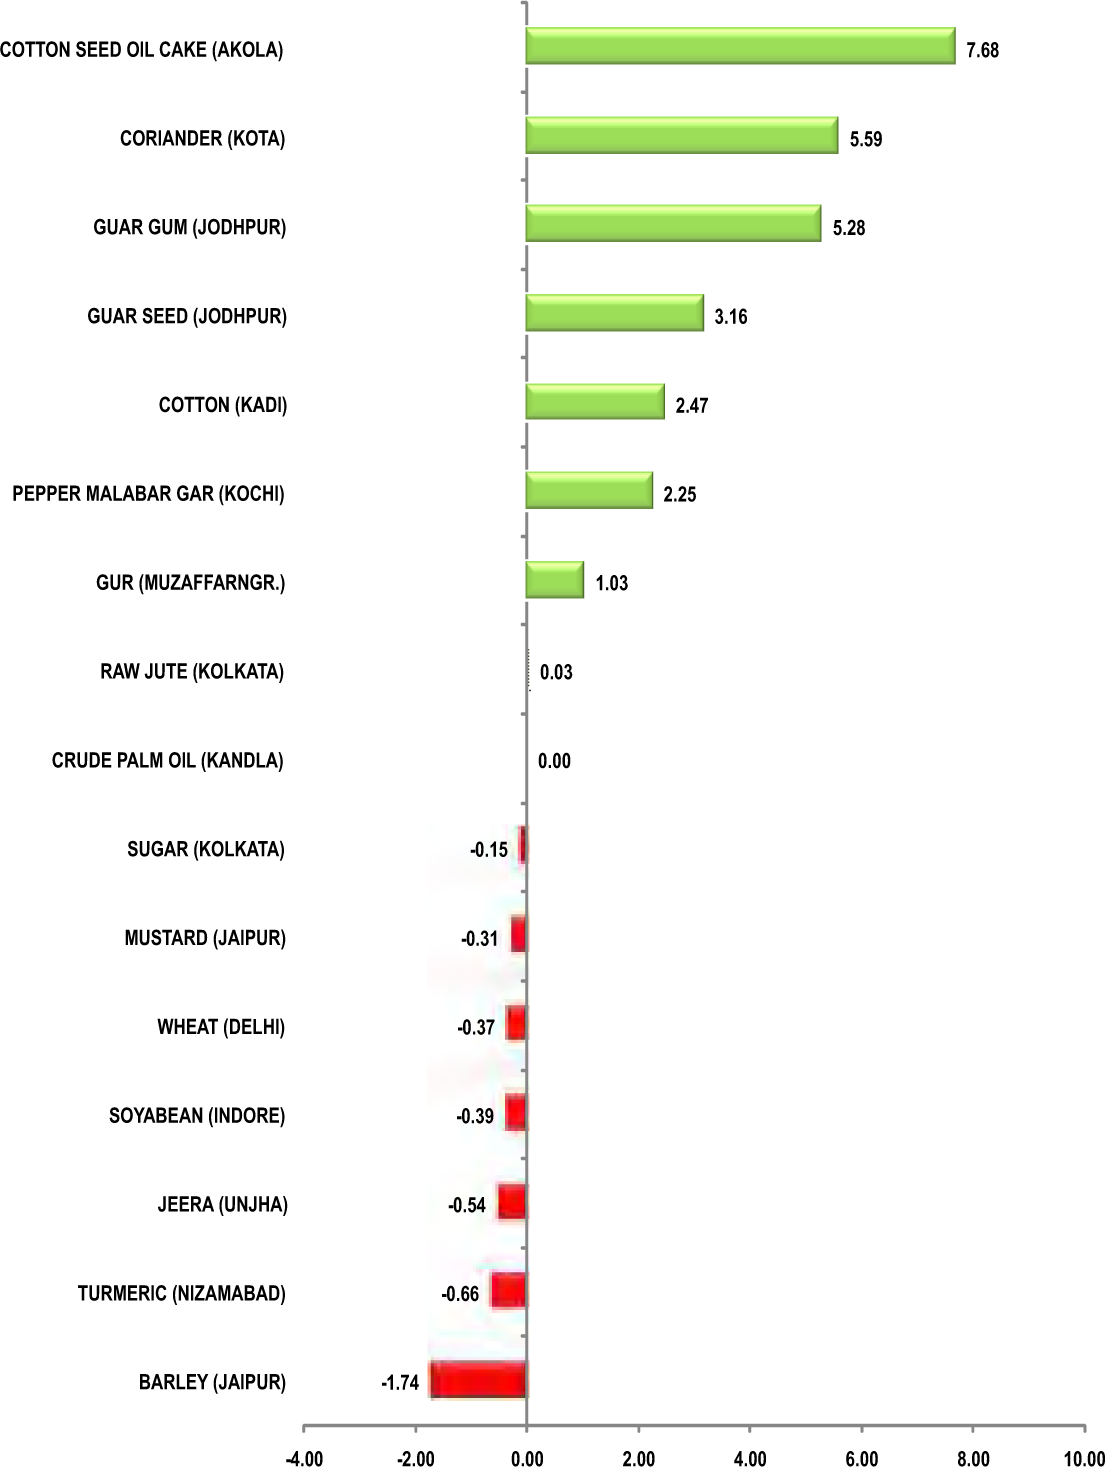
Oil seeds and edible counters were major victim of weak demand and most of them traded on weaker note. Malaysian palm oil futures slid for a sixth consecutive session on Wednesday to their lowest in three months on pressure from expectations of lower demand in top importer India and rising domestic production. World palm oil demand may suffer its first contraction in two decades during the 2019/20 crop year due to rising domestic oilseed supplies in India and slowing demand in Europe and China. Cotton saw strong rebound on lower production amid improved demand. Jeera and dhaniya showed some strength whereas turmeric and cardamom shed some previous gain.
|
|
12
|
|
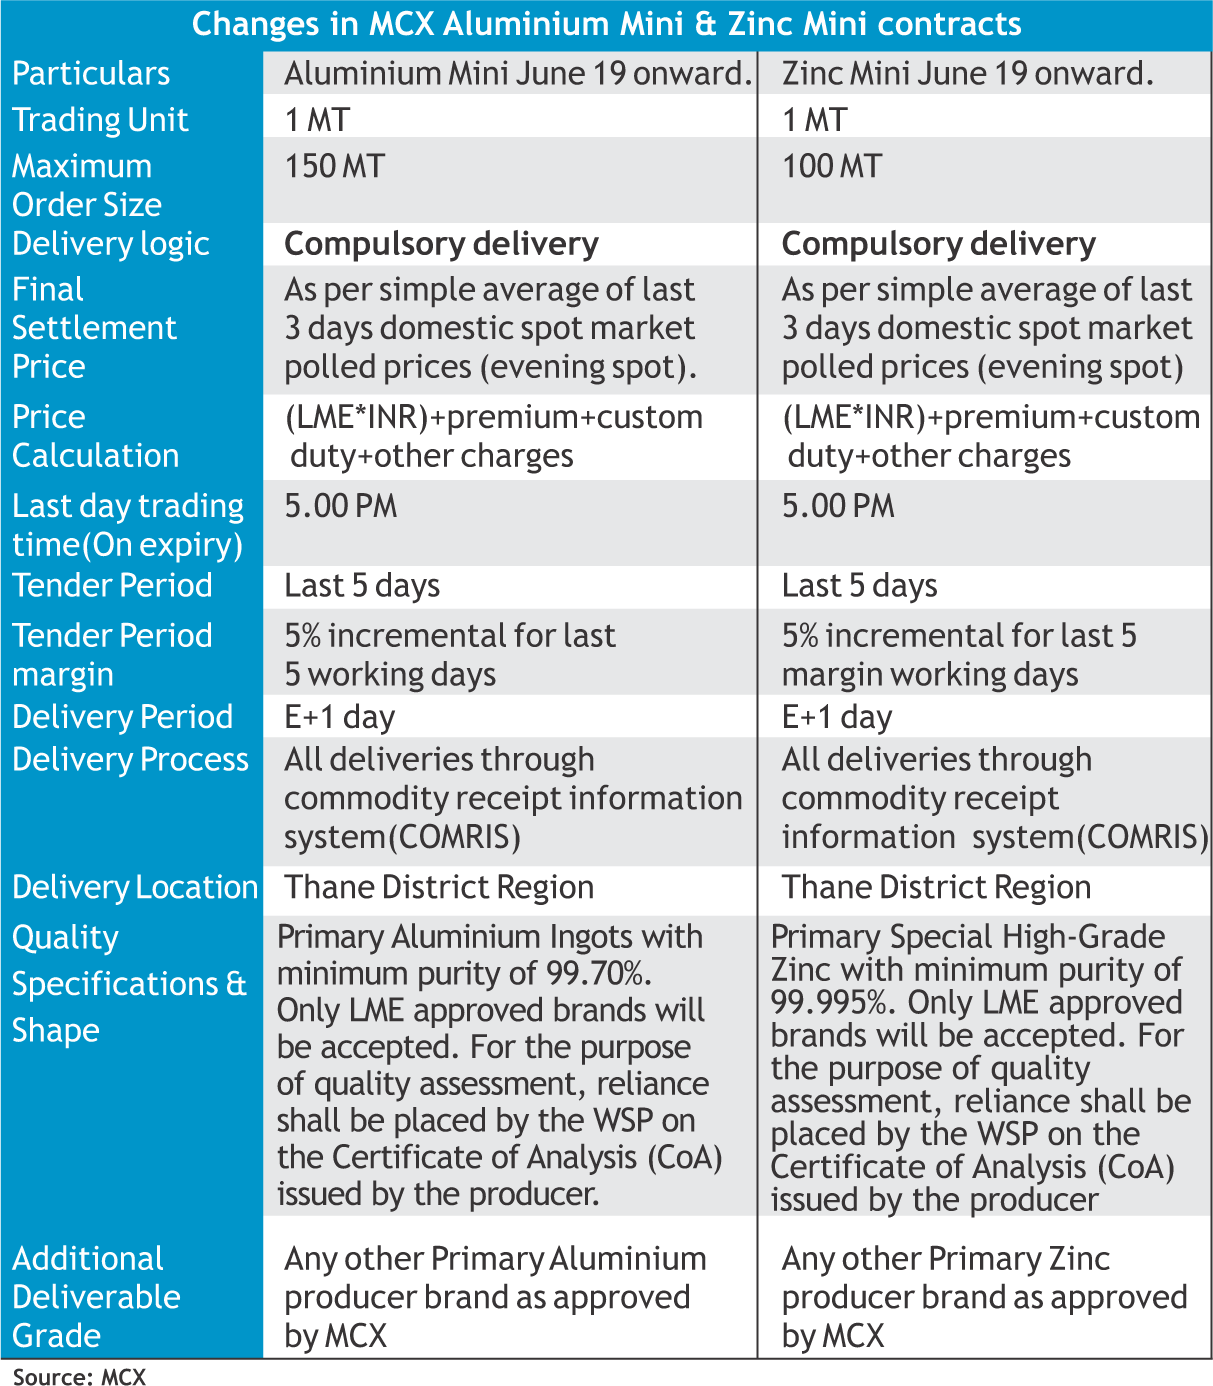
After great success of compulsory delivery in Aluminium & Zinc contracts, MCX, after receiving permission from SEBI, has also modified the contract specifications in Aluminium Mini and Zinc Mini contracts i.e. from “Both Options” (cash and delivery) to “Compulsory delivery". The revised contract specifications for the above mentioned contracts have been implemented w.e.f. March 8, 2019. The June & July 2019 contracts of both Aluminium Mini & Zinc Mini are available for trading.
Sebi has been emphasizing on physical delivery settlement because as Sebi wants to reduce the distinction between cash market and derivative market to control speculation & volatility in the market. India has been producing these commodities. So, physical settlement can be done in India. If contracts have to be settled by delivery, domestic prices will be needed. But after successful settlement and compulsory delivery in Aluminium & Zinc contracts, Sebi has taken steps to allow compulsory delivery in Mini contracts of these both commodities.
Benefit of compulsory delivery
• The main benefit of having compulsory delivery is that it will curb excessive speculation.
• Another benefit of having compulsory delivery will be that as of now the cash settlement of commodity contracts is based on LME prices. But now in Zinc and Aluminium they will be based on local prices and also factor in taxes, freight and warehousing costs.
• Commodity derivatives are also hedging tool for those holding actual commodity, while speculators who traded without holding the underlying commodity impart liquidity to the counter by taking on the risk of the hedger.
|
13
|
|
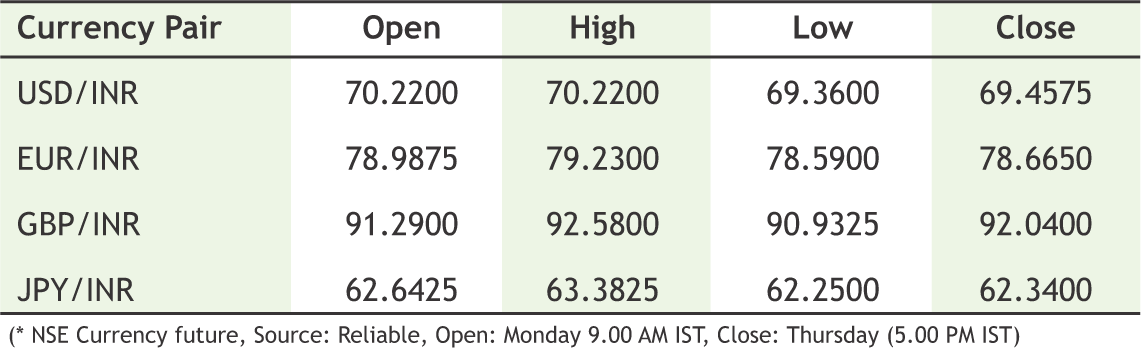
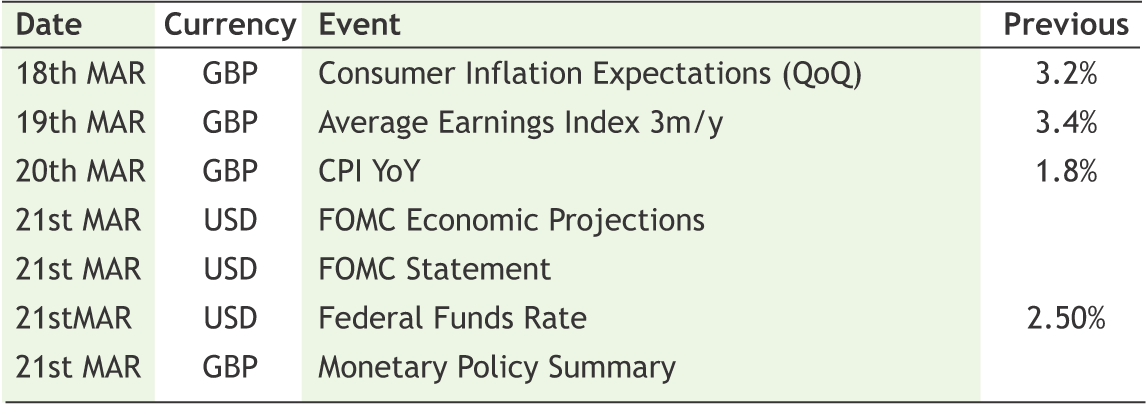
It was a great week for Indian Rupee amid record FIIs flows into equity. So far FIIs pumped in Rs 14,807 Crs in March till date surpassed last month in-flows of Rs 13,564 in equity. Recent move by RBI for Dollar swapping leads to an alternative route to inject liquidity into the system avoiding the conventional way via OMOs bond purchases. RBI will engage with BUY/SELL swap with banks. March 26th 2019 is scheduled for auction to inject Rs 35,000 crs in the system. It will be negative for Bonds as RBI infused liquidity through OMOs purchases – the conventional way of injecting liquidity. Forward premia will certainly shrink. The swap arrangement will open window to buy short end and sell longer end. Importer will be comfortable for lower premium and exporter has to chase forward premiums. On the global arena, Brexit has created world attraction after series of voting session went by in House of Commons. So far Article 50 – Notification for departure of UK from EU on 29th March 2019 has been extended to atleast June. Sterling swung since Withdrawal Agreement to Extension of Article 50. Euro slightly retraced from its recent lows against a Dollar after subdued economic data from US. Going forward FOMC rate decision and policy guidance this week will bring more colors to FX market. USDINR is likely to stay within the range of 68.60 and 69.50.
| 11th MAR | U.S. retail sales unexpectedly rose in January by 0.2 percent, lifted by an increase in purchases of building materials and discretionary spending. |
| 12th MAR | Indian CPI-based retail inflation rose 2.57% in February, compared with a median estimate of 2.4% |
| 12th MAR | UK Parliament voted for withdrawal agreement. Theresa May lost by 391-242 |
| 13th MAR | UK Parliament voted for No-Deal. Theresa May got mandate by 312- 308 |
| 14th MAR | UK Parliament voted for extension of Article 50. Lower house voted by 412-202 to ask the EU to push back UK’s departure to at least June 30. |

USD/INR (APR) contract closed at 69.5475 on 28th Mar’ 19. The contract made its high of 69.6375 on 28th Mar’19 and a low of 69.1150 on 26th Mar’ 18 (Weekly Basis). The 14-day Exponential MovingAverage oftheUSD/INR is currently at 69.68
On the daily chart, the USD/INR has Relative Strength Index (14-day) value of 37.51. One can buy above 69.60 for the target of 70.20 with the stop loss of 69.30.

EUR/INR (APR) contract closed at 78.42 on 28th Mar’ 19. The contract made its high of 78.76 on 25th Mar’19 and a low of 78.07 on 28th Mar’19 (Weekly Basis). The 14-day Exponential Moving Average of the EUR/INR is currently at 79
On the daily chart, EUR/INR has Relative Strength Index (14-day) value of 50.50. One can sell at 78.70 for a target of 78.10 with the stop loss of 79.
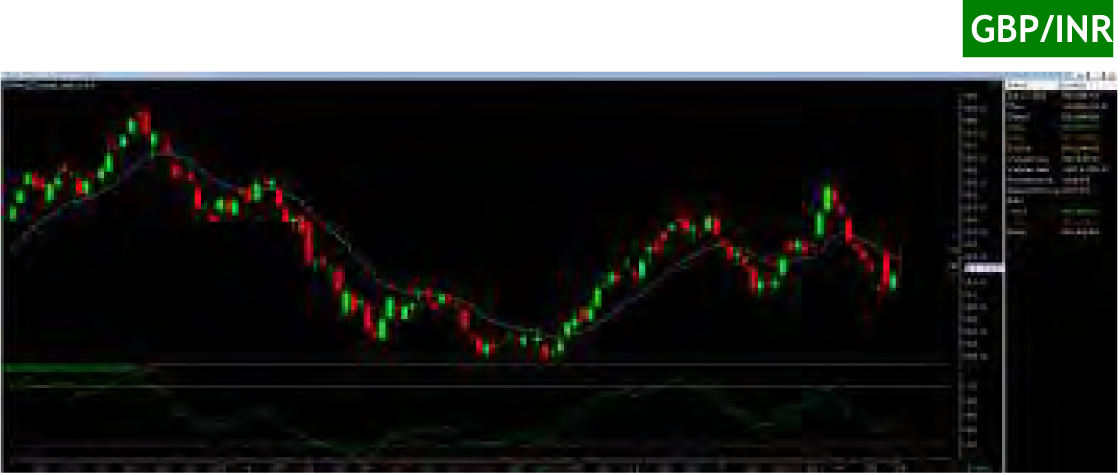
GBP/INR (APR) contract closed at 91.5675 on 28th Mar’ 19. The contract made its high of 92 on 26th Mar’19 and a low of 91.09 on 28th Mar’18 (Weekly Basis). The 14-day Exponential Moving Average of the GBP/INR is currently at 91.98
On the daily chart, GBP/INR has Relative Strength Index (14-day) value of 50.74. One can buy above 91.30 for a target of 91.90 with the stop loss of 91.

JPY/INR (APR) contract closed at 63.2125 on 28th Mar’ 19. The contract made its high of 63.5475 on 25th Mar’19 and a low of 62.7350 on 27th Mar’19 (Weekly Basis). The 14-day Exponential MovingAverage ofthe JPY/INR is currently at 63.03
On the daily chart, JPY/INR has Relative Strength Index (14-day) value of 53.93. One can buy at 62.80 for a target of 63.40 with the stop loss of 62.50.
14
15
|
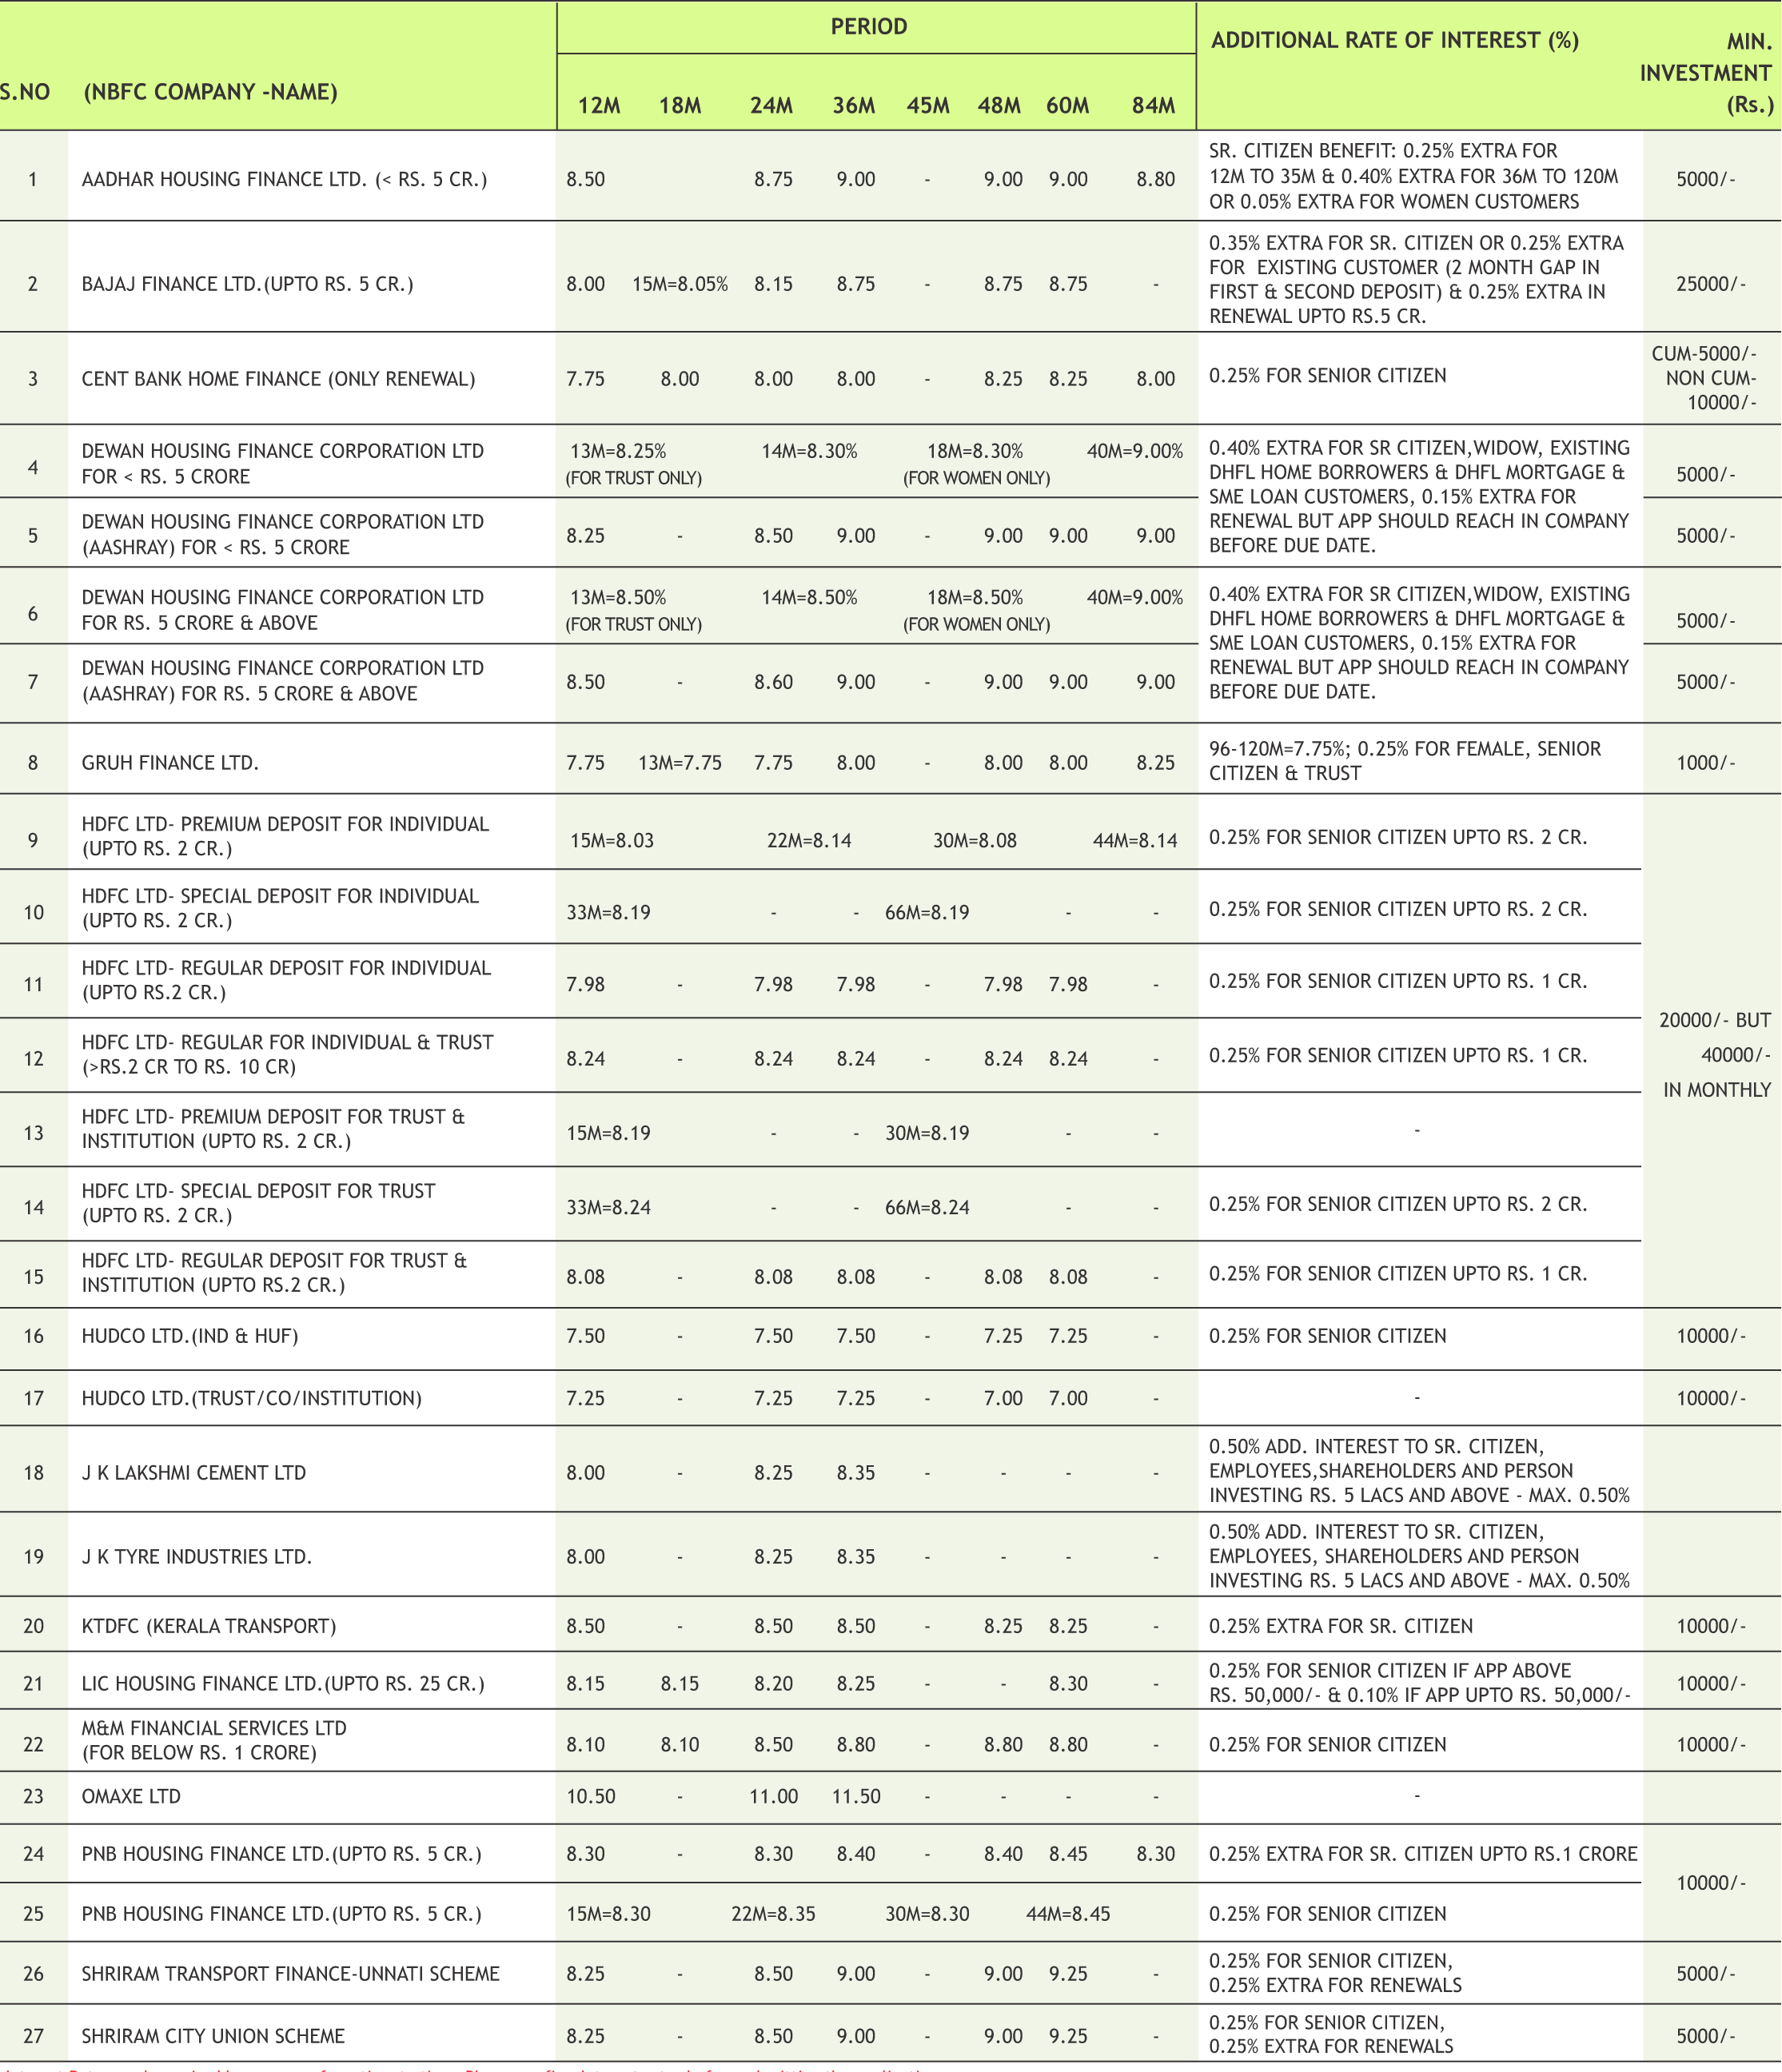
* Interest Rate may be revised by company from time to time. Please confirm Interest rates before submitting the application.
* For Application of Rs.50 Lac & above, Contact to Head Office.
* Email us at fd@smcindiaonline.com

16
|
|
|
|
|
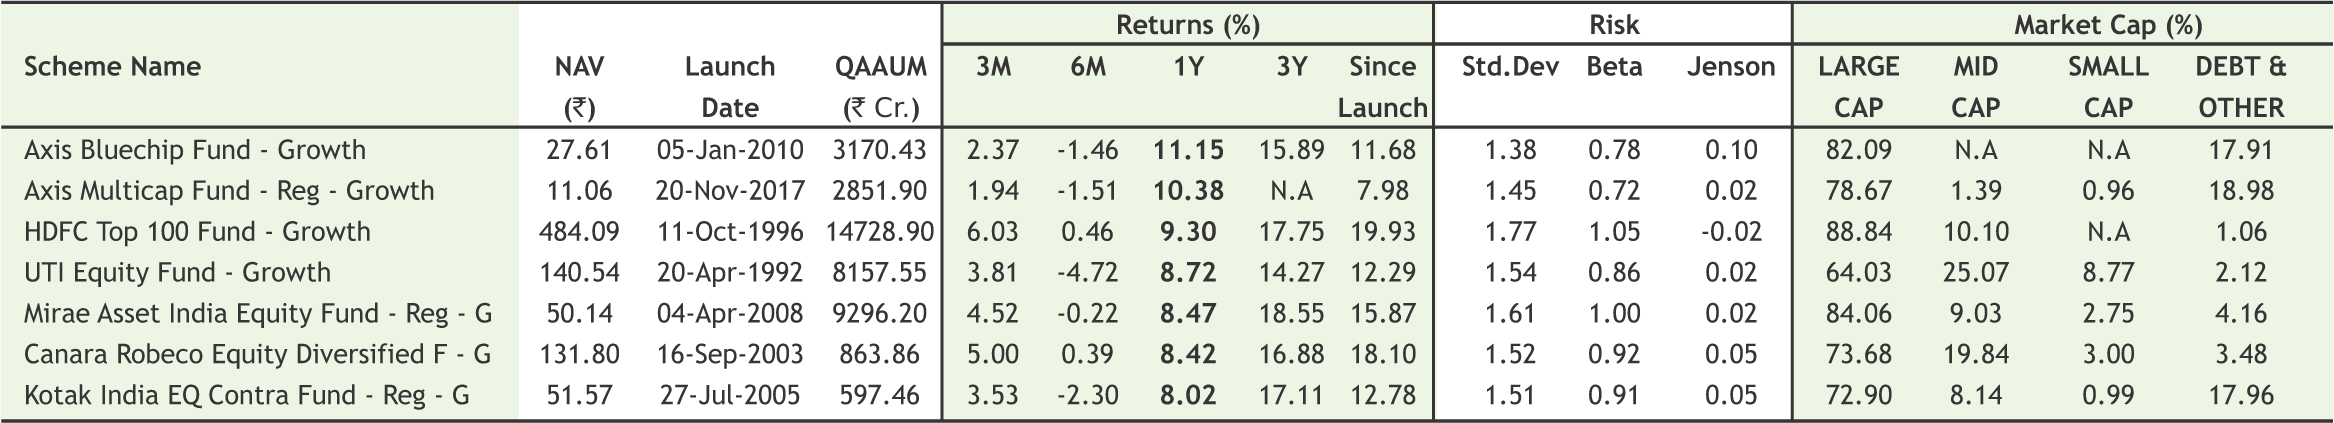
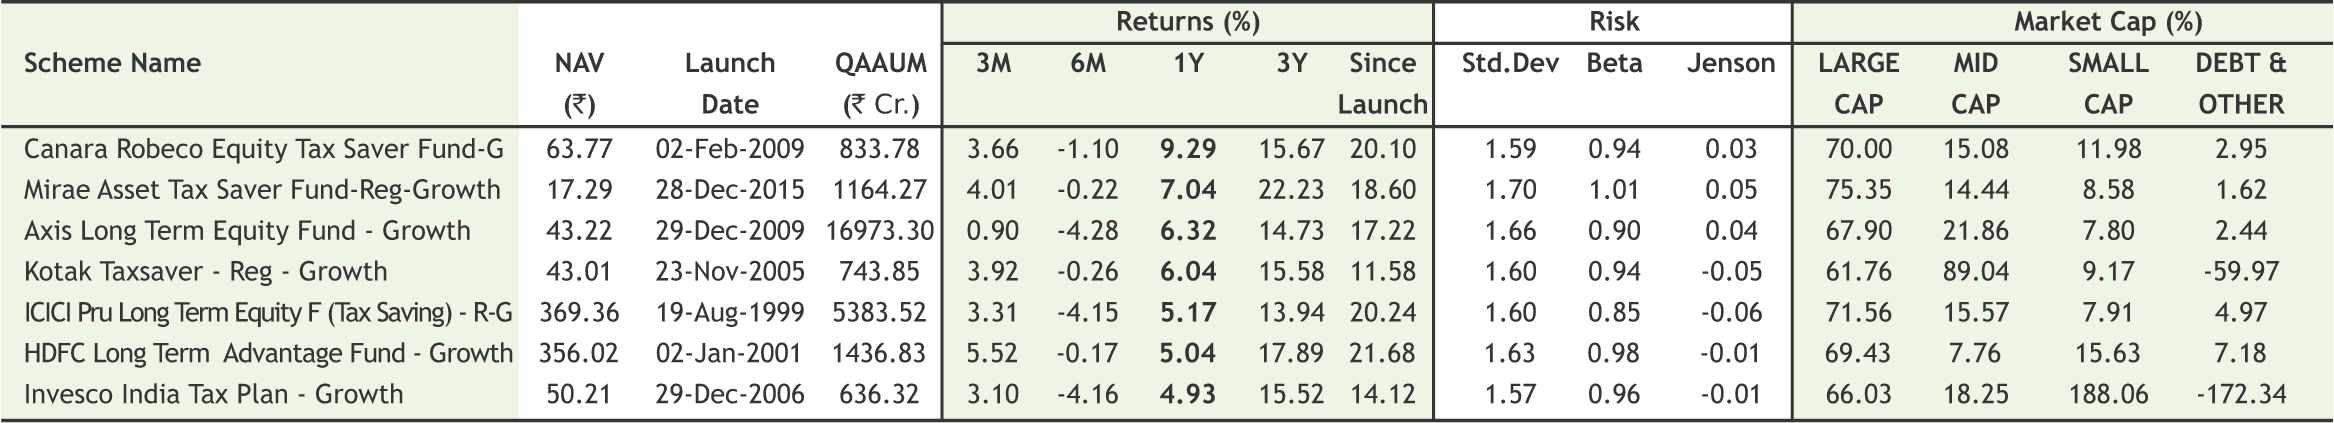
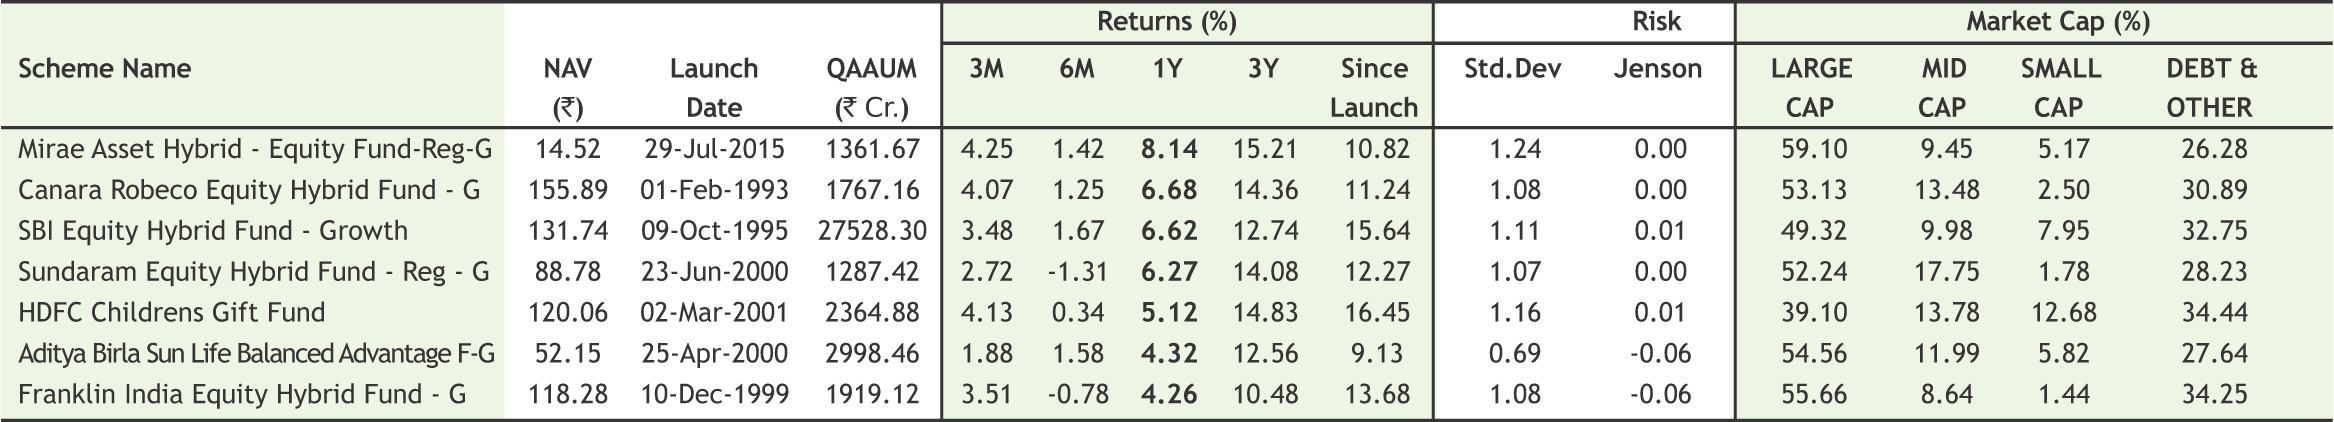
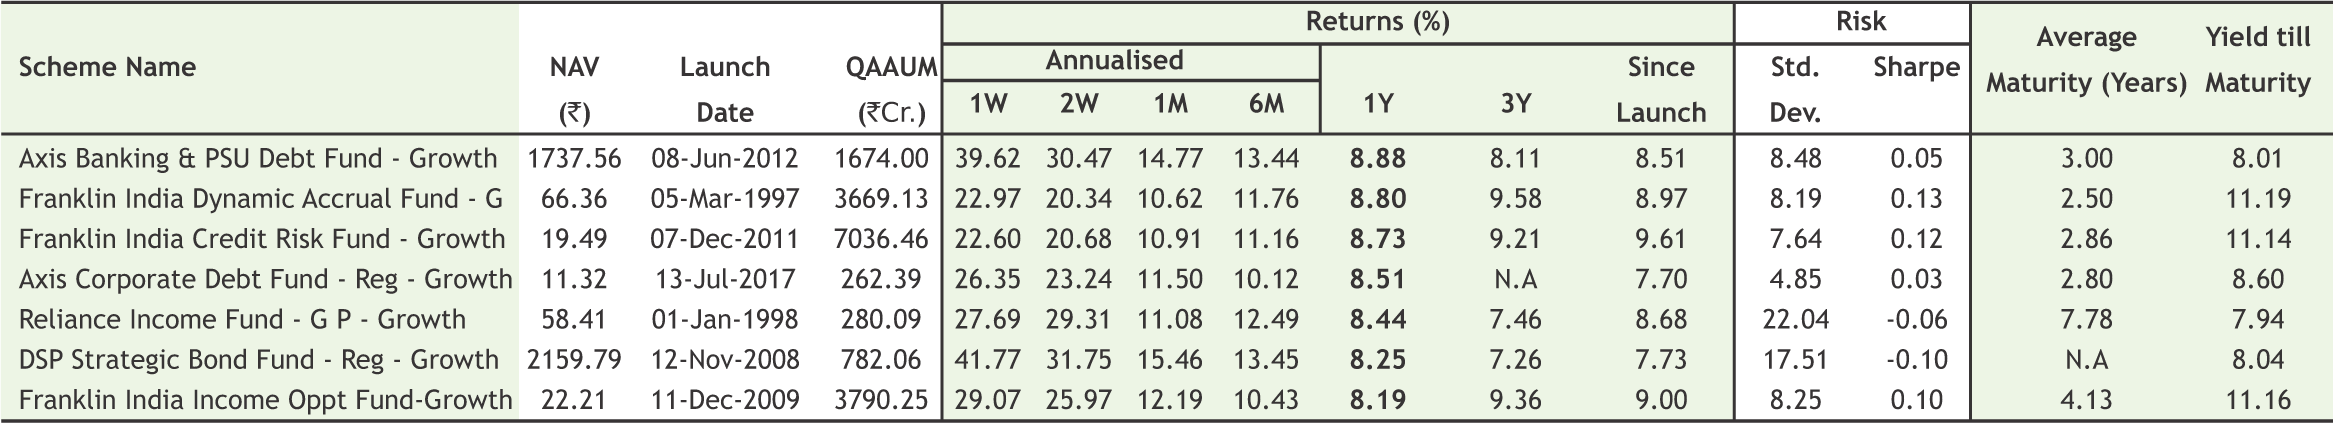
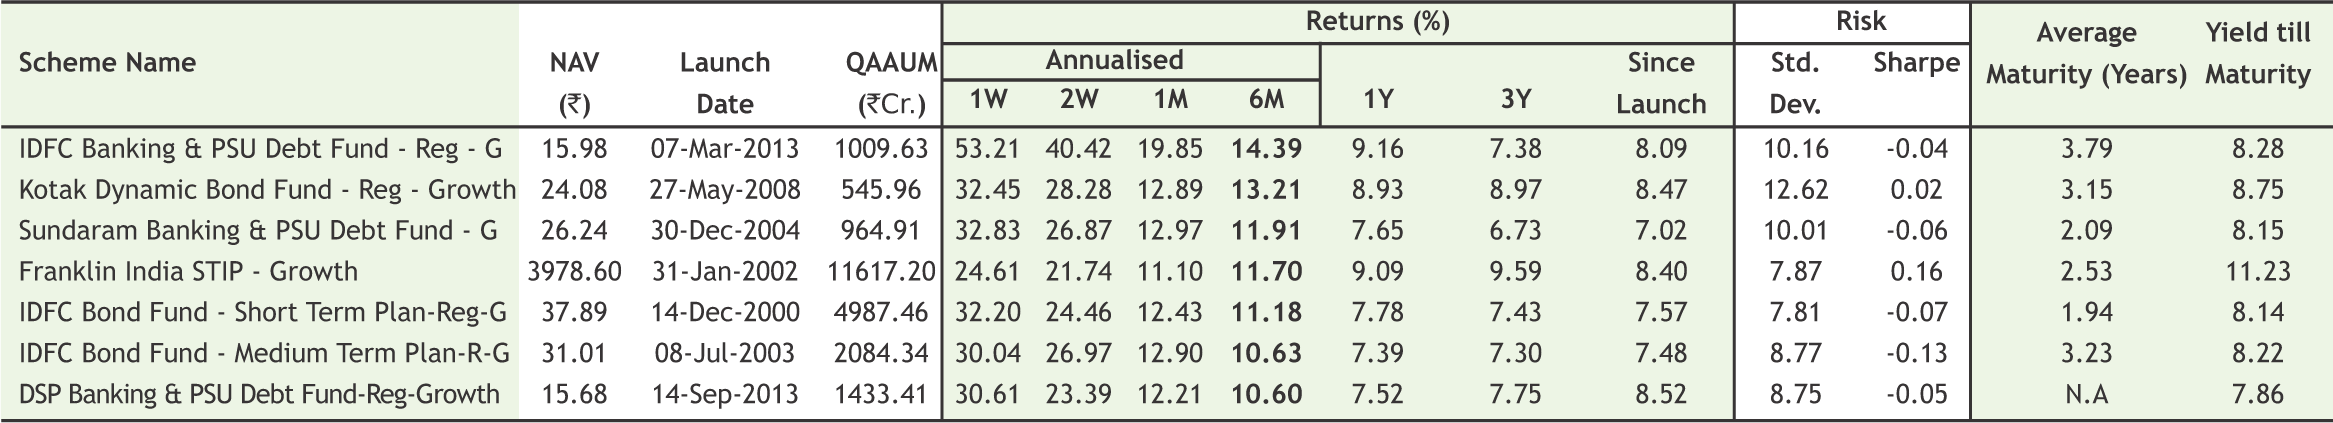
Note:Indicative corpus are including Growth & Dividend option . The above mentioned data is on the basis of 08/08/2019 Beta, Sharpe and Standard Deviation are calculated on the basis of period: 1 year, frequency: Weekly Friday, RF: 7%
*Mutual Fund investments are subject to market risks, read all scheme related documents carefully
17

Mr. D K Aggarwal (CMD, SMC Investments & Senior VP – PHD Chamber of Commerce) with H.E. Shri Dinkar Srivastava (Former Ambassador of India to Iran) (on Left) and Shri Alphons Kannanthanam (Hon’ble Union Minister of State for Tourism (IC), Govt. Of India) (on Right) at New Delhi.

Glimpse of International Women’s Day Celebration held on Friday, 8th March, 2019 at different Offices of SMC.


REGISTERED OFFICES:
11 / 6B, Shanti Chamber, Pusa Road, New Delhi 110005. Tel: 91-11-30111000, Fax: 91-11-25754365
MUMBAI OFFICE:
Lotus Corporate Park, A Wing 401 / 402 , 4th Floor , Graham Firth Steel Compound, Off Western Express Highway, Jay Coach Signal, Goreagon (East) Mumbai - 400063
Tel: 91-22-67341600, Fax: 91-22-67341697
KOLKATA OFFICE:
18, Rabindra Sarani, Poddar Court, Gate No-4,5th Floor, Kolkata-700001 Tel.: 033 6612 7000/033 4058 7000, Fax: 033 6612 7004/033 4058 7004
AHMEDABAD OFFICE :
10/A, 4th Floor, Kalapurnam Building, Near Municipal Market, C G Road, Ahmedabad-380009, Gujarat
Tel : 91-79-26424801 - 05, 40049801 - 03
CHENNAI OFFICE:
Salzburg Square, Flat No.1, III rd Floor, Door No.107, Harrington Road, Chetpet, Chennai - 600031.
Tel: 044-39109100, Fax -044- 39109111
SECUNDERABAD OFFICE:
315, 4th Floor Above CMR Exclusive, BhuvanaTower, S D Road, Secunderabad, Telangana-500003
Tel : 040-30031007/8/9
DUBAI OFFICE:
2404, 1 Lake Plaza Tower, Cluster T, Jumeriah Lake Towers, PO Box 117210, Dubai, UAE
Tel: 97145139780 Fax : 97145139781
Email ID : pankaj@smccomex.com
smcdmcc@gmail.com
Printed and Published on behalf of
Mr. Saurabh Jain @ Publication Address
11/6B, Shanti Chamber, Pusa Road, New Delhi-110005
Website: www.smcindiaonline.com
Investor Grievance : igc@smcindiaonline.com
Printed at: S&S MARKETING
102, Mahavirji Complex LSC-3, Rishabh Vihar, New Delhi - 110092 (India) Ph.: +91-11- 43035012, 43035014, Email: ss@sandsmarketing.in