2020 : Issue 719, Week : 20th - 24th January
A Weekly Update from SMC (For private circulation only)
WISE M NEY
NEY


2020 : Issue 719, Week : 20th - 24th January
A Weekly Update from SMC (For private circulation only)
NEY


![]() Customized Plans
Customized Plans
![]() Comprehensive Investment Solutions
Comprehensive Investment Solutions
![]() Long-term Focus
Long-term Focus
![]() Independent & Objective Advise
Independent & Objective Advise
![]() Financial Planning
Financial Planning
Call Toll-Free 180011 0909
Visit www.smcindiaonline.com
| Equity | 4-7 |
| Derivatives | 8-9 |
| Commodity | 10-13 |
| Currency | 14 |
| IPO | 15 |
| FD Monitor | 16 |
| Mutual Fund | 17-18 |
I
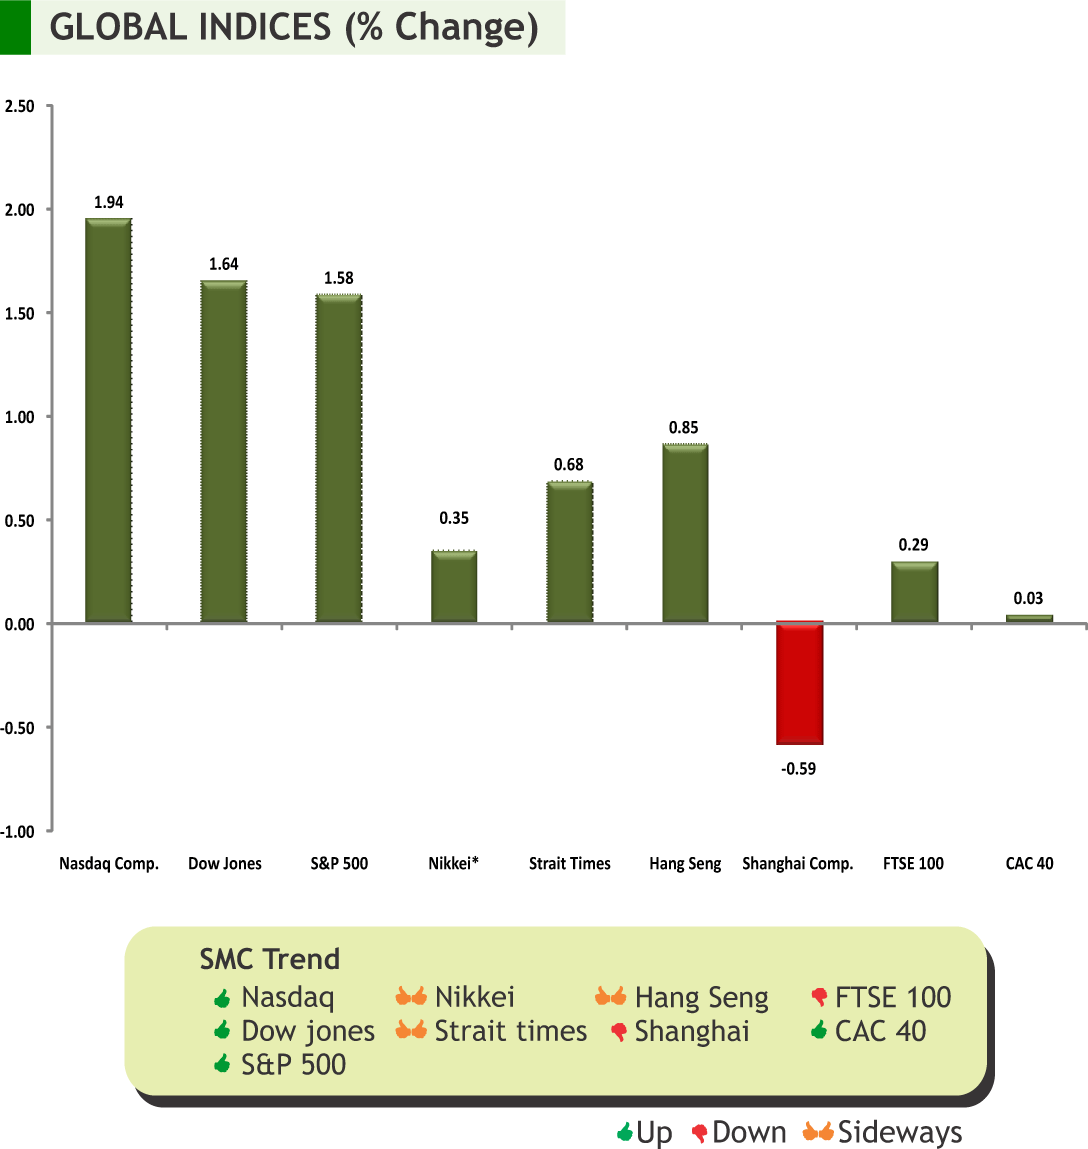
n the week gone by, global markets gained strength as risk appetite buying picked up after sealing of an initial U.S.-China trade deal and Senate approval of a new trade deal between the U.S., Mexico and Canada, and upbeat economic data.The news that the U.S. would remove China from a list of countries that it considers as currency manipulators after the signing of the phase one trade deal boosted the Chinese market as well. Economic expansion in China for the quarter ending December 2019 came at lowest rate since 1990 at 6.1 percent. Many economists have warned of risks involving unemployment, depressed consumer spending and private investment and growing financial risksin the Chinese economy.
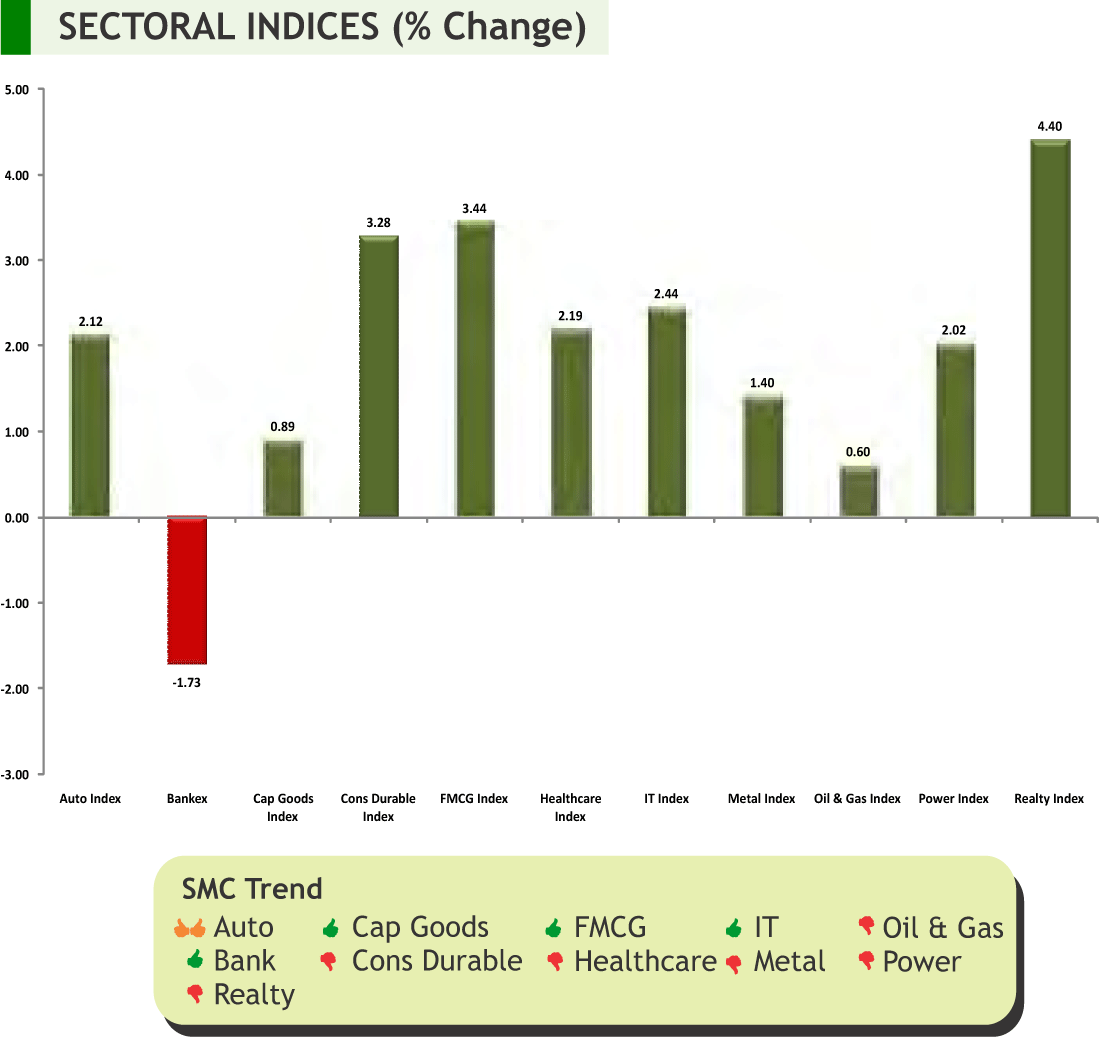
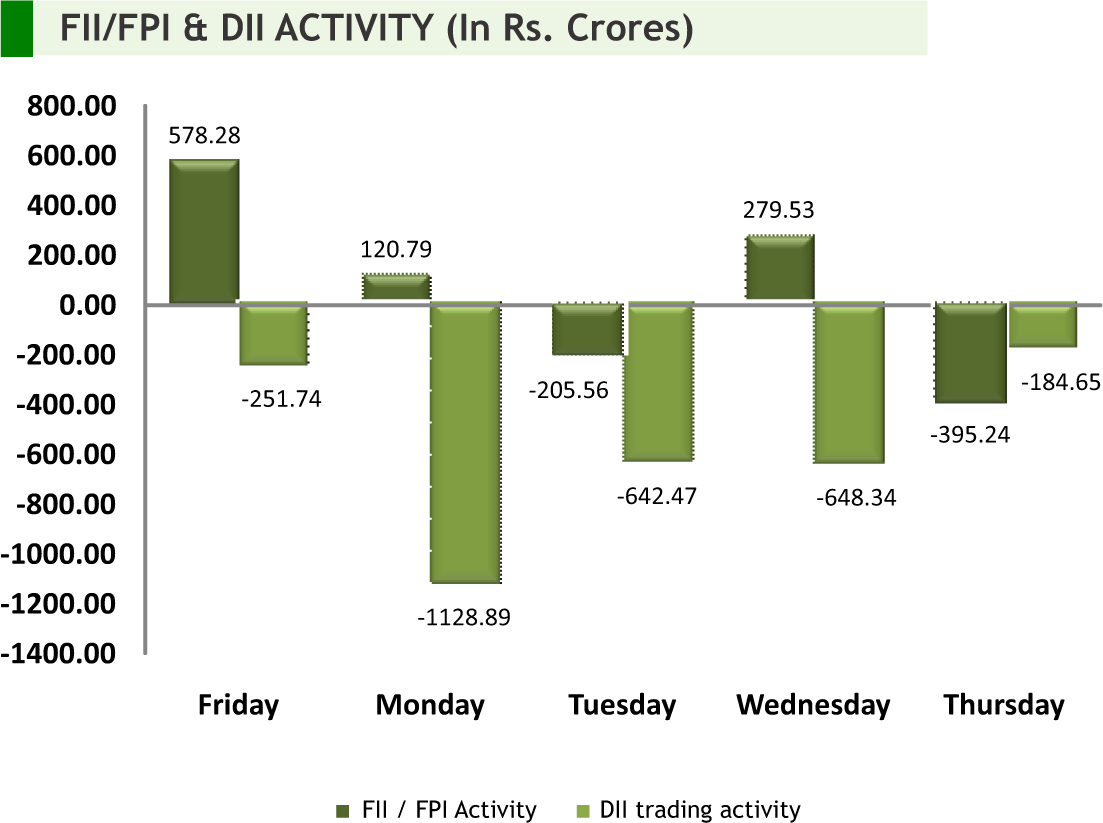
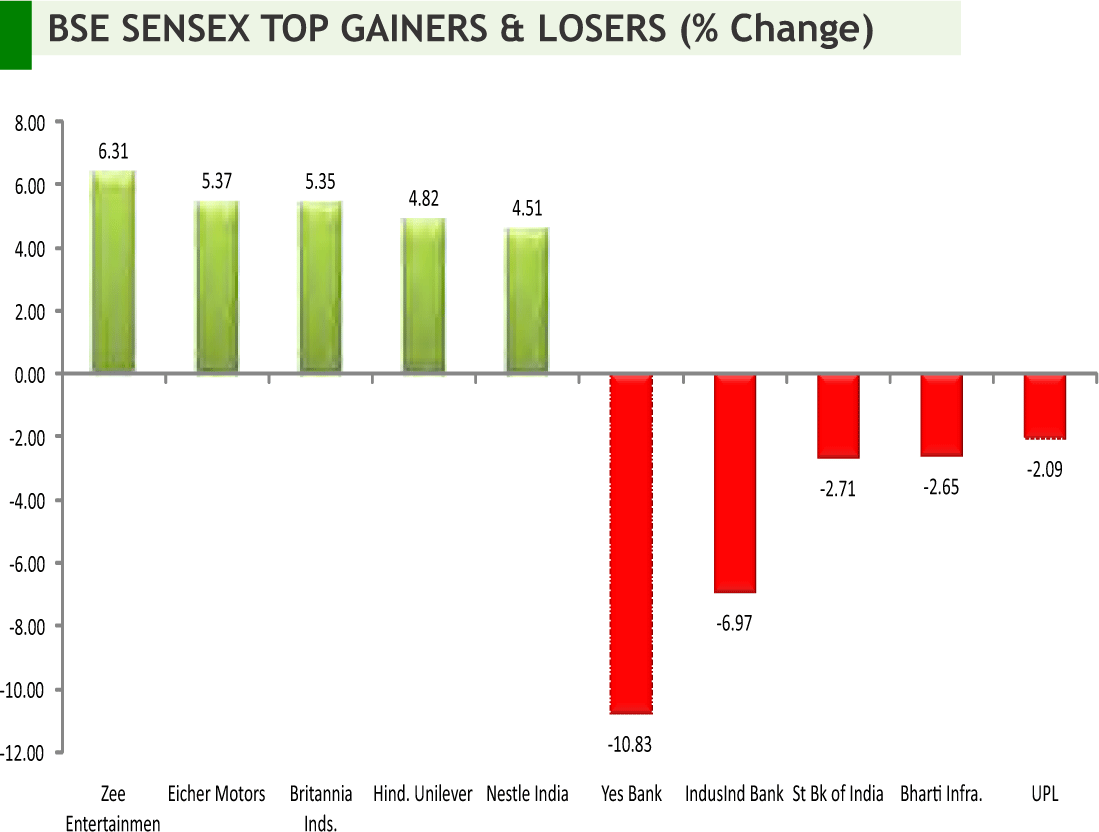
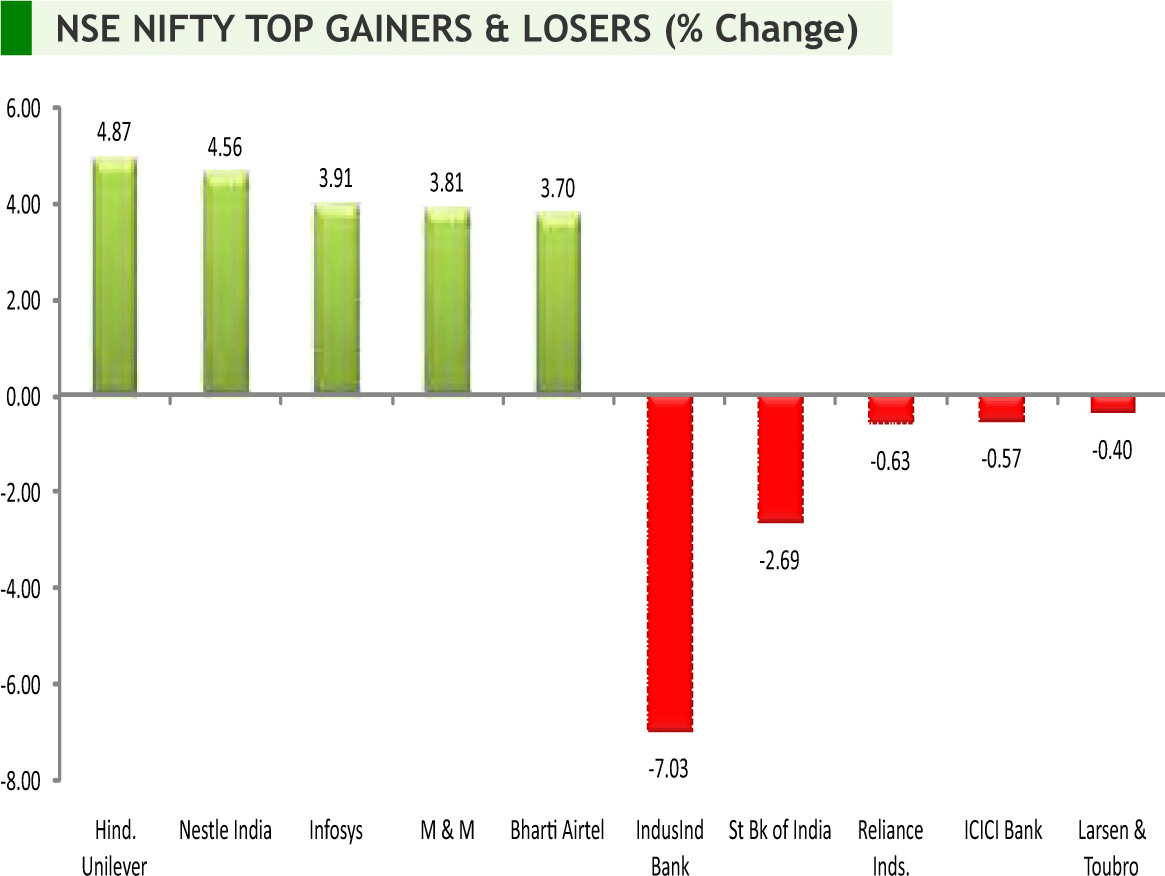
Back at home, domestic market witnessed mixed movements on sustained buying by foreign players, expectation of announcement of more initiatives in the upcoming budget amid weak macro-economic data. Also fall in crude oil prices lifted some sentiments to some extent. However, dismissal of review petitionsfiled by Bharti Airtel and Vodafone Ideato seek relief on interest and penalty payments in connection to the verdict on AGR weighed on the market sentiments. On the data front, retail inflation soared to a five and a half year high of 7.35% in December 2019. While the latest IIP numbers come as a relief to the market and policymakers, as the activity in the industry sector showed some traction; it grew at 1.8 per cent in November on the back of improving manufacturing sector. We will continue to see stock specific movement in the market as we are in the result session. Besides, the upcoming budget, crude oil prices, mood of the foreign participants, Rupee movement amid other factor will continue to dictate the trend of the market going forward. Any dips in the run-up to the Budget could be used as a buying opportunity.
On the commodities front, Action was missed in commodities market despite the sign of first phase deal between US and China. Dollar index faced resistance near 97.5 and from there it saw fall. Bullion counter noticed lacklustre trade as safe haven buying diminished on first phase trade deal amid receding fear of war between Iran and US. BOJ 10-Yr Yield Target, BOJ Rate Decision, Euro-Zone ZEW Survey, German ZEW Survey Expectations, Bank of Canada Rate Decision ¸CPI of Canada, Unemployment Rate of Australia, ECB Rate Decision, CPI of Newzeland and Japan etc are loads of important triggers for commodity trade.

SMC Global Securities Ltd. (hereinafter referred to as “SMC”) is a registered Member of National Stock Exchange of India Limited, Bombay Stock Exchange Limited and its associate is member of MCX stock Exchange Limited. It is also registered as a Depository Participant with CDSL and NSDL. Its associates merchant banker and Portfolio Manager are registered with SEBI and NBFC registered with RBI. It also has registration with AMFI as a Mutual Fund Distributor.
SMC is a SEBI registered Research Analyst having registration number INH100001849. SMC or its associates has not been debarred/ suspended by SEBI or any other regulatory authority for accessing /dealing in securities market.
SMC or its associates including its relatives/analyst do not hold any financial interest/beneficial ownership of more than 1% in the company covered by Analyst. SMC or its associates and relatives does not have any material conflict of interest. SMC or its associates/analyst has not received any compensation from the company covered by Analyst during the past twelve months. The subject company has not been a client of SMC during the past twelve months. SMC or its associates has not received any compensation or other benefits from the company covered by analyst or third party in connection with the research report. The Analyst has not served as an officer, director or employee of company covered by Analyst and SMC has not been engaged in market making activity of the company covered by Analyst.
The views expressed are based solely on information available publicly available/internal data/ other reliable sources believed to be true.
SMC does not represent/ provide any warranty express or implied to the accuracy, contents or views expressed herein and investors are advised to independently evaluate the market conditions/risks involved before making any investment decision.
DOMESTIC NEWS
Economy
• India's wholesale prices rose at a faster-than-expected rate in December. The wholesale price index rose 2.59 percent year-on-year in December, following a 0.58 percent increase in November.
• India's consumer price inflation accelerated in December driven by higher food prices. Inflation increased notably to 7.35 percent from 5.54 percent in November. In the same period last year, inflation was 2.11 percent.
Pharmaceuticals
• Alembic Pharmaceuticals has received tentative approval from the US Food & Drug Administration (USFDA) for its Abbreviated New Drug Application (ANDA) Empagliflozin Tablets, 10 mg and 25 mg. The approved ANDA is therapeutically equivalent to the reference listed drug product (RLD) Jardiance Tablets, 10 mg and 25 mg, of Boehringer lngelheim Pharmaceuticals, Inc. (Boehringer). Emapgliflozin Tablets are indicated as an adjunct to diet and exercise to improve glycemic control in adults with type 2 diabetes mellitus.
• Strides Pharma Science has received approval from the US health regulator for Loratadine Softgel Capsules, a medication typically used to treat allergies. In a filing to BSE Strides said its "step-down whollyowned subsidiary, Strides Pharma Global Pte Ltd, Singapore, has received approval for Loratadine Softgel Capsules, 10 mg (OTC) from the United States Food & Drug Administration (USFDA).
• Sun Pharmaceuticals Industries has entered into a licensing agreement with US-based Rockwell Medical to commercialise Triferic -- an iron replacement and haemoglobin maintenance drug -- in India.
• Wockhardt has become the first Indian pharmaceutical company to get the drug regulator's nod for two novel antibiotics, which it plans to launch in the next few months in the domestic market.
Telecom
• Reliance Jio has become the largest telecom player with 36.9 crore mobile subscribers in November 2019. Vodafone Idea reported a total mobile subscriber base of 33.62 crore and Bharti Airtel at 32.73 crore customers for November 2019. Total telephone subscribers in the country declined by 2.4 per cent to 117.58 crore in November from 120.48 crore in October.
Information Technology
• Wipro Ventures, the strategic investment arm of Wirpo, announced the closing of its $150 million Fund ll. Buoyed by the success of its first $100 million fund launched in 2015, Wipro Ventures will continue to invest in early to mid-stage companies building innovative enterprise software solutions across key areas, including cybersecurity, application development, analytics, cloud infrastructure, test automation, and AI.
Realty/ Construction
• Capacite Infraprojects has received order from lntegrated Unit (P.W ) Division for a contract value of Rs 407.16 crore (excluding GST) for Construction of Multi-Storey super specialty Hospital Building at Sir J J Hospital Campus on EPC Mode at Byculla, Mumbai.
Hotel
• Lemon Tree Hotels announced the opening of hotel in Rishikesh, Uttarakhand, under the Company's brand 'Lemon Tree Premier', located on the bank of holy Ganges. The hotel features 65 wellappointed rooms and suites, a multi-cuisine coffee shop-Citrus Café, banquet facilities, spa etc.
INTERNATIONAL NEWS
US business inventories dipped by 0.2 percent in November after inching up by a revised 0.1 percent in October. Economists had expected inventories to edge down by 0.1 percent compared to the 0.2 percent increase originally reported for the previous month.
• US retail sales climbed by 0.3 percent in December, matching the upwardly revised increase in November. Economists had expected retail sales to rise by 0.3 percent compared to the 0.2 percent uptick originally reported for the previous month.
• US initial jobless claims fell to 204,000, a decrease of 10,000 from the previous week's unrevised level of 214,000. The drop came as a surprise to economists, who had expected jobless claims to inch up to 216,000.
• US producer price index for final demand inched up by 0.1 percent in December after coming in unchanged in November. Economists had expected prices to rise by 0.2 percent. The uptick in producer prices was partly due to a jump in energy prices, which surged up by 1.5 percent in December after climbing by 0.6 percent in November.
• Eurozone's house prices climbed 4.1 percent year-on-year in the third quarter, after a 4.3 percent rise in the second quarter. On a quarterly basis, house prices rose 1.4 percent in the third quarter, slower than the 1.7 percent increase in the preceding quarter.
• UK inflation slowed to 1.3 percent in December, while it was forecast to remain unchanged at 1.5 percent. This was the lowest since November 2016.
| Stocks | *Closing Price | Trend | Date Trend Changed | Rate Trend Changed | SUPPORT | RESISTANCE | Closing S/l |
|---|---|---|---|---|---|---|---|
| S&P BSE SENSEX | 41945 | UP | 08.02.19 | 36546 | 36300 | 35300 | |
| NIFTY50 | 12352 | UP | 08.02.19 | 10944 | 10900 | 10600 | |
| NIFTY IT | 16357 | UP | 21.07.17 | 10712 | 15200 | 14800 | |
| NIFTY BANK | 31591 | UP | 30.11.18 | 26863 | 27700 | 27000 | |
| ACC | 1512 | DOWN | 04.10.19 | 1488 | 1520 | 1540 | |
| BHARTIAIRTEL | 500 | UP | 15.03.19 | 338 | 460 | 445 | |
| BPCL | 454 | UP | 30.08.19 | 355 | - | 450 | |
| CIPLA | 480 | UP | 25.10.19 | 460 | 450 | 440 | |
| SBIN | 318 | UP | 01.11.19 | 314 | 315 | 305 | |
| HINDALCO | 210 | UP | 13.12.19 | 208 | 200 | 194 | |
| ICICI BANK | 532 | UP | 20.09.19 | 418 | 510 | 500 | INFOSYS | 768 | UP | 20.12.19 | 732 | 730 | 710 |
| ITC | 240 | DOWN | 31.05.19 | 279 | 260 | 270 | |
| L&T | 1304 | DOWN | 15.11.19 | 1378 | 1360 | 1380 | |
| MARUTI | 7520 | UP | 27.12.19 | 7345 | 7150 | 7050 | |
| NTPC | 121 | DOWN | 16.08.19 | 118 | 120 | 124 | |
| ONGC | 125 | DOWN | 06.12.19 | 127 | 136 | 141 | |
| RELIANCE | 1581 | UP | 16.08.19 | 1278 | 1530 | 1500 | |
| TATASTEEL | 495 | UP | 01.11.19 | 396 | 450 | 440 | |
Closing as on 17-01-2020
NOTES:
1) These levels should not be confused with the daily trend sheet, which is sent every morning by e-mail in the name of "Morning Mantra ".
2) Sometimes you will find the stop loss to be too far but if we change the stop loss once, we will find more strength coming into the stock. At the moment, the stop loss will be far as we are seeing the graphs on weekly basis and taking a long-term view and not a short-term view.
| Meeting Date | Company name | Purpose |
|---|---|---|
| 20-01-2020 | Kotak Mah. Bank | Quarterly Results |
| 20-01-2020 | Federal Bank | Quarterly Results |
| 21-01-2020 | ICICI Pru Life | Quarterly Results |
| 22-01-2020 | Asian Paints | Quarterly Results |
| 22-01-2020 | Larsen & Toubro | Quarterly Results |
| 22-01-2020 | Axis Bank | Quarterly Results |
| 23-01-2020 | Canara Bank | Quarterly Results |
| 23-01-2020 | PVR | Quarterly Results |
| 23-01-2020 | Biocon | Quarterly Results |
| 24-01-2020 | JSW Steel | Quarterly Results |
| 24-01-2020 | Bank of Baroda | Quarterly Results |
| 24-01-2020 | UltraTechCem. | Quarterly Results |
| 25-01-2020 | ICICI Bank | Quarterly Results |
| 27-01-2020 | H D F C | Quarterly Results & Others |
| 27-01-2020 | Dr Reddy's Labs | Quarterly Results |
| 27-01-2020 | Torrent Pharma. | Quarterly Results,Interim Dividend & Others |
| 28-01-2020 | Century Textiles | Quarterly Results |
| 28-01-2020 | Cummins India | Quarterly Results,Interim Dividend |
| 28-01-2020 | Maruti Suzuki | Quarterly Results |
| 29-01-2020 | UTata Power Co. | Quarterly Results |
| 29-01-2020 | Godrej Consumer | Quarterly Results,Interim Dividend |
| 29-01-2020 | NIIT Tech. | Quarterly Results |
| 29-01-2020 | Bajaj Finserv | Quarterly Results |
| 30-01-2020 | Colgate-Palm. | Quarterly Results |
| 30-01-2020 | Dabur India | Quarterly Results |
| 30-01-2020 | I O C L | Quarterly Results |
| 30-01-2020 | Marico | Quarterly Results,Interim Dividend |
| 31-01-2020 | Hind. Unilever | Quarterly Results |
| 31-01-2020 | St Bk of India | Quarterly Results |
4
5
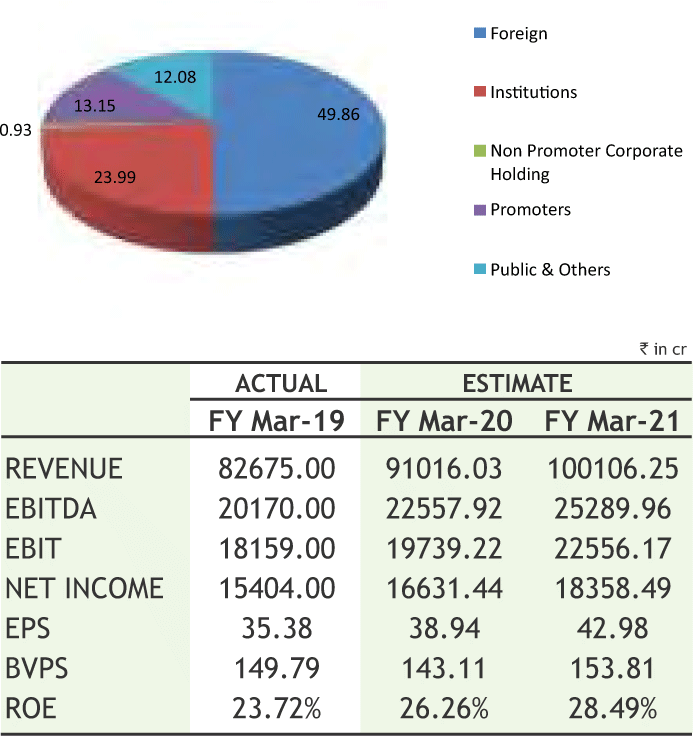
INFOSYS LIMITED
CMP: 766.85
Target Price: 861
Upside: 12
| Face Value(Rs.) | 5.00 |
| 52 Week High/Low | 847.40/615.00 |
| M.Cap (Rs. in Cr.) | 326573.53 |
| EPS (Rs.) | 38.28 |
| P/E Ratio (times) | 20.04 |
| P/B Ratio (times) | 5.37 |
| Dividend Yield (%) | 2.87 |
| Stock Exchange | BSE |
Investment Rationale
• I nfosys is a leading provider of consulting, technology, outsourcing and next-generation digital services, enabling clients to execute strategies for their digital transformation.
• The company has increased its FY 20 revenue guidance to 10.0%-10.5% in constant currency from 9%-10% in constant currency given at the end of Q2FY20. The company however maintained its FY20 operating margin guidance range of 21%-23%.
• The management of the company expects steel demand to grow 5% in FY20 and should pick-up in H2FY20 on account of measures announced by Government. Moreover, it expects spreads for H2FY20 to be better on the back of lower input prices and bottomed-out steel prices.
• Large deal wins so far this year continue to be robust with growth of 56% yoy at USD 7.4 billion compared to corresponding previous period. Large deal signings in Q3FY20 stood at USD 1.8 billion. Total number of new deals won stood at 14 out of which 7 in BFS, 2 each in Communications and manufacturing, 1 each in retail, energy/utilities and others. In geography wise 8 from North America, 5 from Europe and 1 from ROW.
• Digital revenue in Q3FY20 registered a strong 40.8% yoy growth in CC basis. Digital revenue as % of total revenue stood increased to 40.6% compared to 38.3% in Sep 2019 and 31.5% in Dec 2018 quarter. However the core revenue in CC basis was down by 5%. Thus the overall CC growth in revenue was 9.5%yoy in Q3FY20.
• The company has added 84 new clients during Q3FY20 compared to 96 numbers in Q2FY20 and 101 clients in Q3FY19. Thus total number of active clients increased to 1384 as end of Dec 31, 2019 compared to 1364 numbers and 1251 numbers in Q2FY20 and Q3FY19 end.
• Utilization including trainees for Q3FY20 stood at 80.4% and that excluding trainees stood at 84.4% compared to 81.6% and 84.9% in Q2FY20. Software employee count of the company as end of Dec 31, 2019 stood at 229658 numbers compared to 222851 numbers in Sep 2019.
• The company has done a thorough and rigorous investigation into the whistleblower allegations which have been previously disclosed to stock exchanges on October 22, 2019 and the investigation found the allegations are unsubstantiated. The point by point basis the allegation has been answered and the management was not found guilty and the Board has full confident in the management.
Risk
• • Trimming of IT costs by Clients
• Margin erosion due to escalated offshore staff cost
Valuation
The management of the company remains reasonably optimistic about growth prospects due to increase in win rate and increase in large deal pipeline. These deals will help incentivize its multi-gate servicing capabilities through digital platforms and enhance presence in Europe. Growth in retail is driven by large deal wins, and differentiation on digital deals. Thus it is expected that the stock will see a price target of Rs. 861 in 8-10 months time frame on current PE multiple of 20.04 times and FY21E EPS of Rs. 42.98.
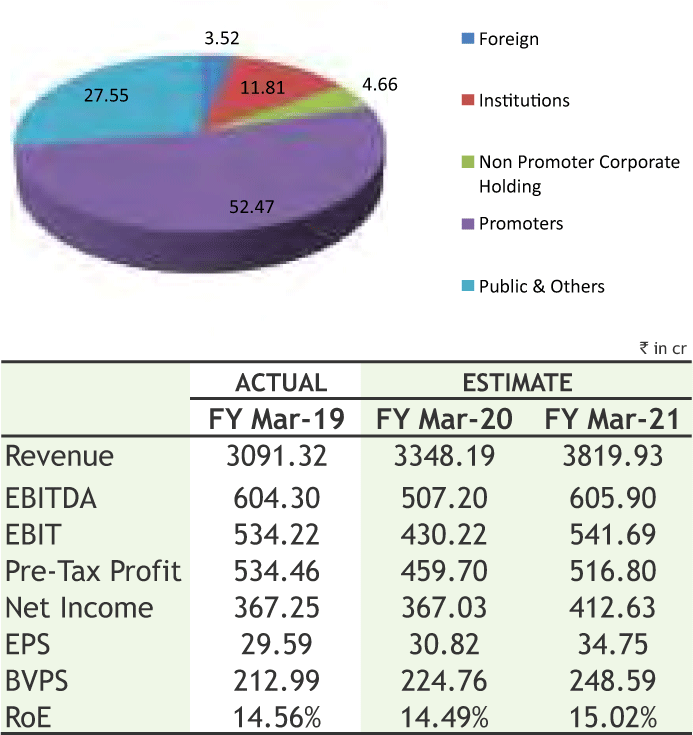
VARDHMAN TEXTILE LIMITED
CMP: 573.90
Target Price: 653
Upside: 14%
| Face Value (Rs.) | 10.00 |
| 52 Week High/Low | 635.00/440.00/td> |
| M.Cap (Rs. in Cr.) | 7122.10 |
| EPS (Rs.) | 28.49 |
| P/E Ratio (times) | 20.14 |
| P/B Ratio (times) | 2.94 |
| Dividend Yield (%) | 1.74 |
| Stock Exchange | BSE |
Investment Rationale
• F inolex Industries Limited is a manufacturer of polyvinyl chloride (PVC) pipes and fittings, and PVC resins. The Company operates through polyvinyl chloride (PVC), Pipes & fittings and Power segments. The Company offers its products in categories, including Agricultural Pipes and Fittings, and Plumbing and Sanitation Pipes and Fittings.
• On the development front, PVC Resin manufacturing facility in Ratnagiri, set in technical collaboration with Uhde GmbH, Germany with Hoechst technology, provides a consistent supply of superior quality resin to its pipe manufacturing plants.
• The government has set aside Rs 3.5 lakh crore under the last-mile piped water connection project, called Nal se Jal. Increasing government investment in agriculture and related activities will augment the growth in PVC pipes and fittings market in India and growing problems of water shortage will also lead to increase in demand for PVC pipes and fittings.
• The company would be a major beneficiary from government’s focus on irrigation, providing piped water to all by 2024 and improvement in rural consumption in the long term. It is believed that the demand of PVC pipes from rural segment is expected to remain strong in the coming quarters based on strong monsoon season.
• Net profit of the company rose 31.4% to Rs 102.27 crore in the quarter ended September 2019 as against Rs 77.82 crore during the previous quarter ended September 2018. Sales rose 6.3% to Rs 576.67 crore in the quarter ended September 2019 as against Rs 542.62 crore during the previous quarter ended September 2018. The sales volume
for PVC Pipes & Fittings was at 48,024 MT in Q2FY20 higher by 6.1 % against 45,272 MT in Q2FY19.
Risk
• • Industry Risk : slowdown in demand for pipes
• Fluctuation in commodity prices
Valuation
The company has a healthy balance sheet with almost no debt on its books and robust return ratios amid healthy dividend payouts. According to the management of the company, demand from agriculture would pick driven by good monsoon and which would support to increase market share of plumbing pipes. GOI's newly unveiled focus on water infrastructure would doubtlessly spur volumes. It is India’s only PVC Company with such ‘backward integration’ and according to the management, it is well-placed to benefit from the country’s transformation. Thus, it is expected that the stock will see a price target of Rs.653 in 8 to 10 months time frame on one year average P/Ex of 18.79x and FY21 earnings of Rs.34.75.
Source: Company Website Reuters Capitaline
Above calls are recommended with a time horizon of 8 to 10 months.
6

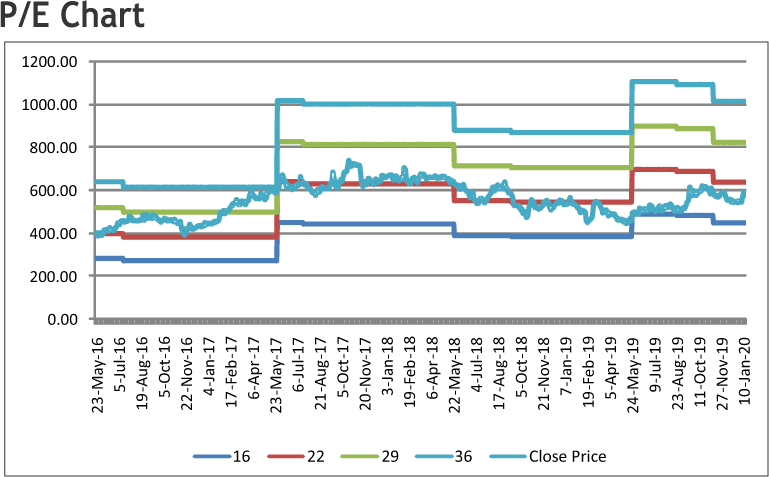
The stock closed at Rs 781.50 on 17th January 2020. It made a 52-week low of Rs 572.85 on 20th June 2019 and a 52-week high of Rs. 798.10 on 06th February 2019. The 200 days Exponential Moving Average (DEMA) of the stock on the daily chart is currently at Rs 700.82
As we can see on chart that stock is forming an “Inverted Head and Shoulder” pattern” on weekly charts which is bullish in nature. Last week, stock has given the breakout of same by registered gains over 6% and also has managed to close above the pattern breakout so buying momentum can continue for coming days. Therefore, one can buy in the range of 773-778 levels for the upside target of 840-850 levels with SL below 730 levels.
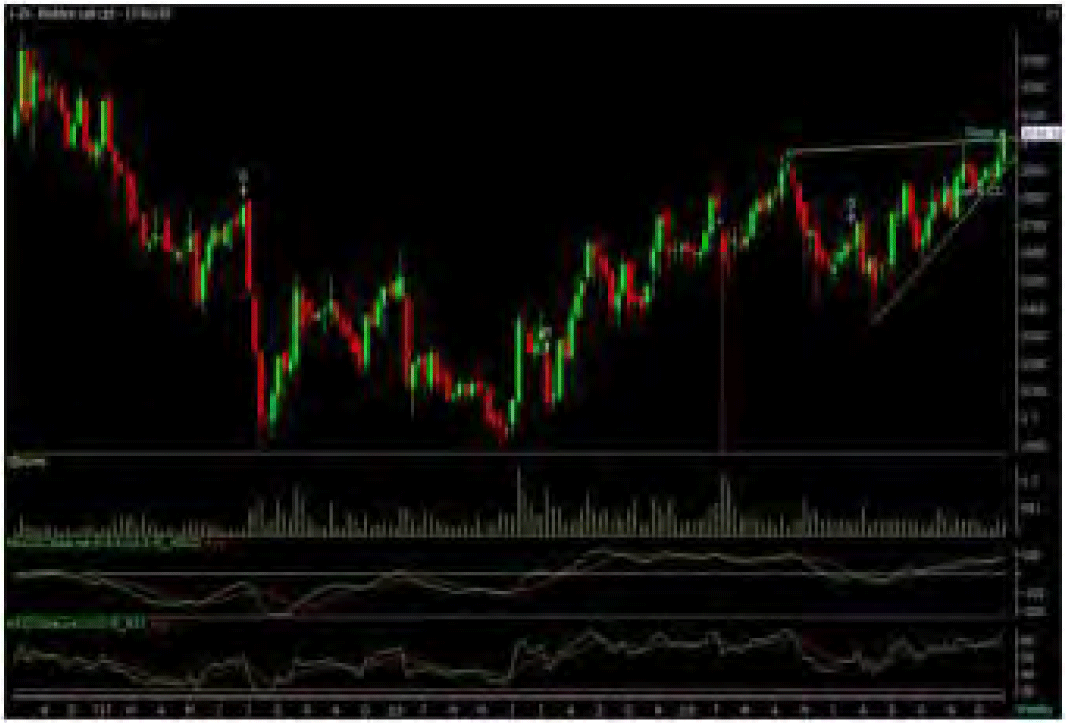
The stock closed at Rs 3034.35 on 17th January, 2020. It made a 52-week low at Rs 1872.95 on 15th February 2019 and a 52-week high of Rs. 3049 on 17th January 2020. The 200 days Exponential Moving Average (DEMA) of the stock on the daily chart is currently at Rs 2739.85
Short term, medium term and long term bias are looking positive for the stock as it is trading in higher highs and higher lows sort on charts. Overall, stock was formed a “ Triangle” pattern on weekly charts and has given the breakout of same during last week, so follow up buying can continue for coming days. Therefore, one can buy in the range of 2990-3010 levels for the upside target of 3200-3230 levels with SL below 2850 levels.
Disclaimer : The analyst and its affiliates companies make no representation or warranty in relation to the accuracy, completeness or reliability of the information contained in its research. The analysis contained in the analyst research is based on numerous assumptions. Different assumptions could result in materially different results.
The analyst not any of its affiliated companies not any of their, members, directors, employees or agents accepts any liability for any loss or damage arising out of the use of all or any part of the analysis research.
SOURCE: CAPITAL LINE
Charts by Spider Software India Ltd
Above calls are recommended with a time horizon of 1-2 months
7
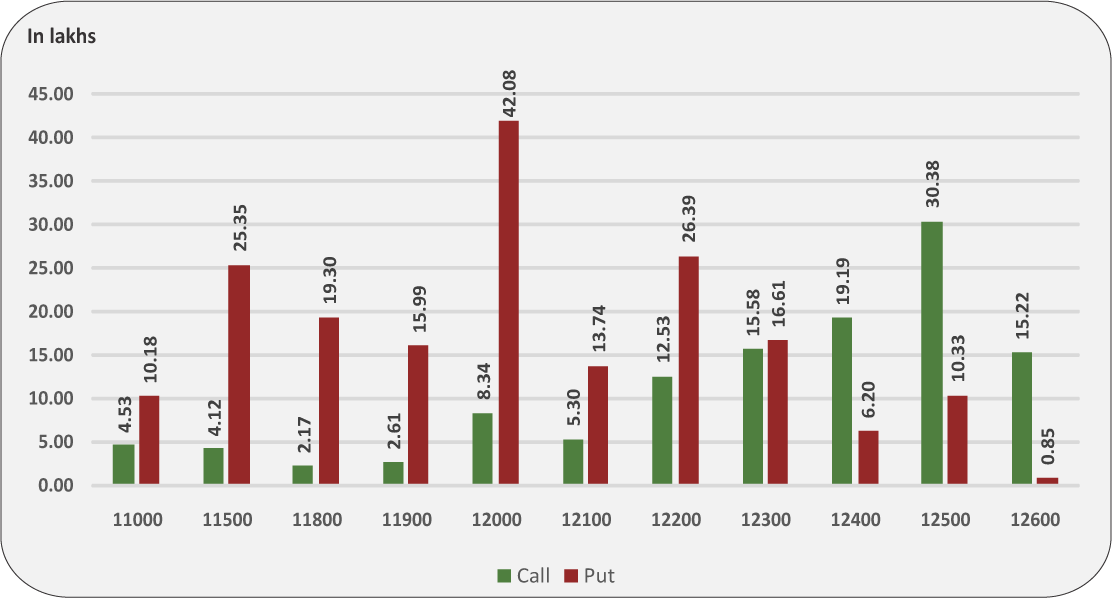
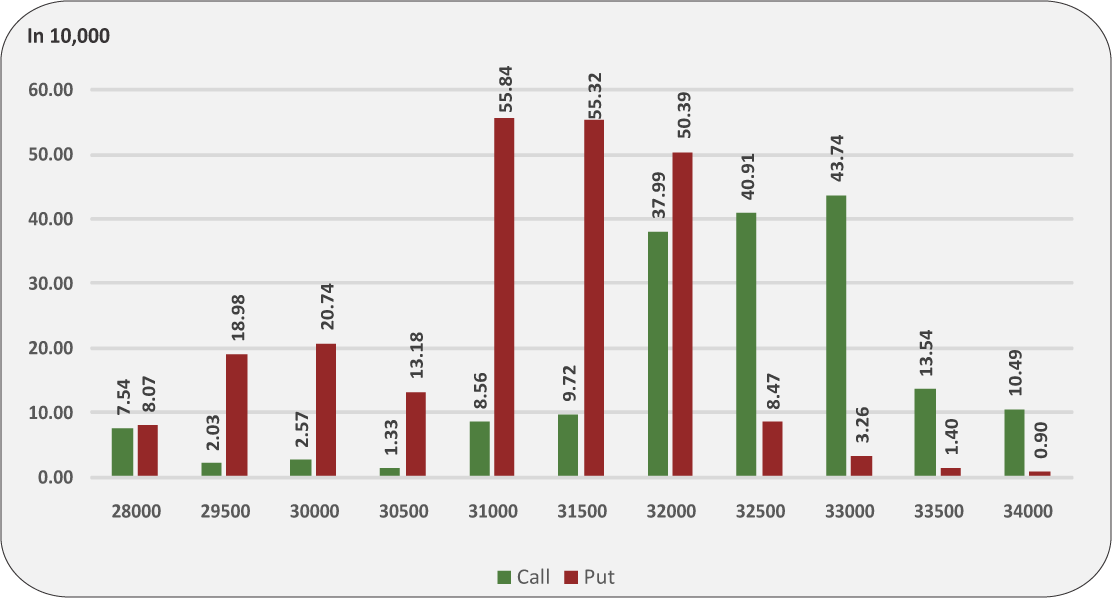
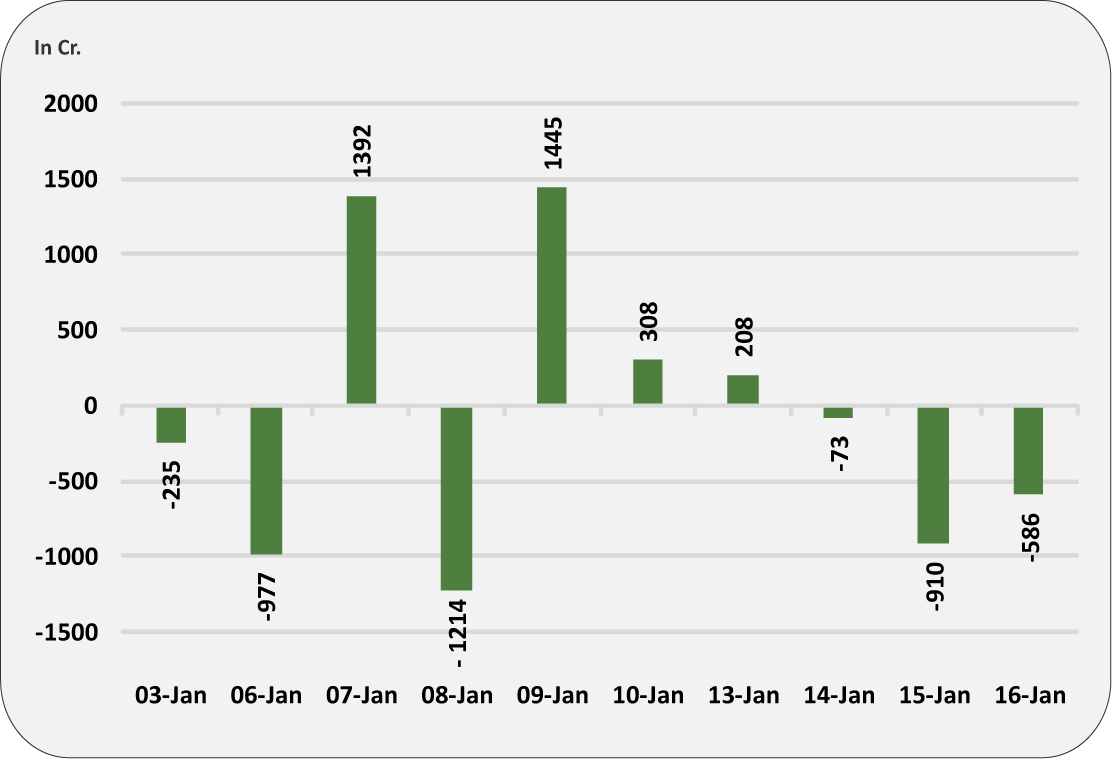
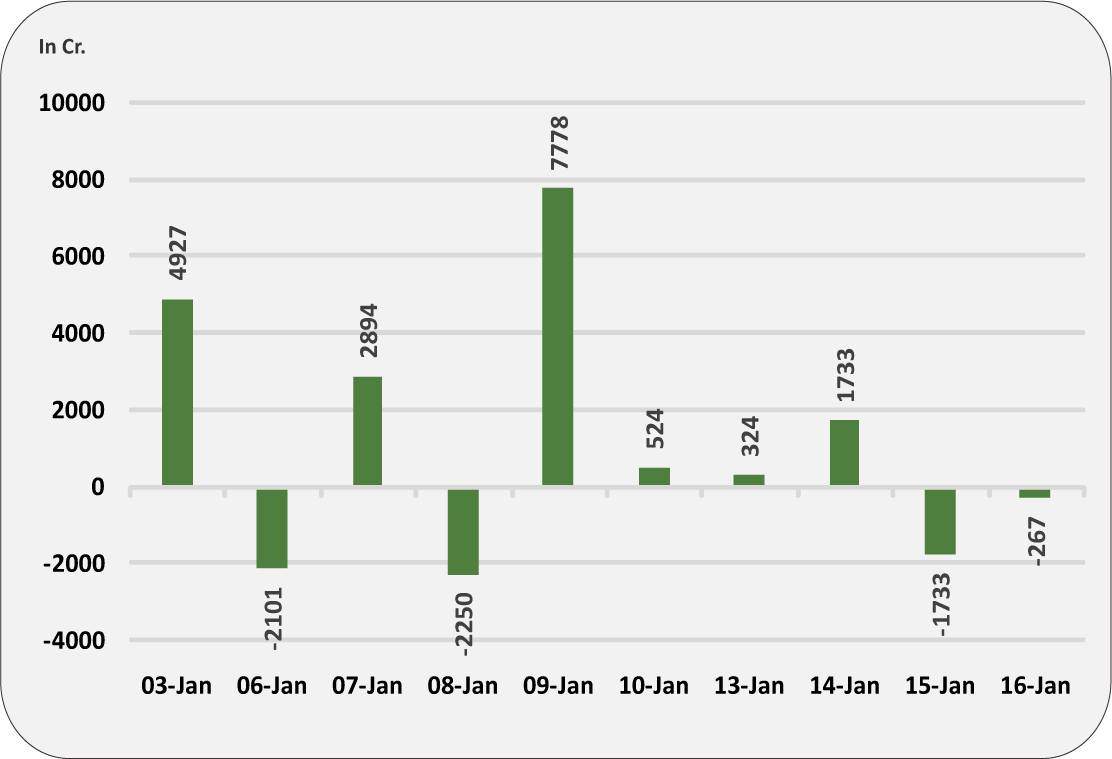
Nifty indices once again made new record highs in the week gone by and ends just shy of record close. During the weekend session some profit booking was witnessed in counters like banking, telecom, auto and metal while few pharma names shine on the street. From derivative front 12300 put strike and 12400 call strike hold with maximum open interest which points towards range bound moves next week. However from technical front Nifty is currently hovering into a overbought zone while some negative divergences has been observed in Banknifty which indicates towards limited upside as of now. The Implied Volatility (IV) of calls closed at 13.56% while that for put options closed at 14.10%. The Nifty VIX for the week closed at 14.18% and is expected to remain volatile. PCR OI for the week closed at 1.41. In coming week we believe that as far Nifty is trading below 12400 and Banknifty below 32000 levels the traders should remain cautious before initiating any fresh long positions. However on downside the immediate support for Nifty is placed at 12300-12280 zone while banknifty can get support at 31500-31300 levels. We expect that markets should take a breather at current juncture and stock specific action should remain under focus on back of ongoing result season.
8
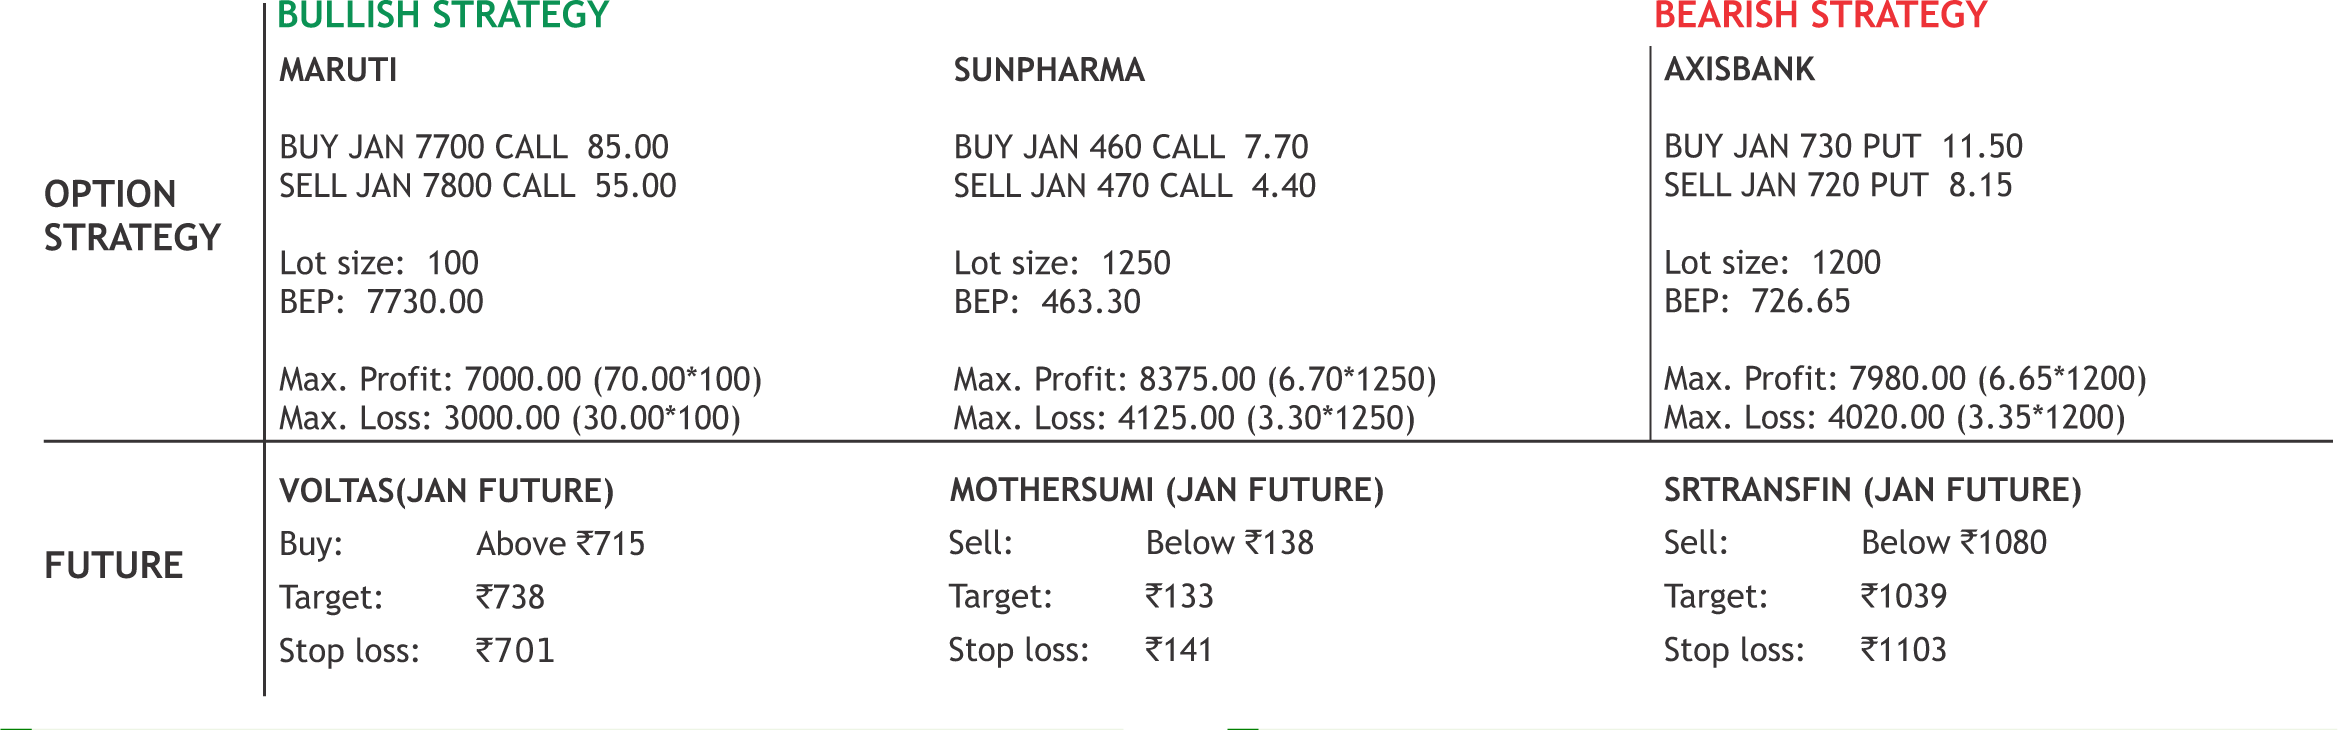
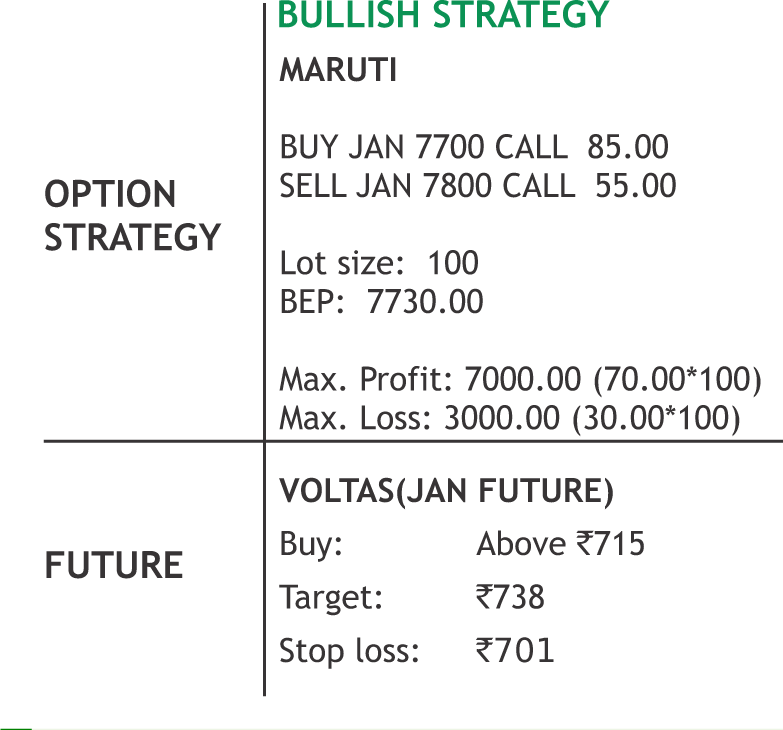
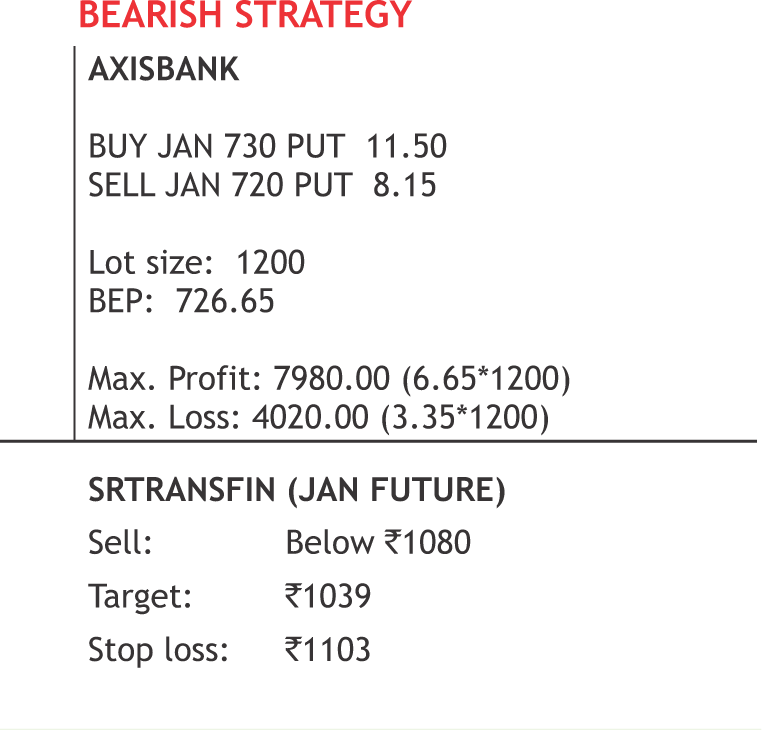
|
|
|
|
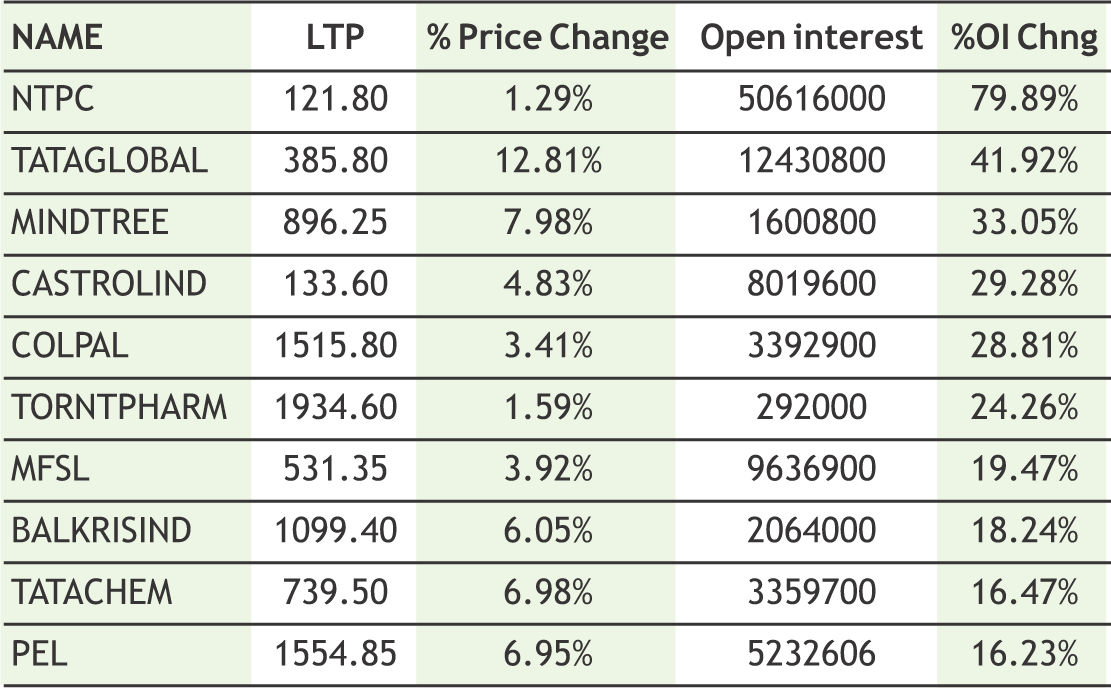
**The highest call open interest acts as resistance and highest put open interest acts as support.
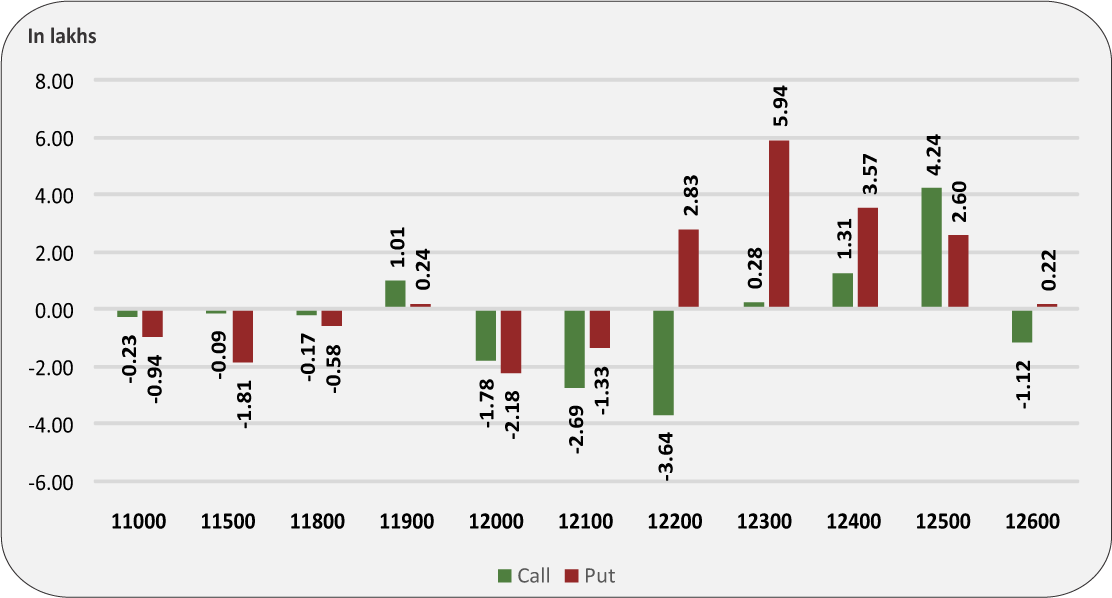
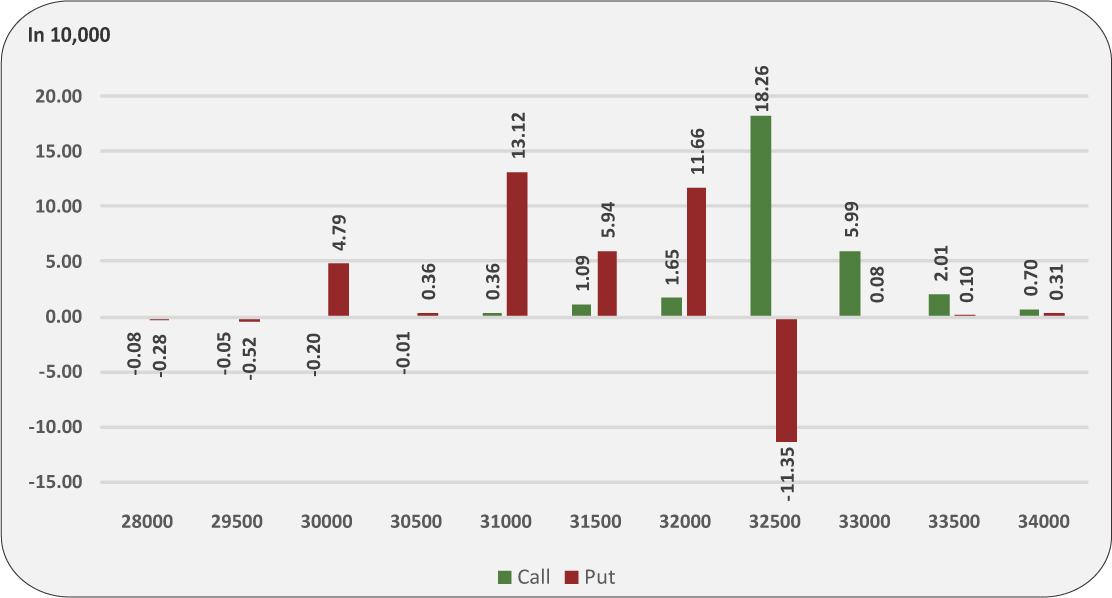
# Price rise with rise in open interest suggests long buildup | Price fall with rise in open interest suggests short buildup
# Price fall with fall in open interest suggests long unwinding | Price rise with fall in open interest suggests short covering
9
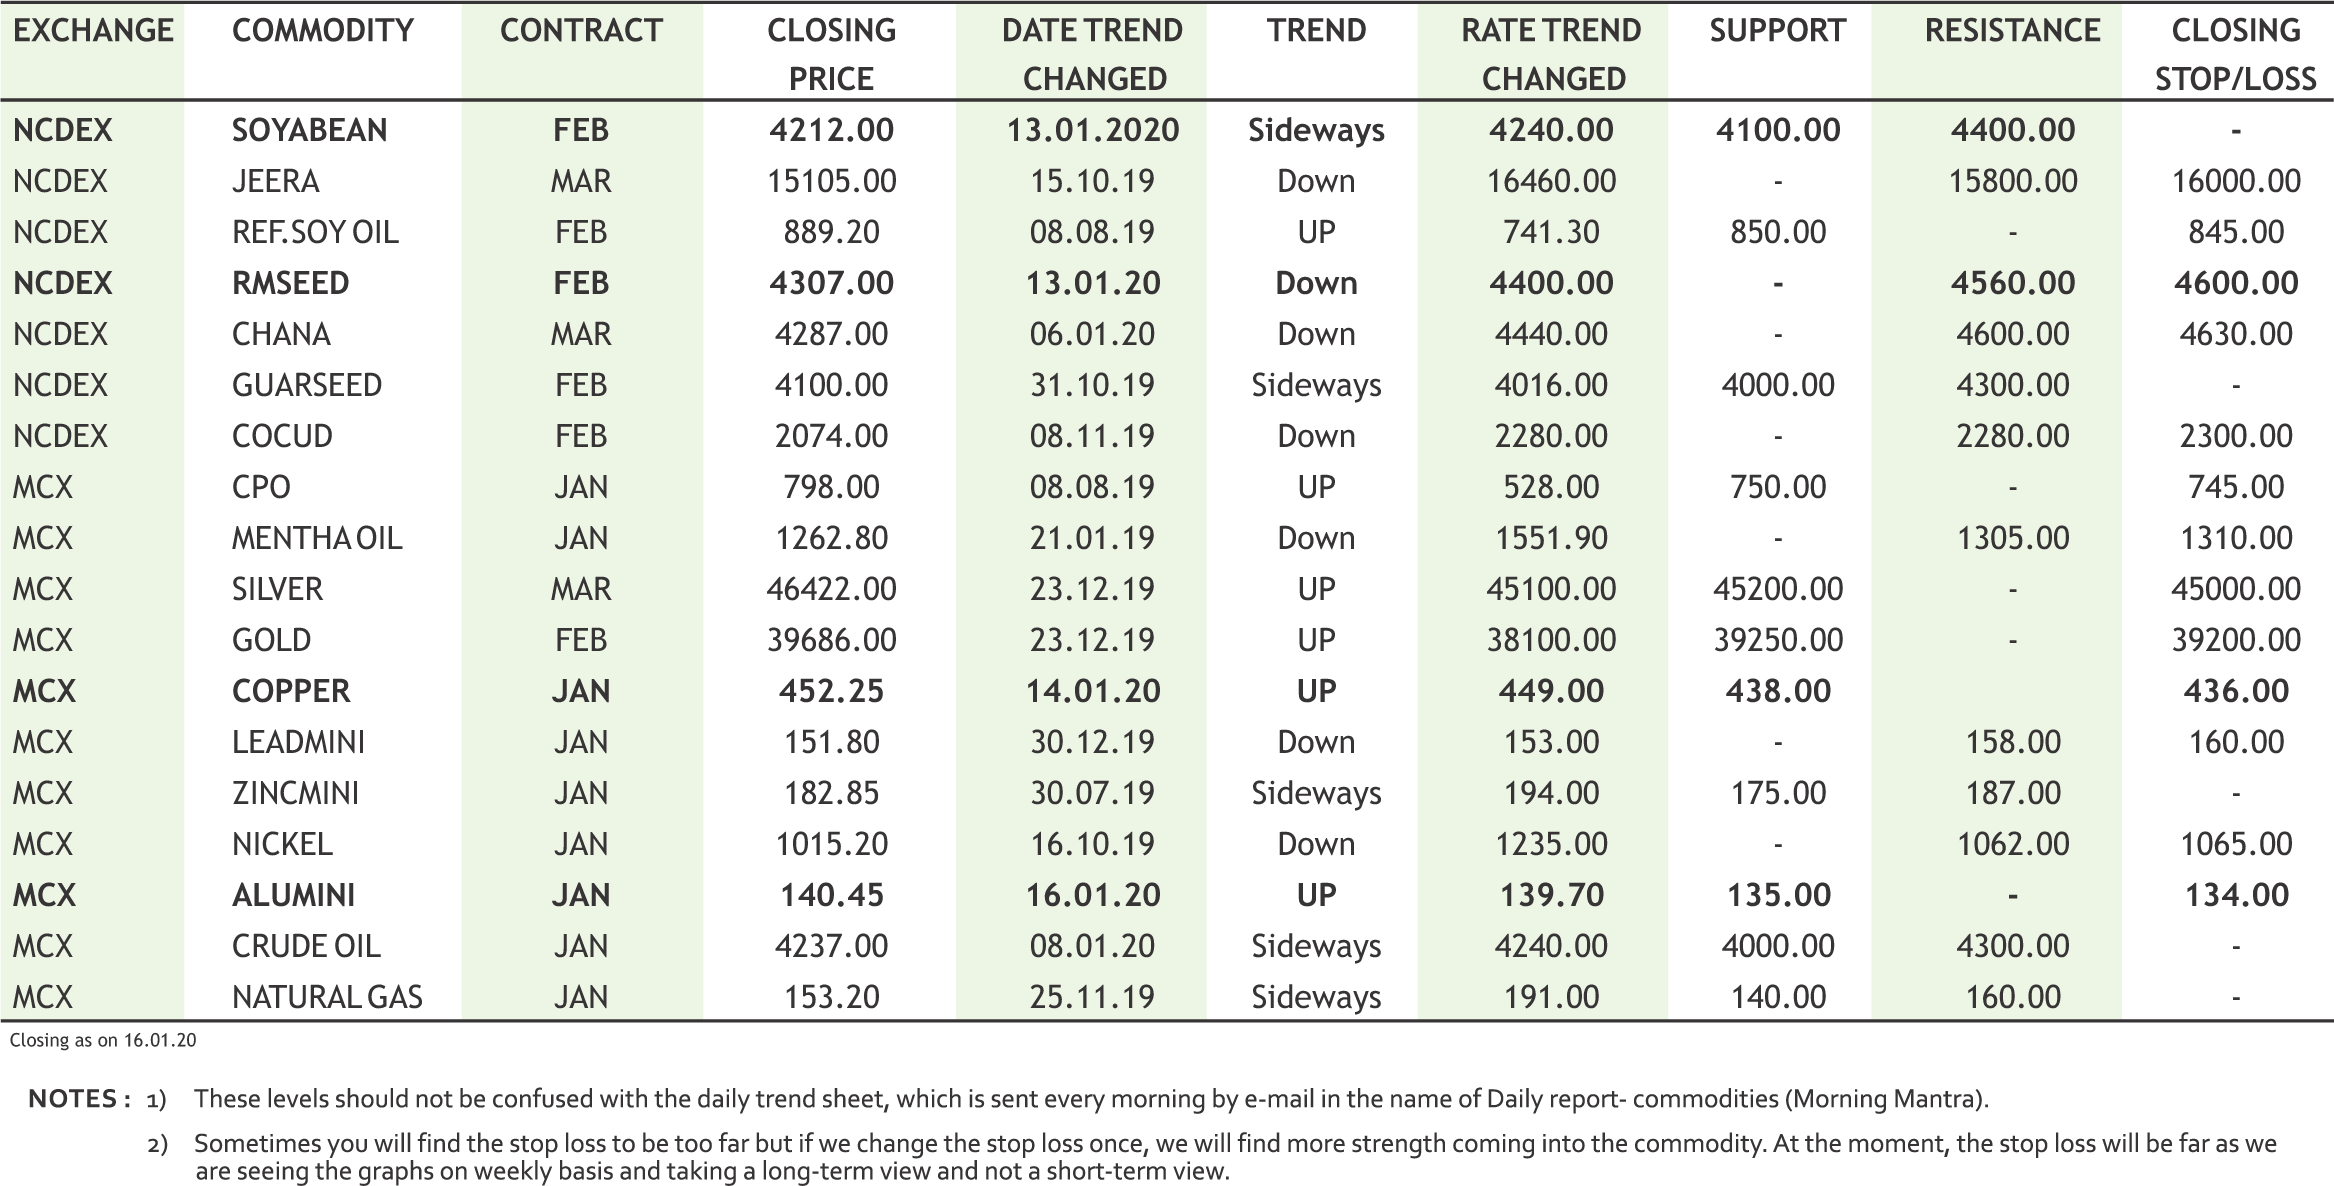
Turmeric futures (Mar) is expected to consolidate in the range of 6200-6500 & trade with a downside bias. The reason is that the new turmeric has started arriving in the markets of Nizamabad in Telangana. The quality is inferior due to cold weather just before the harvest. Also, the demand is thin in ready markets and traders are also focusing on the higher moisture levels. The supply is coming from the six-month crop and has a moisture level of 20-30 percent, against the normal of 7 percent. Arrivals are likely to gather pace in the coming weeks, which will further weigh on the prices. Jeera futures (Mar) may take an attempt to break the support near 15000 & plunge further to test 14500-14300 levels. In the present scenario, the demand is sluggish amid prospects of a bigger crop this year.An increase in jeera's acreage in Gujarat and Rajasthan, and favourable weather conditions across the growing regions may lead to a rise in yield. Meanwhile, total area sown under jeera in Gujarat, was at 4.87 lakh hectares as on January 13 in the current 2019-20 Rabi season, up 40 percent from 3.48 lakh hectares over the year-ago period, as per the state agriculture department's data. Dhaniya futures (Apr) is expected to trade sideways in the range of 6705-7200 levels. Extremely cold weather conditions in Rajasthan have led to reduction in area under the spice, as coriander is a weather-sensitive crop. Despite, the disturbance in yield, Pradesh, production of coriander during 2019-20 (Oct-Sep) in Rajasthan and Madhya is projected to be higher.
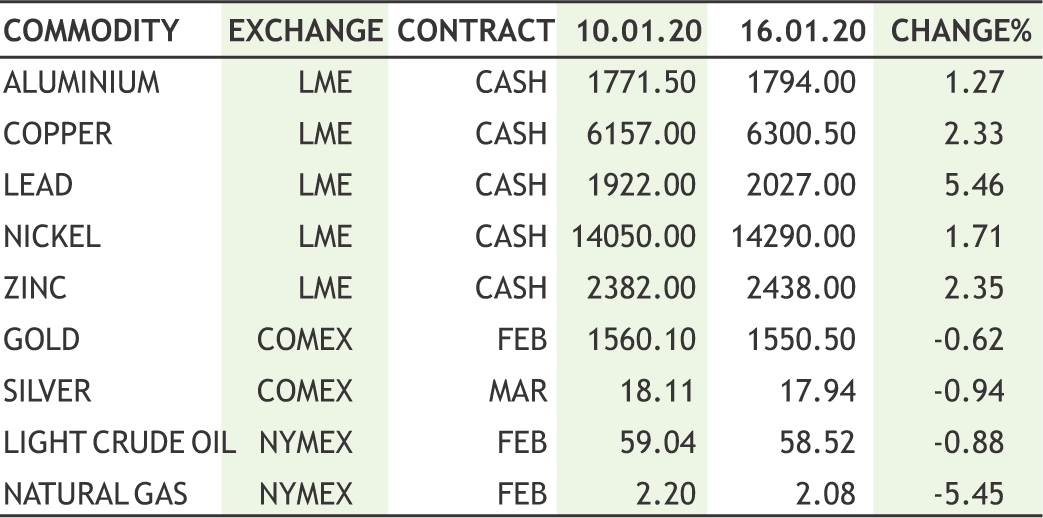
Bullion counter can trade with mixed bias as receding Middle East tensions and optimism over an interim U.S.-China trade deal reduced safe haven demand but still the interim deal fails to address structural economic issues that led to the trade conflict, as it does not fully eliminate the tariffs that have slowed the global economy, and sets hard-to-achieve purchase targets. Gold may take support near 39300 and resistance near 40500 whereas silver may take support near 45700 and resistance near 47000. Meanwhile, from Huawei to the South China Sea, deep political rifts between Beijing and Washington are set to persist, despite a trade relations breakthrough, as the U.S. pushes back against an increasingly powerful and assertive China. United States showed retail sales rose for a third straight month in December and the number of Americans filing claims for unemployment benefits dropped for a fifth straight week last week. Adding to concerns, China's pledge to buy U.S. farm goods based on "market conditions" during the deal signing ceremony spurred doubts among farmers and commodity traders over Beijing's lingering tariffs on U.S. exports. U.S. Federal Reserve expressed confidence that borrowing costs are at the right level to sustain growth and lift inflation to healthier levels, despite what businesses say is a lingering drag from uncertainty over U.S. trade policy. Meanwhile the total business volume of gems and jewellery industry has posted a 30 per cent decline in terms of demand over the last six months.
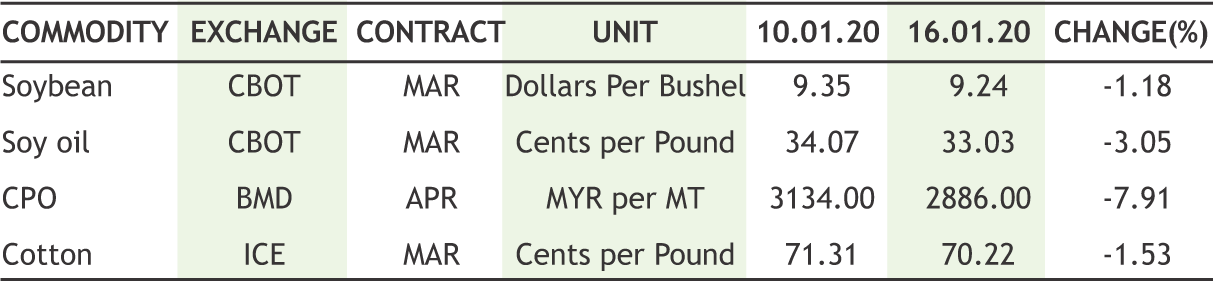
Soybean futures (Feb) may continue to witness correction on every pull back & if breaks 4155 then probabilities are higher that it may plunge to test 4080- 4050 levels. Bearish sentiments are persisting over the whole oilseeds complex in domestic as well as in the international markets amid cautiousness around the uncertainty of soybean imports by China from U.S & back at home, the improving prospects of oilseeds production this Rabi season. Mustard futures (Feb) is expected to fall for the third consecutive week & test 4235- 4200 levels. The current weather conditions in many states including Punjab, Haryana, Uttar Pradesh and Rajasthan have been very favourable for the oilseed crops. CPO futures (Feb) is expected to trade with a downside bias & test 770-755 levels, while soy oil futures (Feb) will probably go down further to test 875-855 levels. Multiple factors of profit booking, sliding trend of U.S soy oil on CBOT & palm oil on Bursa Malaysia Derivatives may lend negative cues to the edible oil counters. Moreover, despite the fact that In the last 4 months, pipelines stock dried up to the lowest level andreported at 515,000 tons as on 1st Jan.,2020 compared to 630,000 tons as on 1st Dec.2019, the edible oil counters failed to show a positive reaction. This is because, there being no restrictions on the issuance of new licences for import of refined palm oil, the trade fears that importers may rush to get licences for palm oil imports &refined palm oil will be dumped in India.The Solvent Extractors' Association of India (SEA) has sought quantitative restrictions on new import licences.
Crude oil prices may witness lower level buying as Washington and Beijing inked a long-awaited trade deal recently as the Phase 1 accord between the world's top two economies helped boosted the outlook for global trade. Crude oil may recover towards 4400 while taking support near 4000. Elsewhere, Saudi Arabia's energy minister Prince Abdulaziz bin Salman stated his country will work for oil market stability at a time of heightened U.S.-Iranian tension and wants to see sustainable prices and demand growth. Meanwhile International Energy Agency (IEA) stated that it expected oil production to outpace demand for crude from the Organization of the Petroleum Exporting Countries (OPEC), even if members comply fully with a pact with Russia and other non-OPEC allies to curb output. Moreover surging oil production from non-OPEC countries led by the United States along with abundant global stocks will help the market weather political shocks such as the U.S.-Iran stand-off. Meanwhile China’s crude oil throughput rose to a record high in 2019 following the start-up of two mega-refineries. Natural gas can remain on weaker bias as it can test 140 by taking resistance near 160 on feeble demand. Temperatures have not been cooperating with natural gas markets during the winter till now Meanwhile the fact that the Americans had drilled 17% more during 2019 than 2018 also adds more in the way of headwinds for market pricing. The weather over the next 6-10 and 8-14 days is expected to be milder, with warm weather on the west coast and colder weather on the east coast.
Cotton futures (Jan) will possibly remain stable in the range of 19650-20170 levels. Increased buying by the Cotton Corporation of India (CCI) could keep local raw cotton prices near government-set levels. The CCI is set to procure more than 5 million bales from farmers in 2019/20, the highest in five years, as local prices come under pressure due to surplus production. The latest statistics show that the CCI has procured about 40 lakh bales of cotton as part of its MSP procurement operations so far during the season, amounting to 25% of the crop arrivals in the market. Regarding international market, ICE cotton may continue to face resistance near 72 cents per pound. The traders are uncertain about cotton imports from China amidst lingering concerns of dampening demand of the fiber within China. The United States is also finding it difficult to ship large volumes of goods right now, and even on Wednesday Chinese mills were mainly buying Brazilian cotton. Chana futures (Mar) may trade below 4250 & fall further to test 4200-4170 levels. Sentiments are still under pressure due to improvement in Rabi Chana sowing and Government holding major stocks. Upcoming Chana crop is expected to be bumper and yields are likely to be higher due to favourable weather conditions. Mentha oil futures (Jan) may go down further to test 1250-1240 levels. At present, fresh arrivals are coming onto the spot markets from Madhya Pradesh. Moreover, the sowing for the new season is expected to commence from next month and the market participants are expecting that the acreage is likely to be higher this season.
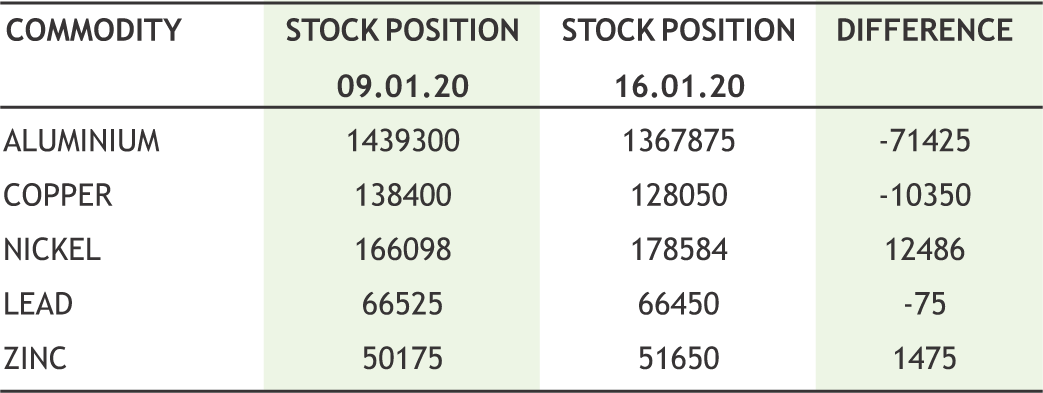
Base metal counter may remain on mixed path as copper may extend its recovery while nickel may remain under pressure. Copper may recover towards 460 levels while taking support near 440 levels. Declining stocks of copper in LME-approved warehouses have supported its prices which stood near their lowest level since March 2019 and they have declined over 60% since August 2019. The widening of the discount of LME copper cash over the threemonth contract pointed to a well-supplied market. Meanwhile, lead may remain sideways as it can move in the range of 150-157 levels. Zinc may take support near 177 levels and can recover towards 190. Nickel prices can move with sideways to weaker path as it may face resistance near 1060 while taking support near 1000 levels. London Metal Exchange Nickel inventory has more than doubled in the space of little more than a month, with almost 120,000 tonnes of metal flooding into registered warehouses. China's booming nickel raw material imports and falling refined metal imports are reinforcing the message that there is no imminent supply crunch. Aluminium prices can recover towards 146 levels by taking support near 137 levels. China's annual aluminium production fell for the first time in 10 years in 2019 hit by softer demand amid the Sino-U.S. trade row and large-scale smelter outages. According to the National Bureau of Statistics (NBS) “China Aluminium output dropped to 35.04 million tonnes last year, down 0.9% from record levels a year earlier”
10
|

CPO MCX (FEB) contract closed at Rs. 792.50 on 16th Jan’2020. The contract made its high of Rs. 844.00 on 10th Jan’2020 and a low of Rs. 677.50 on 02nd Dec’19. The 18-day Exponential Moving Average of the commodity is currently at Rs. 798.86. On the daily chart, the commodity has Relative Strength Index (14-day) value of 50.633.
One can sell near Rs. 800 for a target of Rs. 760 with the stop loss of Rs. 820..

ZINC MCX (JAN) contract closed at Rs. 182.85 on 16th Jan’2020. The contract made its high of Rs. 195.00 on 30th Oct’19 and a low of Rs. 177.90 on 26th Dec’19. The 18-day Exponential Moving Average of the commodity is currently at Rs. 181.92. On the daily chart, the commodity has Relative Strength Index (14-day) value of 56.548
One can buy near Rs. 181 for a target of Rs. 189 with the stop loss of Rs. 177.

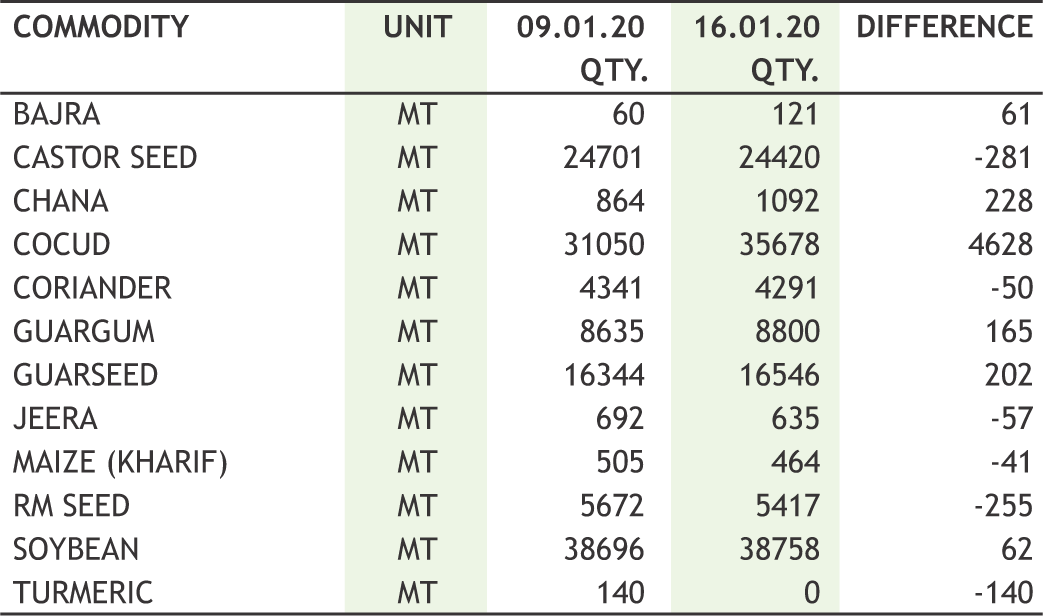
GUARSEED NCDEX (FEB) contract was closed at Rs. 4100.00 on 16th Jan’2020. The contract made its high of Rs. 4400.00 on 14th Nov’19 and a low of Rs. 3984.00 on 16th Dec’19. The 18- day Exponential Moving Average of the commodity is currently at Rs. 4161.12. On the daily chart, the commodity has Relative Strength Index (14-day) value of 41.604.
One can buy near Rs. 4020 for a target of Rs. 4280 with the stop loss of Rs 3890.
11
• Stocks exchanges can launch ‘option in goods’ in their commodity derivatives segment, as per SEBI.
• The Bureau of Indian standard (BIS) notified standards for delivery of 32 items, including gold and silver. This implies that all commodities on the list, including bullion, will be treated on a par for delivery in India.
Ÿ US will immediately impose punishing economic sanctions against Iran. These sanctions will remain till Iran's Behavior Improves. – U.S President.
• The government has notified the mandatory hallmarking of gold jewellery and artefacts, come into force from January 15, 2021.
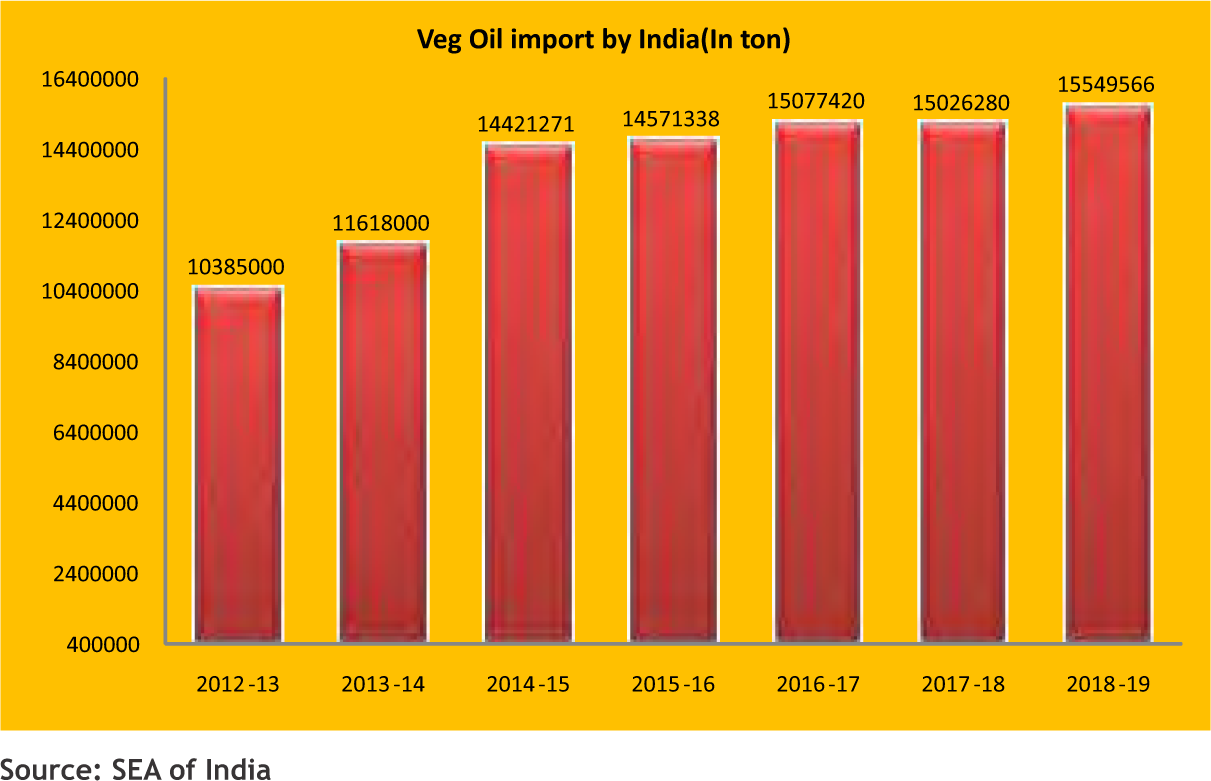
• As per the latest release from the Solvent Extractors Association of India (SEA), the import of Vegetable Oils during December 2019 is reported at 11.28 lakh tons compared to 12.11 lakh tons for December 2018, recording a drop of 7%.
• New home prices in China's 70 major cities rose 6.6% in December from a year earlier, the slowest since July 2018, and down from November's 7.1% on-year increase.
• China's crude oil imports in 2019 surged 9.5% from a year earlier, setting a record for a 17th straight year.
• China's unwrought copper imports rose 9.1% in December from the previous month to their highest since March 2016.
• US sanctioned 17 Iranian metals producers and mining companies but the impact to global supply would be minimal as the country is not a major producer.
Action was missed in commodities market despite the sign of First phase deal between US and China. Dollar index couldn’t face resistance near 97.5 and from there it saw fall. Bullion counter noticed lacklustre trade as safe haven buying diminished on First phase trade deal amid receding fear of war between Iran and US. After hitting highs the previous week in bullion, last week could see a rollercoaster-like drop as precious metals traders brace them for the wild ride. The bid for precious metals has weakened since the panic over possible hostilities between the U.S. and Iran passed. It was a weak week for energy counter in which both commodities viz; crude oil and natural gas saw downside. Oil prices dropped, despite a report from the U.S. Energy Information Administration (EIA) that confirmed a sharp decline in stockpiles that surpassed analysts expectations of a drop. The EIA said crude inventories fell by 2.5 million barrels, far more than the expected drop of 750,000 barrels. OPEC expects lower demand for its crude oil in 2020 even as global demand rises, as rival producers grab market share and the United States looks set for another output record. Chinese GDP last year grew by 6.1%, within the government’s target range between 6% and 6.5%. It kept industrial metals counter in a range. Copper, lead and zinc prices flared up whereas nickel and aluminium closed the week on weaker note. Copper gained, heading for a second straight weekly gain. It touched $6,343 yesterday – the most since the start of May last year. Hindustan Zinc expects Indian demand for zinc to increase from an overhaul of its railway network.
In agri spices saw further weakness. Jeera prices crashed as favourable climatic conditions and improved water availability following good monsoon rains have brightened crop prospects. As Per the latest data in Gujarat, there is a 36% rise in area under cultivation of this spice over last year. Edible oil and oil seeds counter noticed dip in the prices. The stockiest & exporters are refraining from fresh purchase at such higher levels & waiting for a volatility to cool down. In the present scenario, there is lots of fundamental news impacting the price movement from both the sides. CPO saw a pause in rally after a fourteen week nonstop strong rally. Malaysian palm oil futures fell for a fourth straight session on Thursday on lower-than-expected exports and concerns over demand from India. Cotton prices moved lower in Central and South India amid sluggish demand from both exporters and mills at the existing higher prices. According to traders, buying from exporters has come down due to the decline in the global market. Chana futures declined on fresh arrivals.

|


|
12

|
|
• As per the latest release from the Solvent Extractors Association of India (SEA), the import of Vegetable Oils during December 2019 is reported at 11.28 lakh tons compared to 12.11 lakh tons for December 2018, recording a drop of 7%.
• The import of vegetable oils during Oil Year 2019-20 (Nov.19 to Dec.19) i.e. edible oil and non-edible oil is reported at 22.5 lakh tons compared to 23.4 lakh tons for the same period of last year, down by 3.8%.
• The import of crude palm oil (CPO) declined to 6,31,824 tonne in December 2019, from 6,70,244 tonne in the year-ago period, as per the SEA data.
• The import of RBD palmolein dropped to 94,816 tonne, from 1,30,459 tonne, while that of crude palm kernel oil (CPKO) rose to 14,850 tonne from 10,997 tonne in the said period.
• The import of sunflower oil declined to 1,97,842 tonne in December 2019 from 2,35,824 tonne in the year-ago period.
• However, the shipment of soyabean oil rose sharply to 1,68,048 tonne from 85,404 tonne in the said period.
• The government on January 8, this year banned import of RBD palmolein to regulate excessive import of refined palm oils. The Indian Ministry of Commerce put refined palm oil products from 'Free' to “restricted” category. The import will now be subjected to license.
• The decision to restrict all imports of refined palm oil is also likely to boost business for Indian refiners of the vegetable oil. Indian refiners need the boost as refining activity in the country has been hit in the past year by imports of cheaper refined palm oil.
• Going forward, the government has issued an informal advisory to refiners not to buy the commodity from Malaysia after its criticism of India's actions in Kashmir and a new citizenship law.
• Now India can now only import crude palm oil. Malaysia’s share in India’s import of 741,490 tonnes of palm oil last month was 110,562 tonnes including 5,020 tonnes of refined oil and 3,000 tonnes of crude palm kernel oil (CPKO). Malaysian palm oil exports to India in November totalled 183,914 tonnes, including 41,600 tonnes of RBD palm olein.
• Palm oil accounts for nearly two-thirds of India's total edible oil imports. The country buys more than 9 million tonnes of palm oil annually, mainly from Indonesia and Malaysia. Indonesia is the world's biggest producer of palm oil, followed by Malaysia.
• The stock position of edible oils at various ports is estimated at 860000 tonnes. Pipeline stocks level fell to lowest level in four months at 515000 tonnes as on 1st January 2020.
• Against India''s monthly requirement of about 19 lakh tonnes, SEA said currently the country has a stock of 13.75 lakh tonnes of edible oils which can meet the requirement for 22 days.
13
|
| 6th JAN | In the third special open market operation in as many weeks, the Reserve Bank of India (RBI) on Monday bought ₹10,000 crore of three long-term securities while selling a same amount of three short-term bonds |
| 7th JAN | India’s Retail inflation shot to a five-and-a-half-year high of 7.35% in December, breaching the central bank’s tolerance limit of 6.00%. |
| 8th JAN | Trump says “ Iran appears to be standing down” following its retaliatory attacks against Iraqi bases housing US troops. |
| 9th JAN | Bank of England Policy Makers hinted for rate cut and injection of fresh stimulus. |
| 9th JAN | Sterling weigh as Market odds for Bank of England rate cut jump to 60%. |
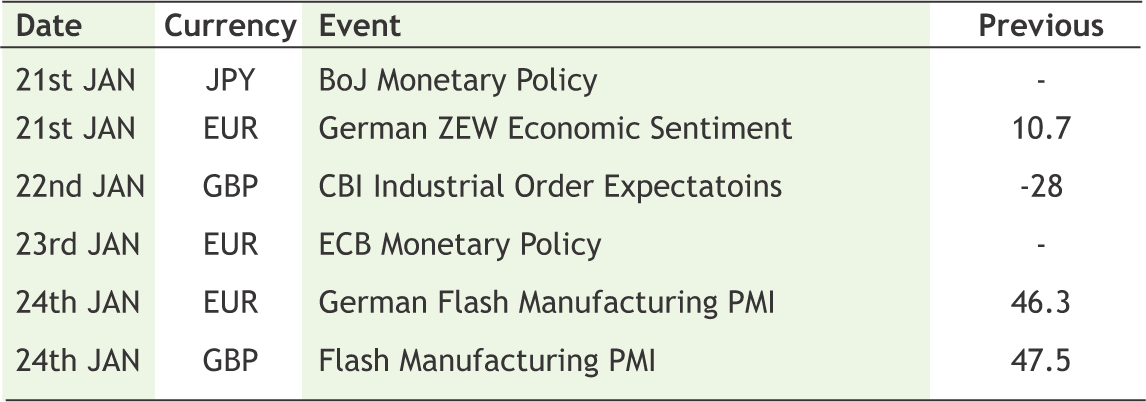
Improved risk-on sentiment brought rupee in green zone this week ended Thursday. However RBI's regular intervention around 70.70 zones prevent rupee to rise further. Despite latest spike in monthly headline inflation which will push back RBI for continuing the accommodative stance in upcoming policy meetings, rupee managed to rise beyond 71.00 was solely based on foreign flows through corporate borrowings channel. Meanwhile US VP Mike Pence comments that phase-two deal negotiations are on, encouraged emerging currencies to hold the risk-on gains. Earlier US-China phase one deal hasn't lifted the market sentiment as the ongoing slowdown in major economies weigh the immediate euphoria. Meanwhile latest Chinese GDP release revealed that growth grows at slowest pace in 29 years. China’s economy last year grew at the lowest rate since 1990 while the country’s birth rate fell to a record low, highlighting the domestic challenges facing Beijing despite a truce in its painful trade war with the US. Going forward next week, ECB monetary policy will be key as latest minutes unfolds the optimism within eurozone policymakers to project slightly higher inflation. Important economic release from the euro bloc is first cut business data that pointing to a modest uptick in January.
USDINR is likely to stay above 70.80 and move higher towards 71.40 in the next week.
|
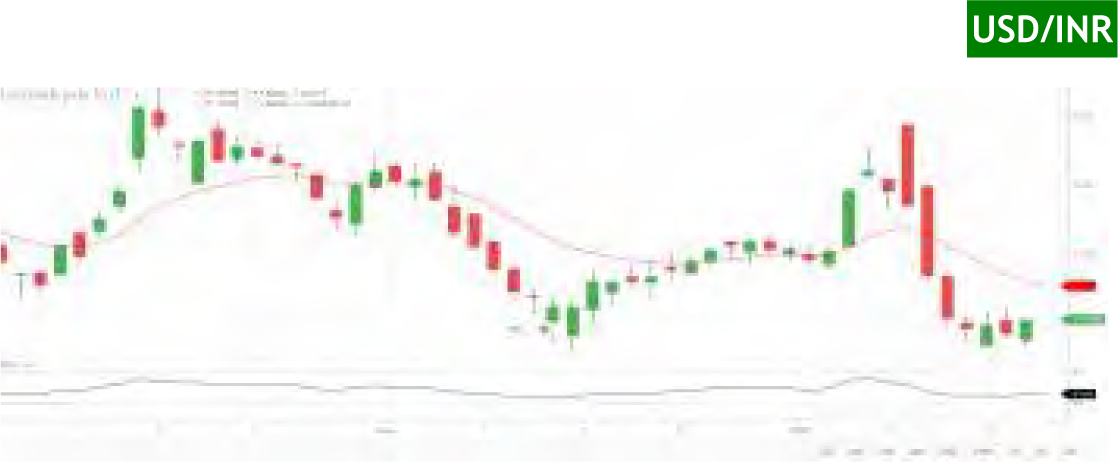
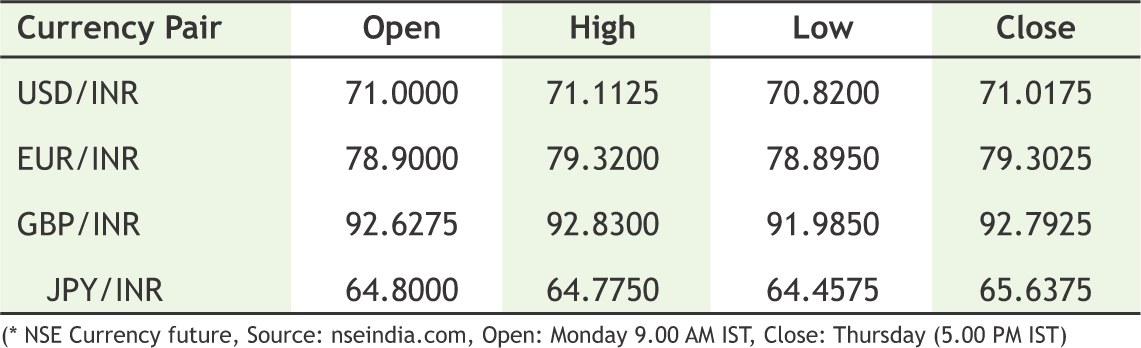
USD/INR (JAN) contract closed at 71.0175 on 16th Jan 2020. The contract made its high 71.1125 on 16th Jan 2020 and a low of 70.8200 on 16th Jan 2020 (Weekly Basis). The 14-day Exponential Moving Average of the USD/INR is currently at 71.27.
On the daily chart, the USD/INR has Relative Strength Index (14-day) value of 37.82. One can buy at 70.80 for the target of 71.40 with the stop loss of 70.50.
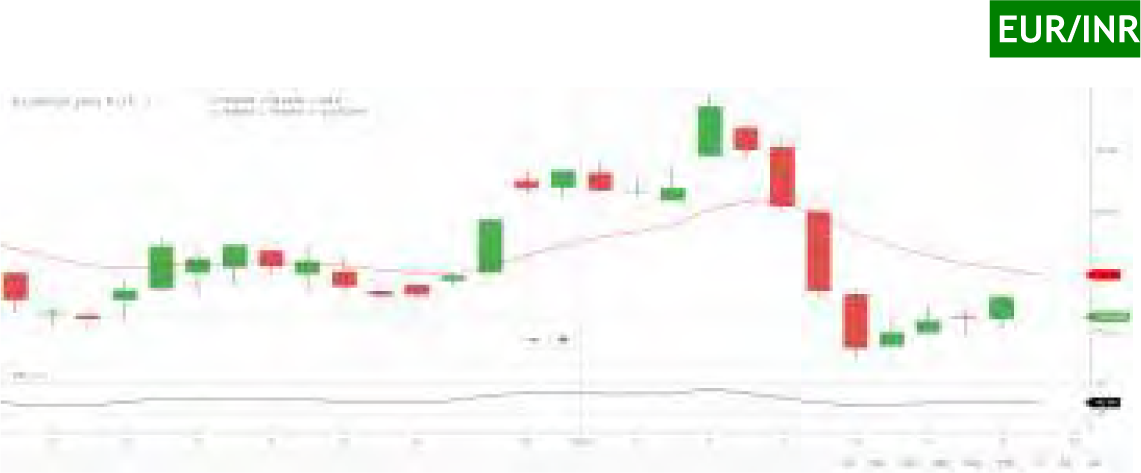
EUR/INR (JAN) contract closed 79.3025 on 16th Jan 2020. The contract made its high of 79.3200 on 16th Jan 2020 and a low 78.8950 on 13th Jan 2020 (Weekly Basis). The 14-day Exponential Moving Average of the EUR/INR is currently at 79.48.
On the daily chart, EUR/INR has Relative Strength Index (14-day) value of 41.91. One can buy at 79.00 for a target of 79.80 with the stop loss of 78.60.

GBP/INR (JAN) contract closed at 92.7925 on 16th Jan 2020. The contract made its high of 92.8300 on 16th Jan 2020 and a low of 91.9850 on 13th Jan 2020 (Weekly Basis). The 14-day Exponential Moving Average of the GBP/INR is currently at 93.19.
On the daily chart, GBP/INR has Relative Strength Index (14-day) value of 44.90. One can buy at 92.50 for a target of 93.20 with the stop loss of 92.10.

JPY/INR (JAN) contract closed at 65.6375 on 16th Jan 2020. The contract made its high of 64.7750 on 15st Jan 2020 and a low of 64.4575 on 14th Jan 2020 (Weekly Basis). The 14-day Exponential Moving Average of the JPY/INR is currently at 65.17.
On the daily chart, JPY/INR has Relative Strength Index (14-day) value of 32.60. One can buy at 64.30 for a target of 65.10 with the stop loss of 63.90.
14
|
15
|
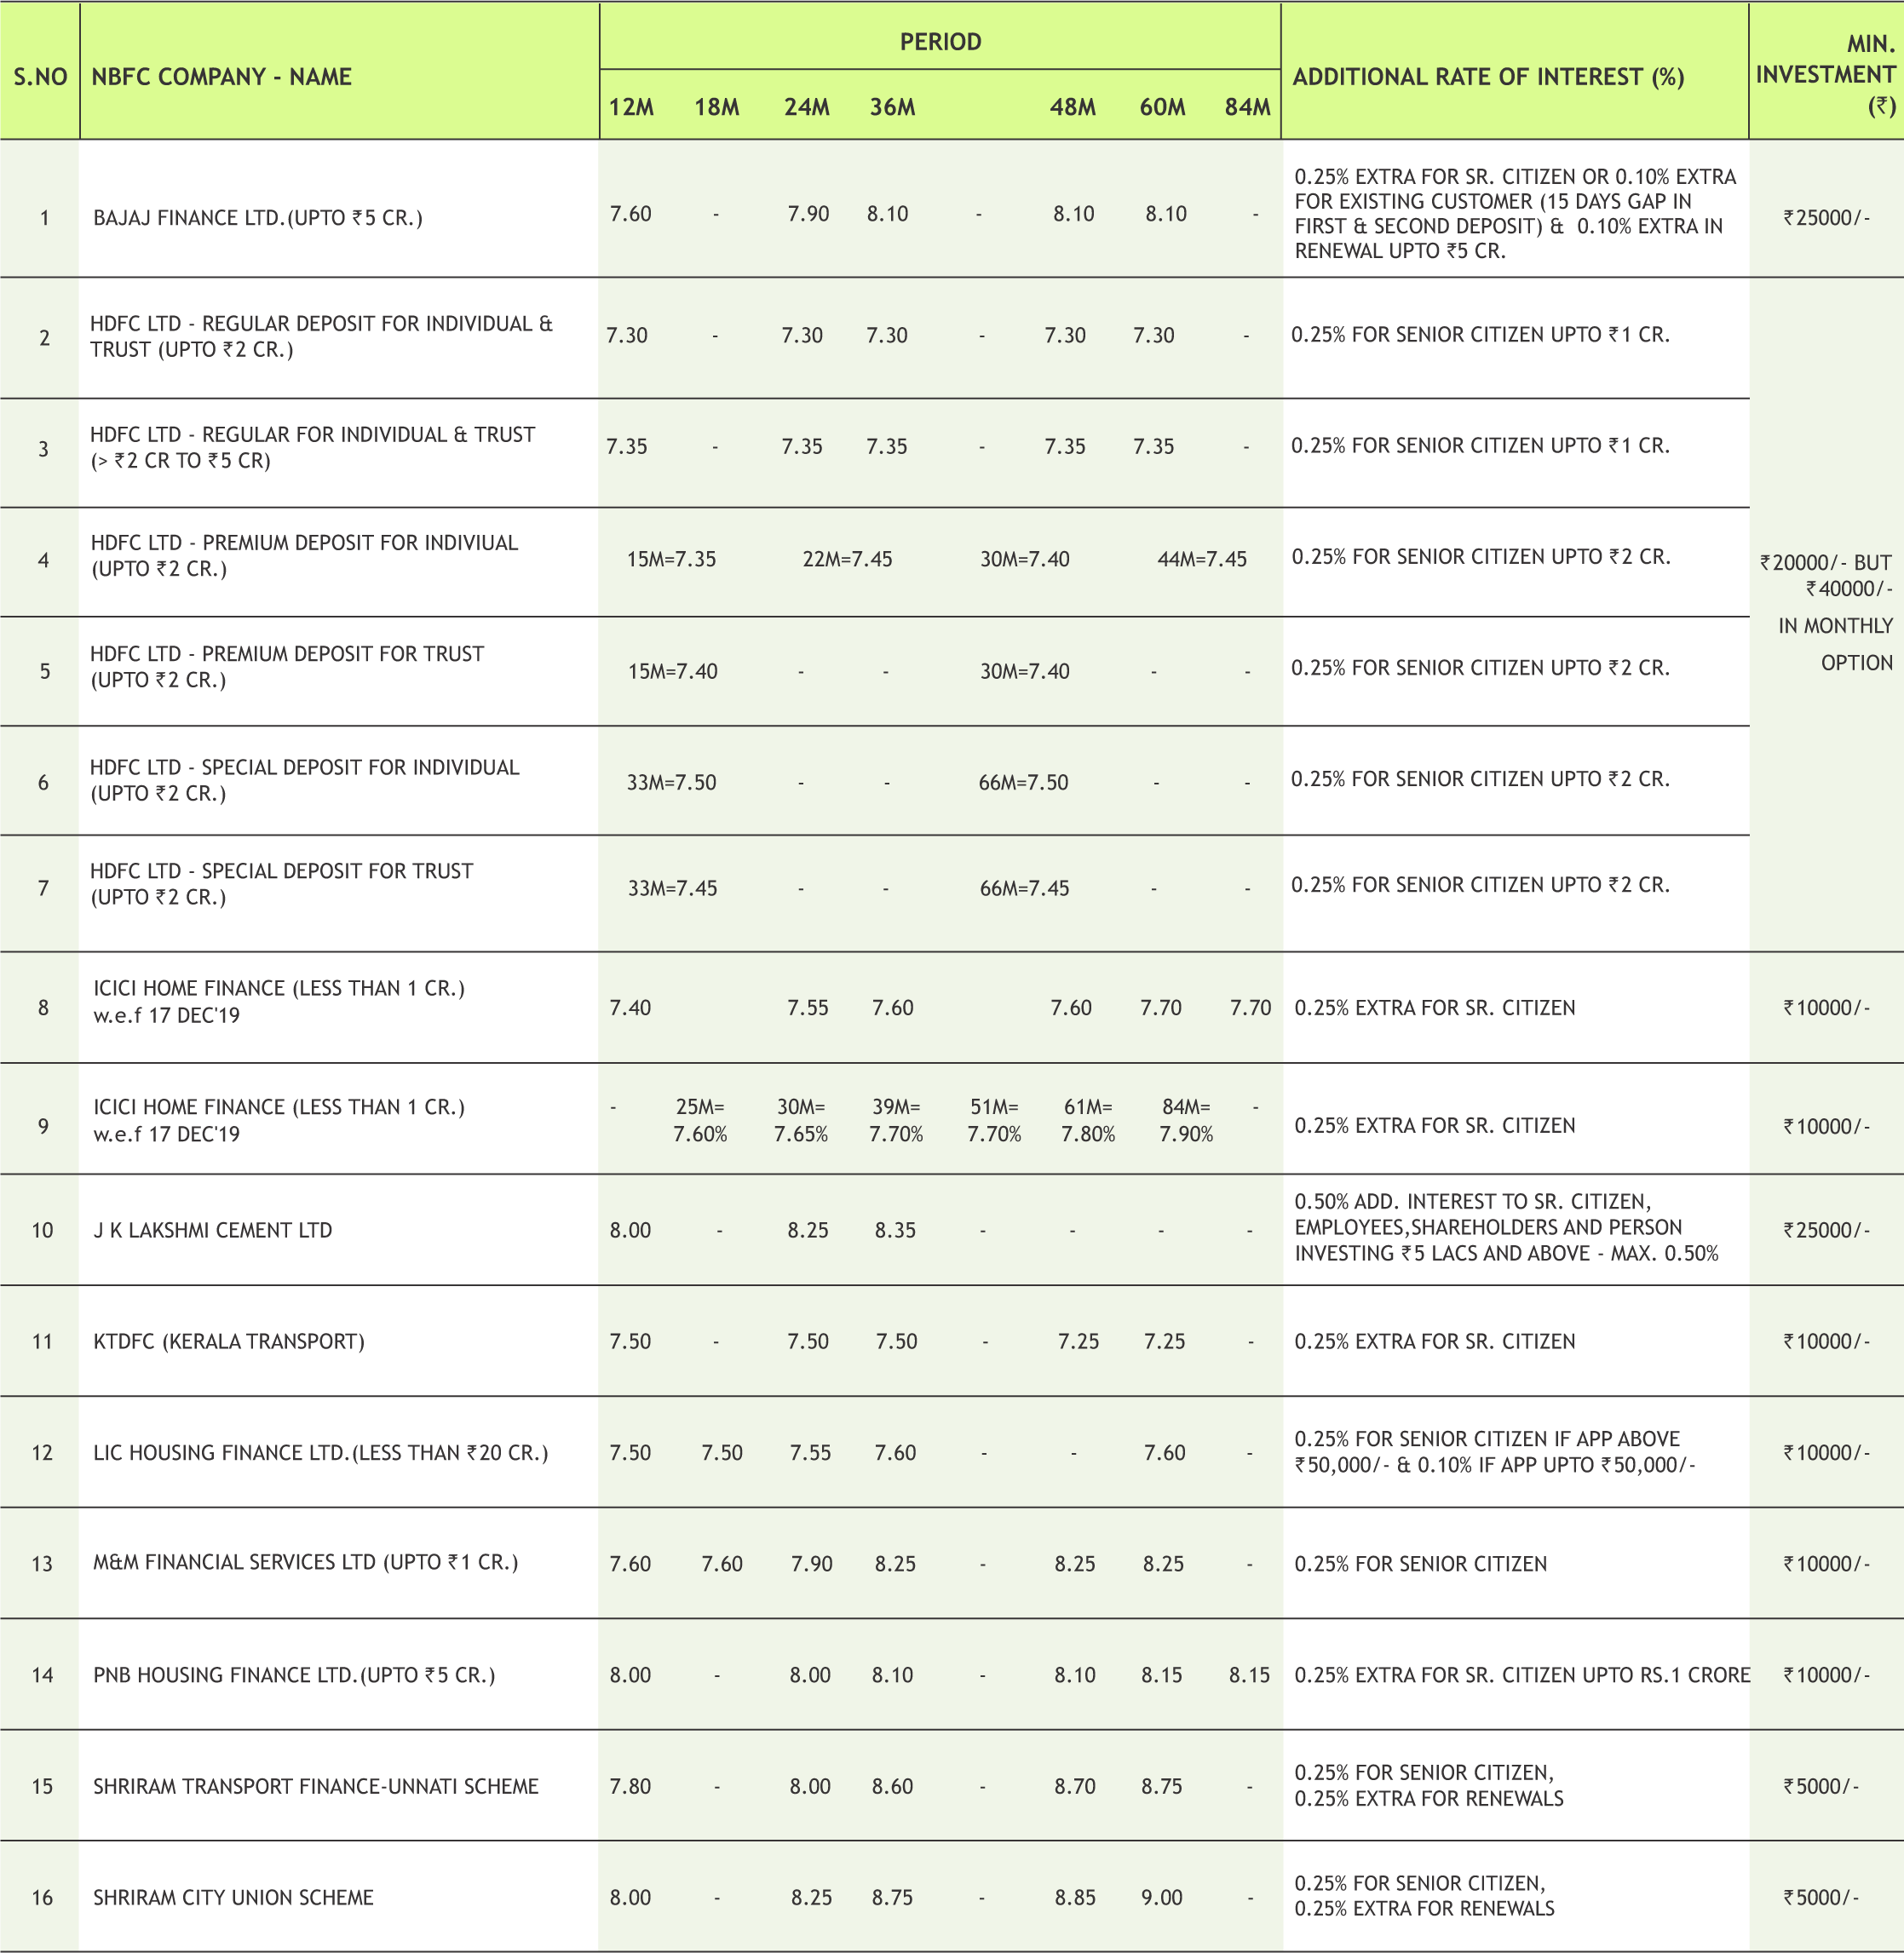
* Interest Rate may be revised by company from time to time. Please confirm Interest rates before submitting the application.
* For Application of Rs.50 Lac & above, Contact to Head Office.
* Email us at fd@smcindiaonline.com

16
FinMin exempts mutual funds from FDI categorisation
The ministry has now excluded mutual funds from the investment vehicles tag reverting them to the original status.
This reverses the October circular which categorised MFs with over 50 percent foreign shareholding as investment vehicles, a change which would have forced several equity asset managers to freeze investment activity and even sell their holdings. There was much pushback as the October circular would ironically have counted retail domestic money invested in the schemes of foreign-owned mutual funds as “foreign money”. For instance, if a company is allowed 74 percent foreign shareholding under FDI rules, any investment in it by an Indian mutual fund with more than 50 percent foreign shareholding would have been considered part of the 74 percent cap.
Major fund houses such as Nippon, Franklin Templeton, Mirae Asset, Invesco, BNP Paribas, HDFC and ICICI Prudential were likely to be impacted. Listed companies with sectoral caps in industries such as private banking, broadcasting, telecom, single brand retail, brownfield pharma, insurance and infrastructure would have faced serious selling pressure too. The reversal comes after representations from various fund managers and the Securities and Exchange Board of India (SEBI).
Equity AUM of MFs hit all-time high of Rs 9 lakh cr in 2019; largecaps remain the top pick
Mutual funds during the year poured in little more than Rs 49,000 crore in equities. Calendar 2019 was a great year for Indian equities as the Nifty50 climbed 12 percent and the BSE Sensex climbed 14 percent. However, the broader markets continued to underperform frontliners for the second year in a row. The rally was only limited to a select 10-15 stocks and was further augmented by several measures taken by the government to spur growth including the corporate tax cut. During the year, mutual fund houses poured in more than Rs 49,000 crore in equities.
17
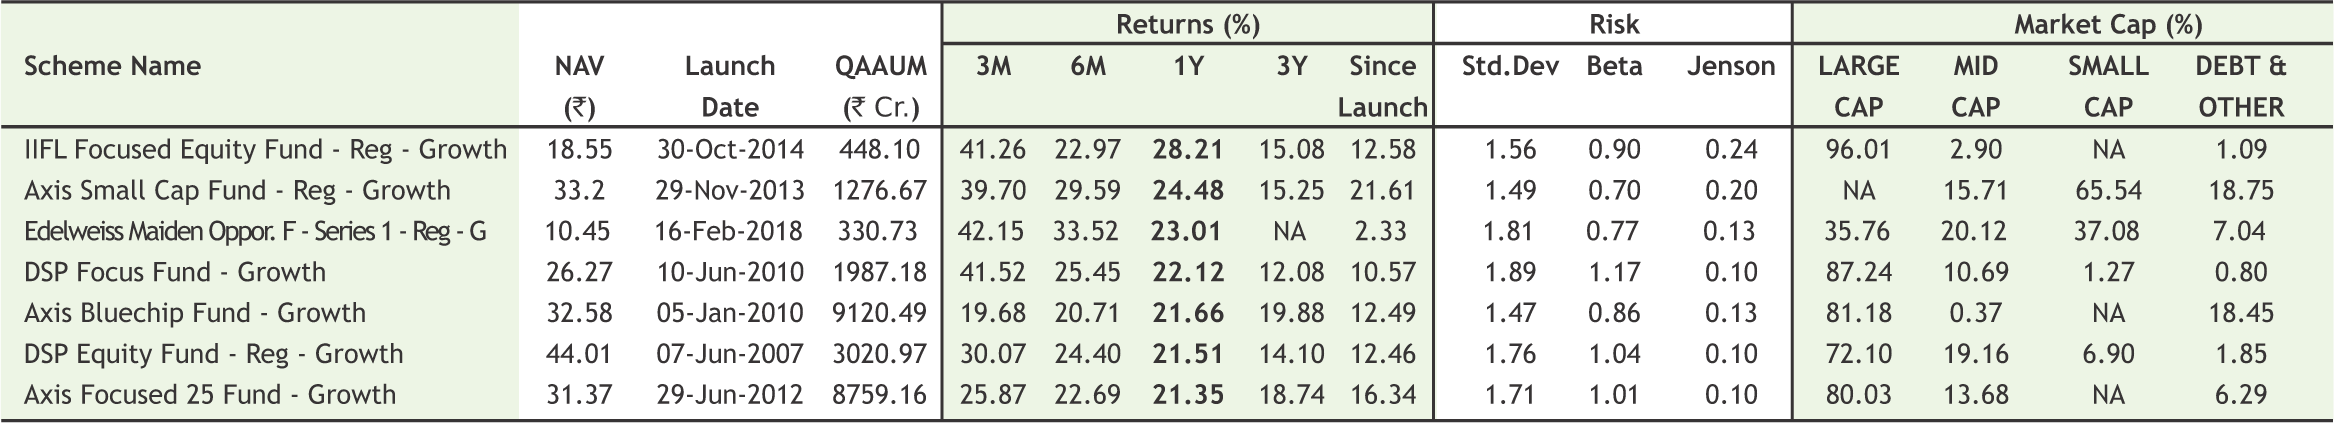
|
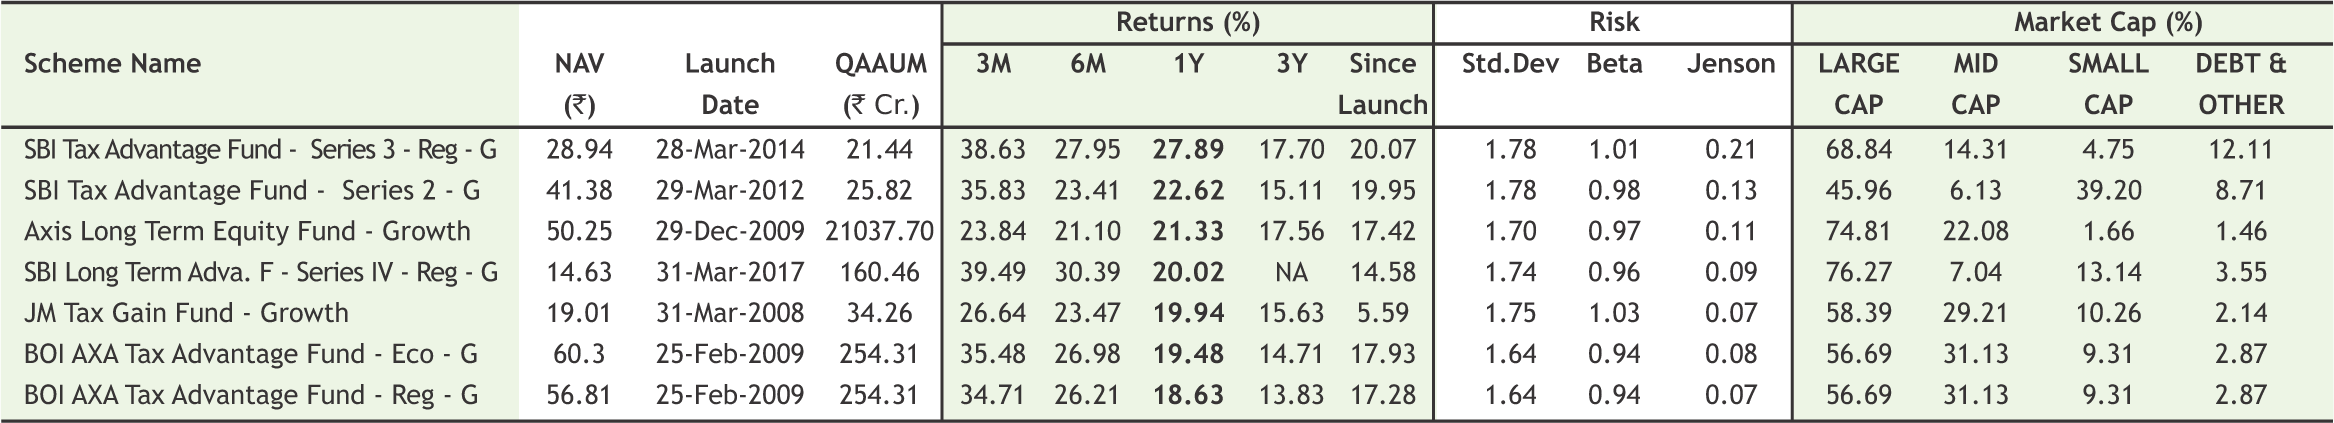
|
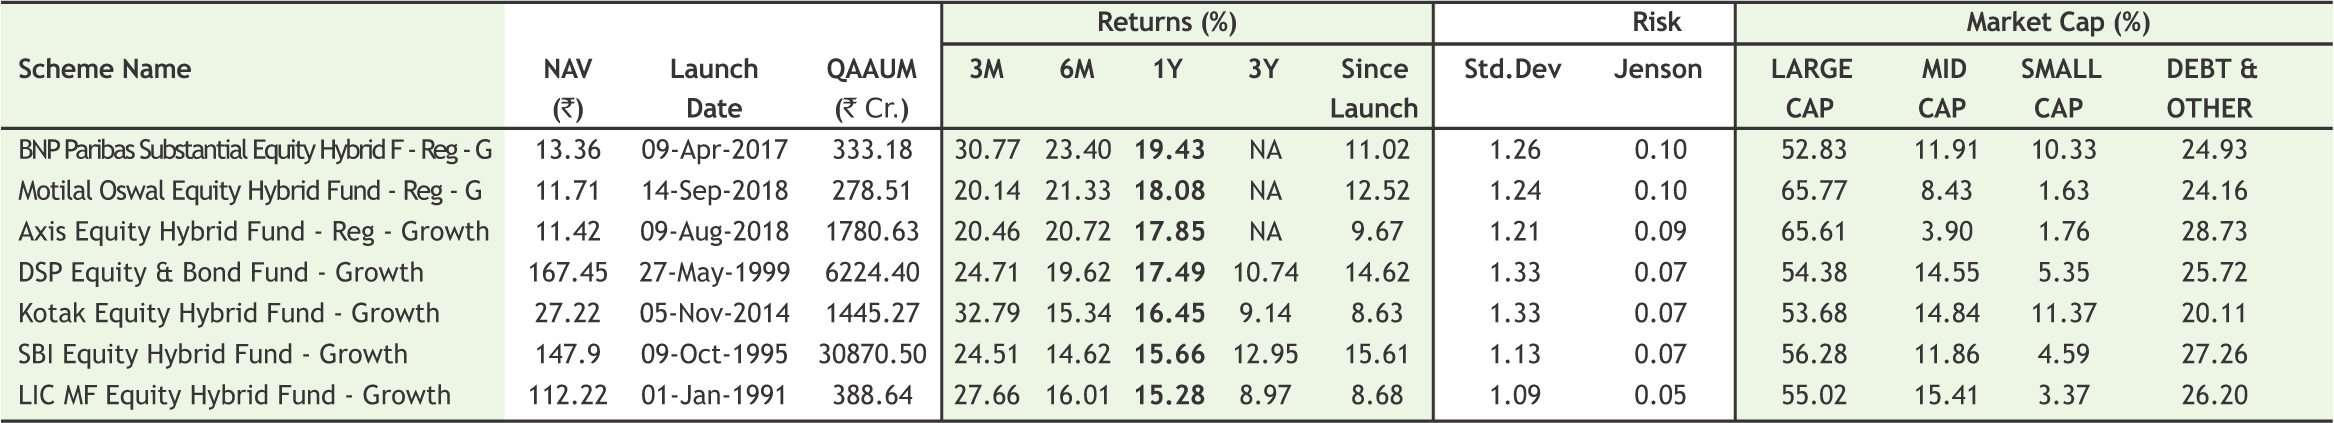
|
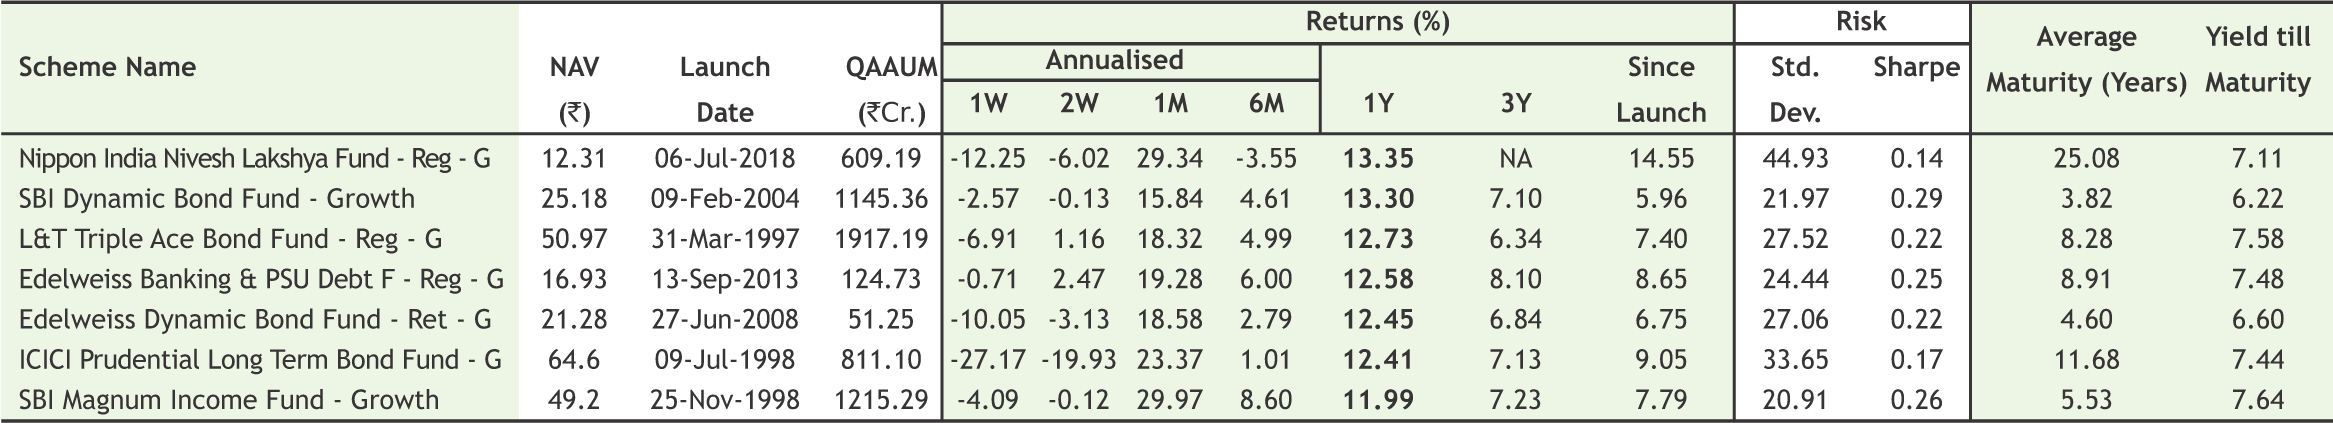
|
|
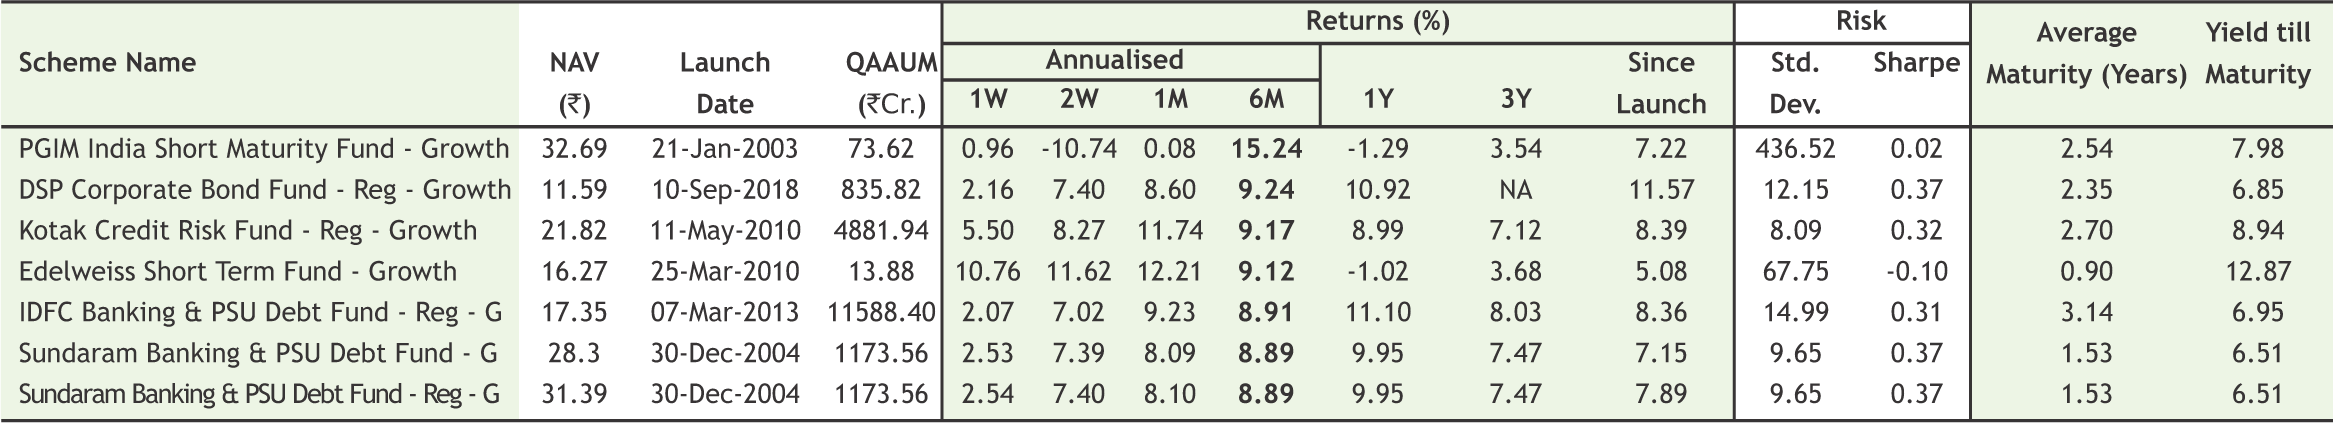
Note:Indicative corpus are including Growth & Dividend option . The above mentioned data is on the basis of 08/08/2019 Beta, Sharpe and Standard Deviation are calculated on the basis of period: 1 year, frequency: Weekly Friday, RF: 7%
*Mutual Fund investments are subject to market risks, read all scheme related documents carefully
18
SMC has been conferred upon as the "Best Performer in Account Growth Rate (Big Dp’s)" & "Top Performer In New Account Opened (Non-Banking Categories -3rd Position)" during the 34th NSDL DP Conference 2019 held on 14th December, 2019 at Taj Mahal Hotel, New Delhi.
Dr. D K Aggarwal (CMD, SMC Investments & President, PHDCCI) signed an MoU on behalf of PHD Chamber of Commerce and Industry with National Productivity Council, under DPIIT, M/o Commerce and Industry, Government of India on 2nd January, 2020 at NPC Head Office, New Delhi.
Mr. Mahesh C Gupta (Vice CMD,SMC Group), Mrs. Reema Garg (Director & CHRO, SMC Global Securities Limited) & Mr. Ayush Aggarwal (Director, SMC Group) along with SMC Employees during the quarterly birthday celebration held at SMC Head Office & Daryaganj Office, New Delhi.
www.smcindiaonline.com

REGISTERED OFFICES:
11 / 6B, Shanti Chamber, Pusa Road, New Delhi 110005. Tel: 91-11-30111000, Fax: 91-11-25754365
MUMBAI OFFICE:
Lotus Corporate Park, A Wing 401 / 402 , 4th Floor , Graham Firth Steel Compound, Off Western Express Highway, Jay Coach Signal, Goreagon (East) Mumbai - 400063
Tel: 91-22-67341600, Fax: 91-22-67341697
KOLKATA OFFICE:
18, Rabindra Sarani, Poddar Court, Gate No-4,5th Floor, Kolkata-700001 Tel.: 033 6612 7000/033 4058 7000, Fax: 033 6612 7004/033 4058 7004
AHMEDABAD OFFICE :
10/A, 4th Floor, Kalapurnam Building, Near Municipal Market, C G Road, Ahmedabad-380009, Gujarat
Tel : 91-79-26424801 - 05, 40049801 - 03
CHENNAI OFFICE:
Salzburg Square, Flat No.1, III rd Floor, Door No.107, Harrington Road, Chetpet, Chennai - 600031.
Tel: 044-39109100, Fax -044- 39109111
SECUNDERABAD OFFICE:
315, 4th Floor Above CMR Exclusive, BhuvanaTower, S D Road, Secunderabad, Telangana-500003
Tel : 040-30031007/8/9
DUBAI OFFICE:
2404, 1 Lake Plaza Tower, Cluster T, Jumeriah Lake Towers, PO Box 117210, Dubai, UAE
Tel: 97145139780 Fax : 97145139781
Email ID : pankaj@smccomex.com
smcdmcc@gmail.com
Printed and Published on behalf of
Mr. Saurabh Jain @ Publication Address
11/6B, Shanti Chamber, Pusa Road, New Delhi-110005
Website: www.smcindiaonline.com
Investor Grievance : igc@smcindiaonline.com
Printed at: S&S MARKETING
102, Mahavirji Complex LSC-3, Rishabh Vihar, New Delhi - 110092 (India) Ph.: +91-11- 43035012, 43035014, Email: ss@sandsmarketing.in