2019: Issue 665, Week: 7th – 11th January

A Weekly Update from SMC (For private circulation only)


WISE MNEY

www.smcindiaonline.com

AWARDED THE BEST, TIME AND AGAIN.

Broking - Equity, Commodity, Currency | Wealth Management | Investment Banking | Insurance Broking | Real Estate Advisory | Distribution of IPOs, MFs, FDs & Bonds | Financing | Institutional Broking | Mortgage Advisory | Clearing Services | NRI & FPI Services | Research


SMC Global Securities Ltd., CIN : L74899DL1994PLC063609 | SMC Comtrade Ltd., CIN No. U67120DL1997PLC188881

Registered Address: 11/6-B, Shanti Chamber, Pusa Road, Delhi-110005, Tel +91-11-30111000 | website: www.smctradeonline.com

SEBI Reg. No. INZ000199438, Member: BSE (470), NSE (07714) & MSEI (1002), DP SEBI Regn. No. CDSL/NSDL-IN-DP-130-2015, Mutual Funds Distributor ARN No. 29345. SMC Comtrade Ltd. SEBI Regn. No. INZ000035839, Member: NCDEX (00021), MCX (8200) & ICEX (1010). SMC Investments and Advisors Limited, SEBI PMS Regn. No. INP000003435. SMC Insurance Brokers Pvt. Ltd. IRDAI Regn. No: DB 272/04 License No. 289 Valid upto 27/01/2020. Comtrade Ltd. • Real Estate Advisory services are offered through SMC Real Estate Advisors Pvt. Ltd.

Disclaimer: Investments in securities market are subject to market risks, read all the related documents carefully before investing • PMS is not offered in commodity derivative segment • Insurance is the subject matter of solicitation • All insurance products sold through SMC Insurance Brokers Pvt. Ltd. • Investment Banking Services provided by SMC Capitals Ltd. • Equity PMS and Wealth management services provided by SMC Investments & Advisors Ltd. • IPOs and Mutual Funds distribution services are provided by SMC Global Securities Ltd. • Financing Services provided by Moneywise Financial Services Pvt Ltd. • Commodity broking services provid

Contents


From The Desk Of Editor

U.S. markets saw sharp decline during the weekend on account of weak earnings forecast by Apple together with drop in industrial activity to two years low. Sentiments indicators including Fed surveys and consumer confidence polls showed more weakness than expectations. Ten year U.S. treasury yields traded near eleven months low in response to weak economic data out of U.S. Japanese markets too slid with the onset of New Year on global growth concerns owing to friction in U.S.-China trade. Manufacturing activity in China saw contraction in the month of December as IHS Markit purchasing managers’ index fell to 49.7 from 50.2 in November. The slowdown is expected to remain as new export orders slipped indicating waning effect of front loading of shipments. Meanwhile expectations of policy support from Chinese central bank has risen after it recently relaxed its conditions on targeted reserve requirement cuts to benefit more small firms.

Back at home, domestic market looked cautious driven by concerns about a global growth slowdown, amid news that the government is planning a massive farm relief package that may further worsen the fiscal health of the economy. However on the last session of the week, market closed on a strong note after a roller coaster ride, led by positive global cues and buying in banking & financials. On the economic front, India's industrial production data for November 2018 will be unveiled on 11 January 2019. India's industrial output rose 8.1% from a year earlier in October 2018, following a 4.5% growth in the previous month. On the global front, China and the United States will hold trade talks in Beijing on January 7-8. Stock specific activity is expected on the bourses as result season is about to start with IT major Tata Consultancy Services (TCS) scheduled to announce Q3 December 2018 results on 10th January 2019. Macroeconomic data, trend in global markets, investment by foreign portfolio investors (FPIs) and domestic institutional investors (DIIs), the movement of rupee against the dollar and crude oil price movement will dictate the trend on the bourses.

On the commodity market front, the first week of 2019 was a mix week where we saw correction in industrial metals, some gains in precious metals and fresh buying in crude and some agri commodities. Gold can again test the resistance of 32200 levels taking support near 31500 levels while silver can move further northwards and can test 40200 levels. Crude oil prices may continue to hover in narrow range as it seems that the steep downfall being witnessed in past few weeks has paused for some time. Crude oil prices are expected to consolidate in the range of 3100 -3480 levels. In base metal counter, prices can remain subdued on weaker US and Chinese economic data. ISM Non-Manufacturing/Services Composite, FOMC Meeting Minutes, Consumer Price Index Ex Food and Energy and CPI of US, New Yuan Loans and CPI of China, Bank of Canada Rate Decision, CPI of Mexico, etc are some data and events scheduled this week.


(Saurabh Jain)


SMC Global Securities Ltd. (hereinafter referred to as “SMC”) is a registered Member of National Stock Exchange of India Limited, Bombay Stock Exchange Limited and its associate is member of MCX stock Exchange Limited. It is also registered as a Depository Participant with CDSL and NSDL. Its associates merchant banker and Portfolio Manager are registered with SEBI and NBFC registered with RBI. It also has registration with AMFI as a Mutual Fund Distributor.

SMC is a SEBI registered Research Analyst having registration number INH100001849. SMC or its associates has not been debarred/ suspended by SEBI or any other regulatory authority for accessing /dealing in securities market.

SMC or its associates including its relatives/analyst do not hold any financial interest/beneficial ownership of more than 1% in the company covered by Analyst. SMC or its associates and relatives does not have any material conflict of interest. SMC or its associates/analyst has not received any compensation from the company covered by Analyst during the past twelve months. The subject company has not been a client of SMC during the past twelve months. SMC or its associates has not received any compensation or other benefits from the company covered by analyst or third party in connection with the research report. The Analyst has not served as an officer, director or employee of company covered by Analyst and SMC has not been engaged in market making activity of the company covered by Analyst.

The views expressed are based solely on information available publicly available/internal data/ other reliable sources believed to be true.

SMC does not represent/ provide any warranty express or implied to the accuracy, contents or views expressed herein and investors are advised to independently evaluate the market conditions/risks involved before making any investment decision.

EQUITY


NEWS

DOMESTIC NEWS

Economy

• India's manufacturing growth slowed slightly in December, but the pace remained strong amid robust sales, data from IHS Markit. The headline Nikkei manufacturing purchasing managers' index, or PMI, fell to 53.2 in December from 54.0 in November. Any reading above 50 indicates an expansion in the sector.

Pharmaceuticals

• Sun Pharma announced has completed acquisition of Japan-based Pola Pharma to strengthen its presence in dermatology segment across the globe. Pola Pharma’s portfolio mainly comprises dermatology products. It has two manufacturing facilities in Saitama with capabilities to manufacture topical products and injectables.

• Alembic Pharmaceutical received approval from the US health regulator for Pramipexole Dihydrochloride extended-release tablets used for the treatment of Parkinson’s disease. It has an estimated market size of $38.6 million.

Realty/ Construction

• Capacite Infraprojects has bagged orders worth Rs 97.69 crore for RCC, civil, high side MEP works for sub-structure and superstructure of proposed research building of the Institute of Chemical Technology at Matunga Mumbai.

Capital Goods

• BHEL has bagged an order worth Rs 3,500 crore for setting up a 660 MW supercritical Sagardigh thermal power plant in West Bengal by West Bengal Power Development Corporation (WBPDCL) at Manigram village in Murshidabad district of West Bengal.

• L&T announced its construction arm has won orders worth Rs 1,060 crore in the domestic market. The smart world and communication business has secured a major order from the Andhra Pradesh State FiberNet Limited (APSFL) for Bharatnet Phase-II works to establish an IP/MPLS Infrastructure covering the 13 districts of Andhra Pradesh.

Hotels

• Lemon Tree Hotels will soon be introducing its co-living prototype in the country as early as March 2019. Hamstede Living, its joint venture with global private equity major Warburg Pincus, will also launch a coliving brand that will tap into the sharing/ renting trend that's fast catching up with the millennial population in India.

Information Technology

• Tata Consultancy Services announced that Emirates NBD, the Middle East's leading financial services group, has chosen TCS BaNCS for Payments as its core processing platform to standardize and streamline payments operations across multiple geographies, including lndia, Egypt, Saudi Arabia, Singapore, UK and their home market, the United Arab Emirates.

INTERNATIONAL NEWS

• U.S. Jobless claims rebounded in the week ended December 29th, The Labor Department said initial jobless claims rose to 231,000, an increase of 10,000 from the previous week's upwardly revised level of 221,000. Economists had expected jobless claims to climb to 220,000.

• US pending home sales index fell by 0.7 percent to 101.4 in November after plunging by 2.6 percent to 102.1 in October. The continued decline in pending home sales matched economist estimates.

• Eurozone manufacturing expanded at the weakest pace since early 2016 in December as new orders fell for a third month and business confidence eroded to a six-year low, results of the survey by IHS Markit showed. The final Eurozone Manufacturing Purchasing Managers' Index, or PMI, was 51.4, unchanged from the flash, but lower than November's 51.8.

• U.K. construction sector growth was the weakest in three months in December amid a slower rise in commercial work, survey data from IHS Markit. The CIPS Purchasing Managers' Index, or PMI, fell to 52.8 from 53.4 in November. The latest reading was in line with economists' expectations.

• China's manufacturing activity fell in December, due to a decline in new orders, for the first time since May 2017, survey data from IHS Markit showed. The headline seasonally adjusted Caixin Factory Purchasing Managers' Index, or PMI, fell to 49.7 from 50.2 in November.

• Hong Kong retail sales growth slowed far more-than-expected in November, figures from the Census and Statistics Department showed. The retail sales volume grew 1.2 percent year-on-year, following a 5.3 percent increase in October. Economists had expected sales growth of 4.2 percent.


TREND SHEET


Stocks *Closing Price Trend Date Trend Changed Rate Trend Changed SUPPORT RESISTANCE Closing S/l
S&P BSE SENSEX* 35695 DOWN 05.10.18 34970 - 36500
NIFTY50** 10727 DOWN 05.10.18 10316 - 11000
NIFTY IT 14146 UP 21.07.17 10712 13600 13400
NIFTY BANK 27195 UP 30.11.18 26863 25900 25400
ACC 1469 UP 16.11.18 1501 1450 1430
BHARTIAIRTEL 322 DOWN 25.01.18 453 340 350
BPCL*** 359 UP 16.11.18 322 345 330
CIPLA 513 DOWN 26.10.18 604 550 560
SBIN 298 UP 02.11.18 286 270 260
HINDALCO 211 DOWN 04.01.19 211 225 230
ICICI BANK 365 UP 02.11.18 355 335 325
INFOSYS 661 UP 14.12.18 706 660 640
ITC 281 DOWN 05.10.18 277 290 295
L&T 1388 UP 02.11.18 1358 1360 1320
MARUTI 7235 DOWN 14.09.18 8627 7600 7800
NTPC 146 DOWN 26.10.18 159 152 155
ONGC 146 DOWN 05.10.18 147 155 158
RELIANCE**** 1099 UP 30.11.18 1168 - 1070
TATASTEEL 488 DOWN 26.10.18 552 520 540

*SENSEX has breached the resistance of 35700
**NIFTY has breached the resistance of 10700
***RELIANCE has broken the support of 1100

Closing as on 04-01-2019

NOTES:

1) These levels should not be confused with the daily trend sheet, which is sent every morning by e-mail in the name of "Morning Mantra ".

2) Sometimes you will find the stop loss to be too far but if we change the stop loss once, we will find more strength coming into the stock. At the moment, the stop loss will be far as we are seeing the graphs on weekly basis and taking a long-term view and not a short-term view.


FORTHCOMING EVENTS


Meeting Date Company Purpose
7-Jan-19 Syndicate Bank Fund Raising
8-Jan-19 Multi Comm. Exc. Fund Raising
9-Jan-19 IndusInd Bank Financial Results
10-Jan-19 Bandhan Bank Financial Results
10-Jan-19 Tata Consultancy Services Financial Results/Dividend
11-Jan-19 Reliance Industria Infrastructure Financial Results
11-Jan-19 Infosys Financial Results
12-Jan-19 The Jammu & Kashmir Bank Financial Results
15-Jan-19 Zee Entertainment Ent. Financial Results
16-Jan-19 MindTree Financial Results/Dividend
17-Jan-19 AU Small Finance Bank Financial Results
18-Jan-19 Wipro Financial Results/Dividend
19-Jan-19 HDFC Bank Financial Results
21-Jan-19 HDFC Asset Management Company Financial Results
22-Jan-19 TVS Motor Company Financial Results
23-Jan-19 Pidilite Industries Financial Results
24-Jan-19 Colgate Palmolive (India) Financial Results
24-Jan-19 UltraTech Cement Financial Results
25-Jan-19 Swaraj Engines Financial Results
25-Jan-19 M&M Fin.Serv. Financial Results
Ex-Date Company Purpose
10-Jan-19 10-Jan-19 Buy Back
15-Jan-19 Gujarat Gas FV Split (Sub-Division) - From Rs 10/- To Rs 2/- Per Share
17-Jan-19 Tata Consultancy Services Interim Dividend
23-Jan-19 MindTree Interim Dividend

4

EQUITY


5

EQUITY


Beat the street - Fundamental Analysis


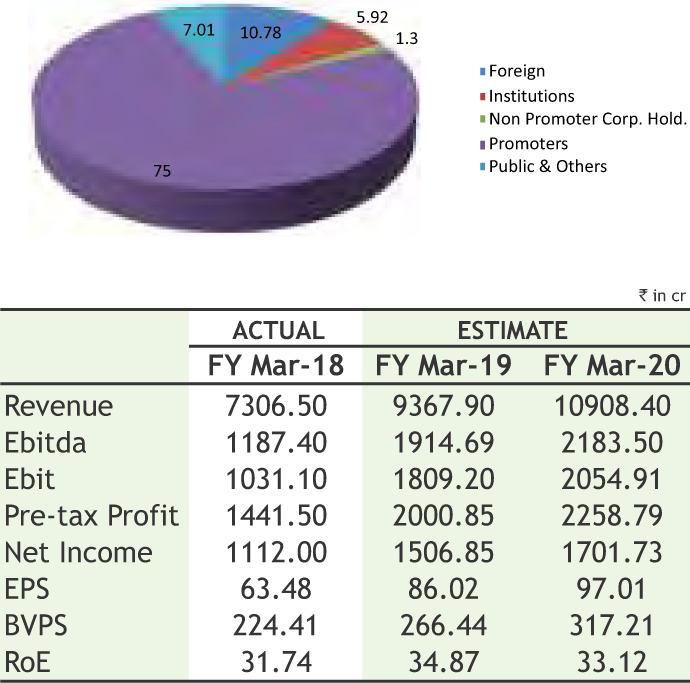
LARSEN & TOUBRO INFOTECH LIMITED

CMP: 1727.00

Target Price: 2037

Upside:18%

VALUE PARAMETERS

Face Value (Rs.) 1.00
52 Week High/Low 1990.00/1078.00
M.Cap (Rs. in Cr.) 30087.88
EPS (Rs.) 76.91
P/E Ratio (times) 22.56
P/B Ratio (times) 7.51
Dividend Yield (%) 1.23
Stock Exchange BSE

% OF SHARE HOLDING

Investment Rationale

• L&T InfoTech is a technology consulting and digital solutions company. The company’s range of services includes application development, maintenance & outsourcing, enterprise solutions, infrastructure management services, testing, digital solutions and platform-based solutions.

• Its Q2 revenue growth was driven by Digital Services that makes up 37% of revenues. The company secured another large deal from a global pharma company with a net-new TCV of Rs. 385 Crores. The company serves 60 Fortune 500 companies. It has over the past few quarters signed 12 large deals with contract value of about $500 million. Company saw a healthy pipeline, continued large deal momentum and uptick in Digital Services across all verticals.

• The company has added a total of 1,264 employees during Q2 FY19 and utilization levels improved to 80.4%. The total number of employees now stands at 26,414. Attrition rates were also lower at 15.3%.

• Operational efficiencies, lower visa cost and tailwinds from INR depreciation during Q2 helped the company expand its margins. Analytics, AI and Cognitive grew at 20% and Enterprise Integration and mobility also grew at 25%. Retail & Pharma vertical grew at 15%.

• In Q2FY19, revenue came in at Rs 2,331 crores growing by 33.1% YoY. The corresponding constant currency growth was 22.9% YoY. The Rupee topline growth was aided by sharp INR depreciation during the quarter. The EBIT for the quarter was Rs. 442 crores which grew 74.4% YoY. EBIT margin for Q2 stood at 19%. Given its relationship with large clients (R&D spenders) and its presence in high

growth verticals, management has guided for revenue growth of 18% over the FY19 to FY21.

Risk

• Intense competition in IT services

• Adverse exchange rate fluctuations

Valuation

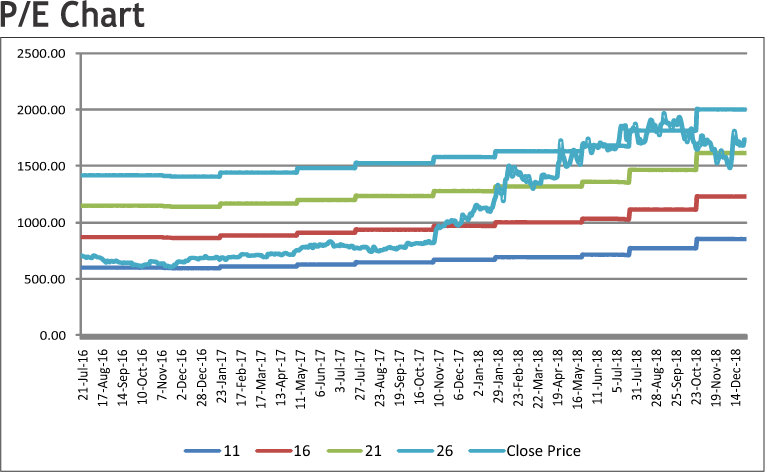
The company has adopted a four-pronged strategy viz. build in-house expertise, augment capabilities in focused areas, forge alliances and partnerships and cocreate with customers. The management of the company believes that high growth in digital will continue as customers leverage new/exponential technologies. The Company has a strong domain expertise derived from its parentage. It is at an inflection point, being right sized to attain agility of a start-up while maintaining stability of an established player which gives it a competitive advantage against its peers. We expect the stock to see a price target of Rs. 2,037 in 8-10 months time frame on an expected P/E of 21x and FY20E EPS of 97.01.

JUBILANT FOODWORKS LIMITED

CMP: 1238.60

Target Price:1505

Upside:22%

VALUE PARAMETERS

Face Value (Rs.) 10.00
52 Week High/Low 1575.00/896.65
M.Cap (Rs. in Cr.) 16345.69
EPS (Rs.) 21.71
P/E Ratio (times) 57.0
P/B Ratio (times) 14.15
Dividend Yield (%) 0.20
Stock Exchange BSE

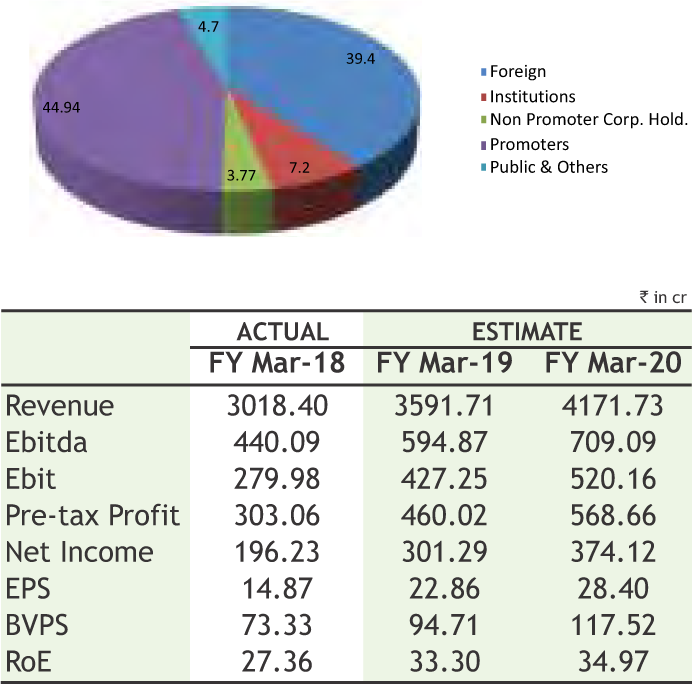
% OF SHARE HOLDING

Investment Rationale

• Jubilant FoodWorks Limited is one of India’s largest food service company, with a network of 1167 Domino’s Pizza restaurants across 269 cities. The company has the exclusive rights to develop and operate Domino’s Pizza brand in India, Sri Lanka and Bangladesh. It also has exclusive rights for developing and operating Dunkin’ Donuts restaurants for India and has 32 restaurants.

• The company has recently announced PepsiCo India as its beverage partner to further enhance customer experience. It has tied up with Golden Harvest to launch Domino’s Pizza Restaurants in Bangladesh. Company is growing at a very strong pace owing to recent product upgrades, Every Day Value (EDV) extension to regular pizza and the continued momentum of online sales driven by the new Domino’s app. Online sales were 68% of the delivery sales in Q2 FY19 which was higher by 11% YoY.

• The Company added 24 new stores in Q2 FY19 and is on track to open a total of 75 new stores by end of FY 19 as guided by the management. Same store sales growth came in at an impressive 20.5% owing to new initiatives which was reflected in higher number of orders and increased frequency of ordering.

• The management believes that there is a strong traction in the sales growth due to surge in the demand driven by aggregators and eCommerce players due to promotional efforts and increased visibility from food aggregators.

• The company posted operating revenues of Rs.881 Crores, a growth of 21.3% YoY in the quarter ended Sept 2018. EBITDA came in at Rs.147.5 crores at 16.7% of revenue, a growth of 44.4% YoY. Profit after Tax was at Rs.77.7 crores at 8.8% of revenue and a

showing a growth of 60.2%YoY. The management believes that despite significantly increased competitive intensity, Q2FY19 was yet another strong quarter delivered by their continued focus on the basics and innovation.

Risk

• Competition from other food chains and unorganised players

• Inability to meet prescribed food health and safety standards

Valuation

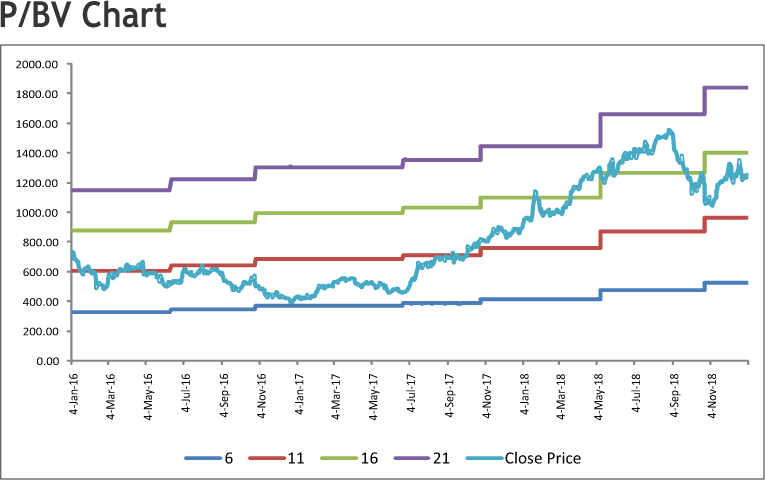
Urbanisation, more women in the workforce, and a youthful population are the growth drivers for Jubilant. The company is continuously launching new products and sides to gain traction on sales. Busy lifestyles and higher discretionary expenditure and experimental nature of Indian consumers with increased exposure to the culture of their western counterparts will bore well for the company. We expect the stock to see a price target of Rs. 1,505 in 8-10 months time frame on an expected P/Bv of 12.81x and FY20E BVPS of 117.52.

Source: Company Website Reuters Capitaline

Above calls are recommended with a time horizon of 8 to 10 months.


6

EQUITY


Beat the Street-Technical Analysis

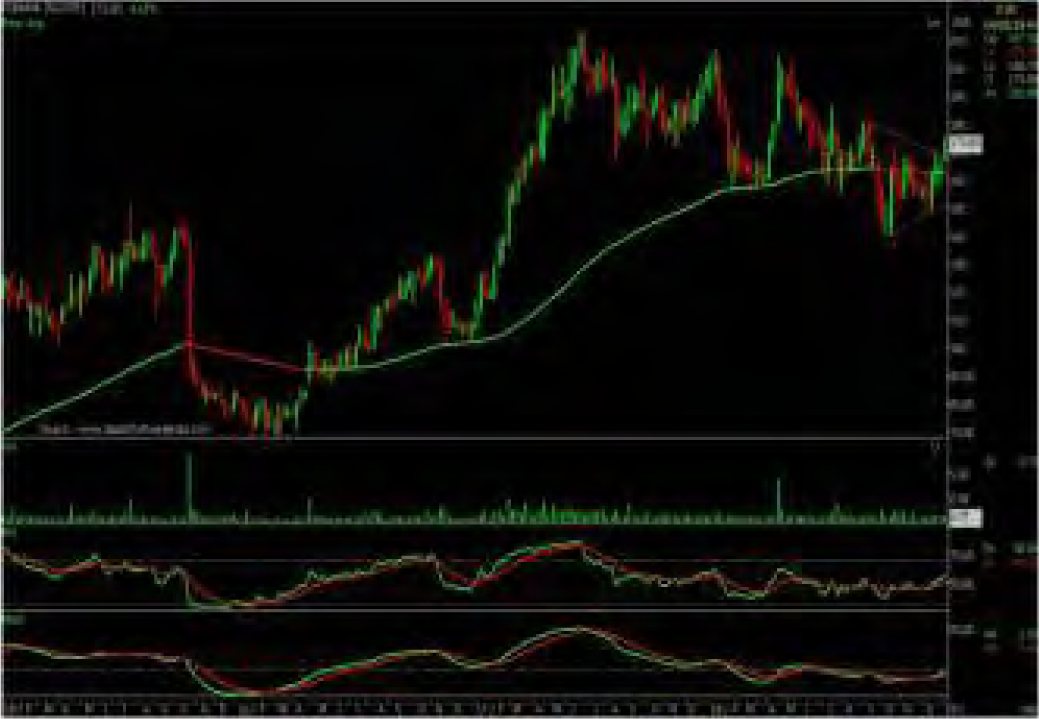
DCB Bank Limited (DCBBANK)

The stock closed at Rs 173.80 on 04th January, 2019. It made a 52-week low at Rs 139.85 on 01st October 2018 and a 52-week high of Rs. 206.50 on 09th January 2018. The 200 days Exponential Moving Average (DEMA) of the stock on the daily chart is currently at Rs 166.49

As we can see on chart that stock was consolidated in the range of 140 to 174 levels for three months and formed a “Continuation Triangle” on weekly charts which is bullish in nature. Last week, stock gained over 4% and has given the breakout of pattern and also managed to close above the same. So buying momentum may continue for coming days. Therefore, one can buy in the range of 171-172 levels for the upside target of 190-194 levels with SL below 158.

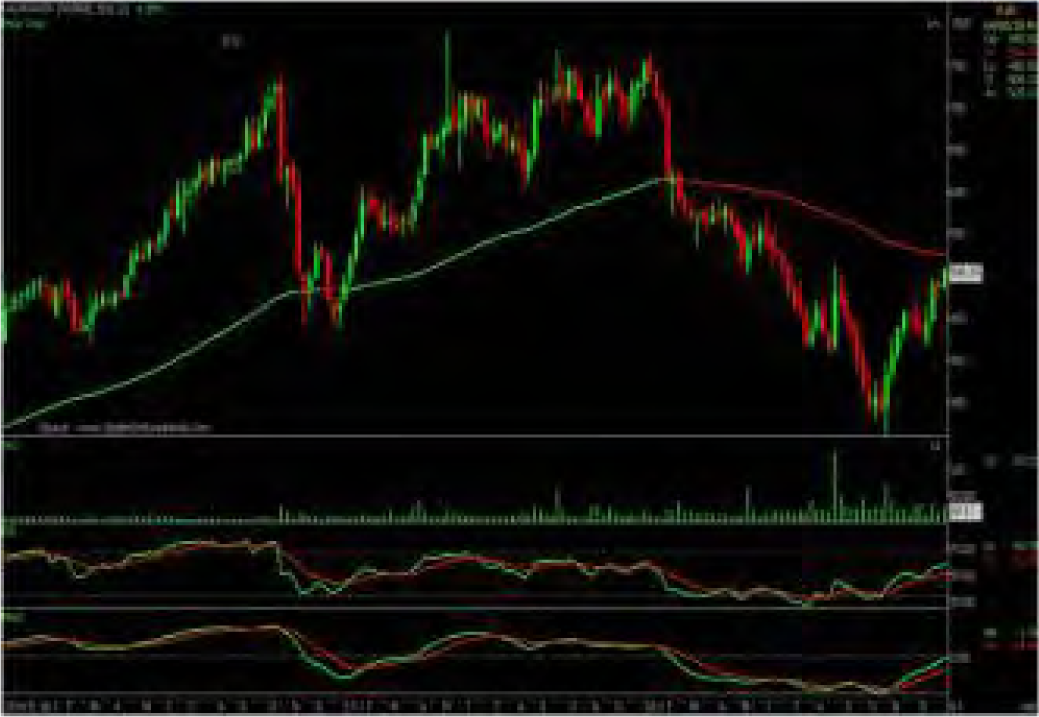
Kajaria Ceramics Limited (KAJARIACER)

The stock closed at Rs 506.10 on 04th January, 2019. It made a 52-week low at Rs 310 on 25th October 2018 and a 52-week high of Rs. 764.90 on 10th January 2018. The 200 days Exponential Moving Average (DEMA) of the stock on the daily chart is currently at Rs 480.59

The stock has recovered sharply from yearly low of 310 and tested 500 levels in short span of time. Moreover, it was forming an “Inverted Head and Shoulder” pattern on weekly charts, which is considered to be bullish. Last week, stock registered gains over 4% and has given the neckline breakout of pattern and also closed near week’s high along with the volumes, which indicates buying is more aggressive for the stock. Therefore, one can buy in the range of 500-502 levels for the upside target of 540-550 levels with SL below 480.


Disclaimer : The analyst and its affiliates companies make no representation or warranty in relation to the accuracy, completeness or reliability of the information contained in its research. The analysis contained in the analyst research is based on numerous assumptions. Different assumptions could result in materially different results.

The analyst not any of its affiliated companies not any of their, members, directors, employees or agents accepts any liability for any loss or damage arising out of the use of all or any part of the analysis research.

SOURCE: CAPITAL LINE

Charts by Spider Software India Ltd

Above calls are recommended with a time horizon of 1-2 months

7

DERIVATIVES


WEEKLY VIEW OF THE MARKET


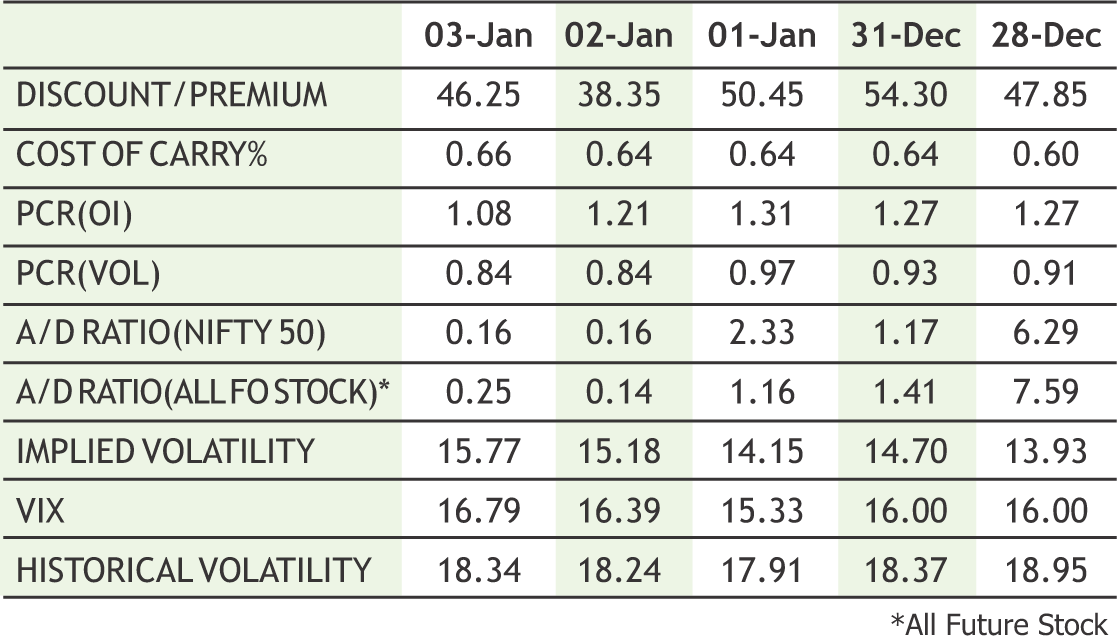
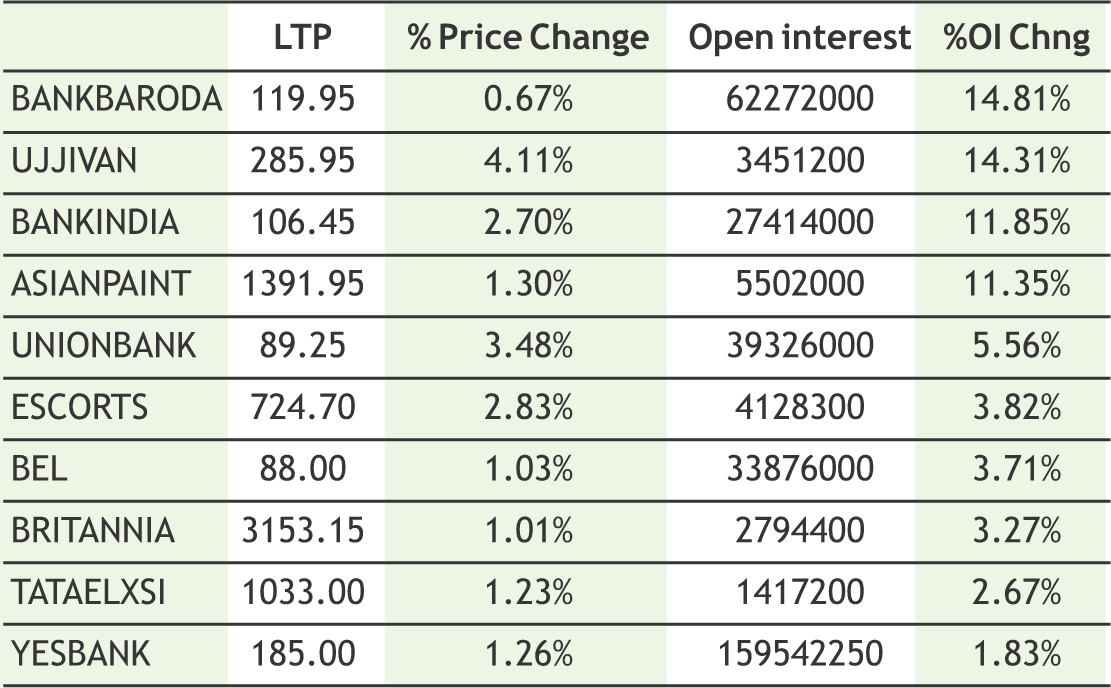
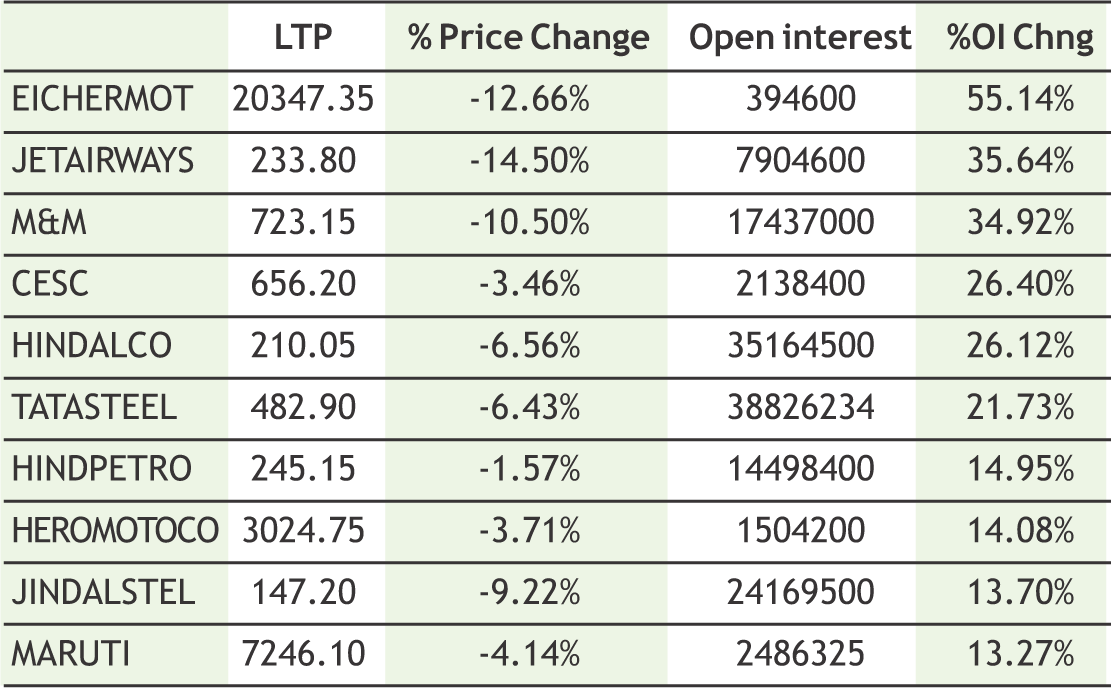
Recovery led by short covering from lower levels was witnessed. Calls writers covered their short positions and put writers sold puts. Derivative data has turned mildly positive. Maximum put open interest buildup of more than 40 lakh, shares at 10500 puts was seen which should act as strong support zone. Nifty is most likely to trade in the range of 10650 to 10850 this week. Nifty has support at lower levels. Various supports are 10500 & 10600/10650 spot levels. Option put writers were active in recent rally. The Implied Volatility (IV) of calls closed at 15.77% while that for put options closed at 15.20%. The Nifty VIX for the week closed at 16.79% and is expected to remain sideways. Among Nifty Call options, the 11000-strike call has the highest open interest of more than 35lakh shares. The PCR OI for the week closed up at 1.08 which indicates OTM put writing. On the technical front, 10600-10650 spot level is strong support zone and current bounce is likely to continue towards 10800-10850 levels.


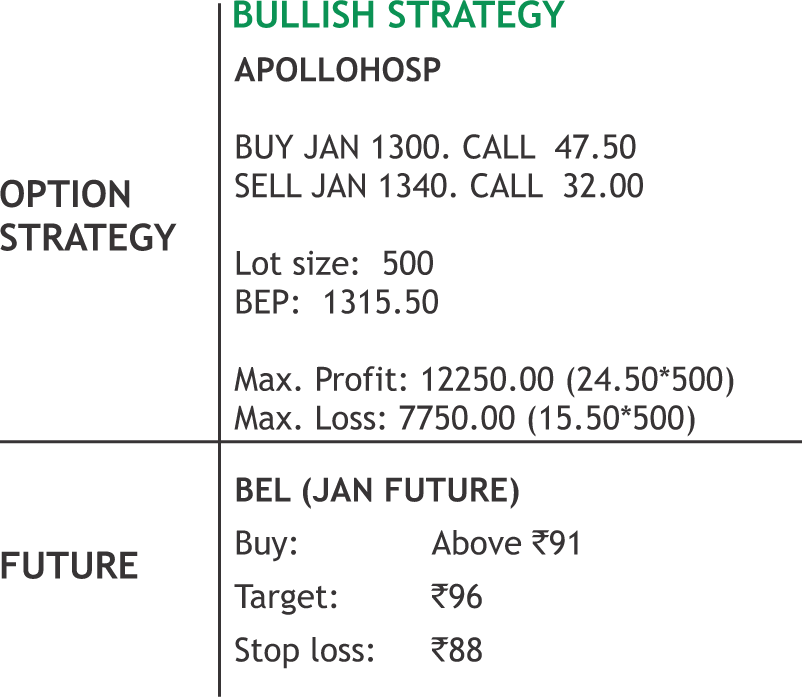
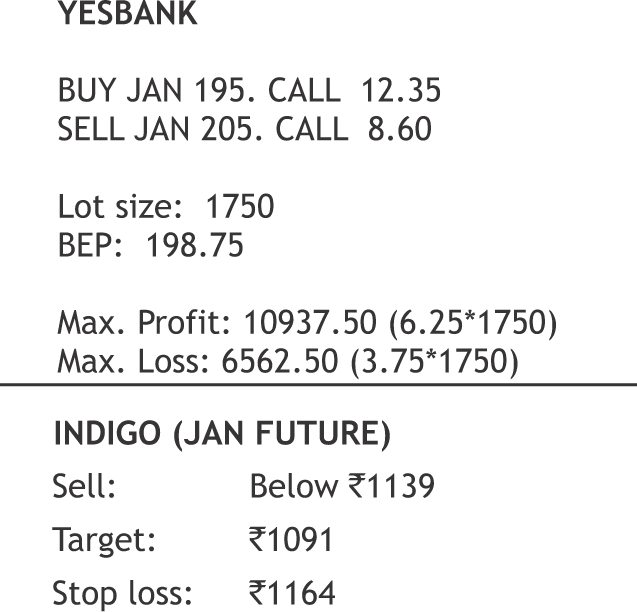
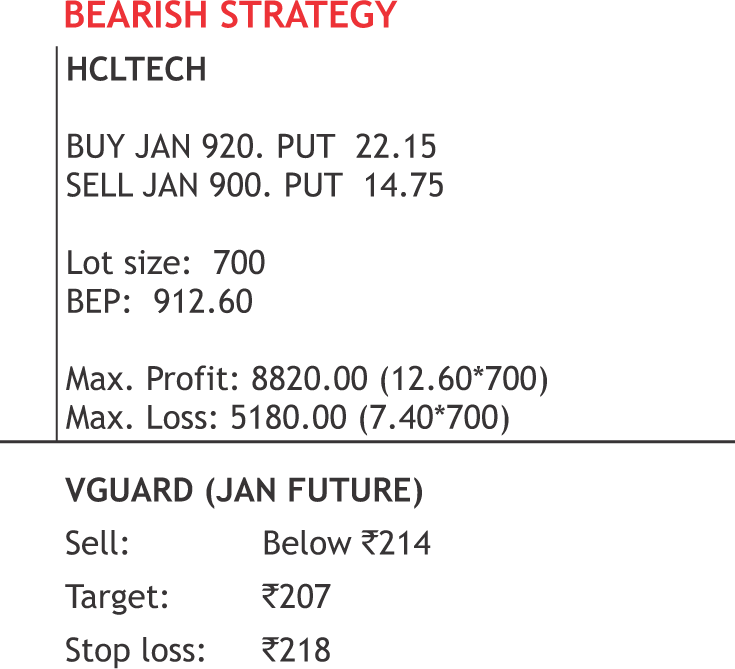
DERIVATIVE STRATEGIES


NIFTY OPTION OI CONCENTRATION (IN QTY) (MONTHLY)


CHANGE IN NIFTY OPTION OI (IN QTY) (MONTHLY)


BANKNIFTY OPTION OI CONCENTRATION (IN QTY) (MONTHLY)


CHANGE IN BANKNIFTY OPTION OI (IN QTY) (MONTHLY)


8

DERIVATIVES


SENTIMENT INDICATOR (NIFTY)


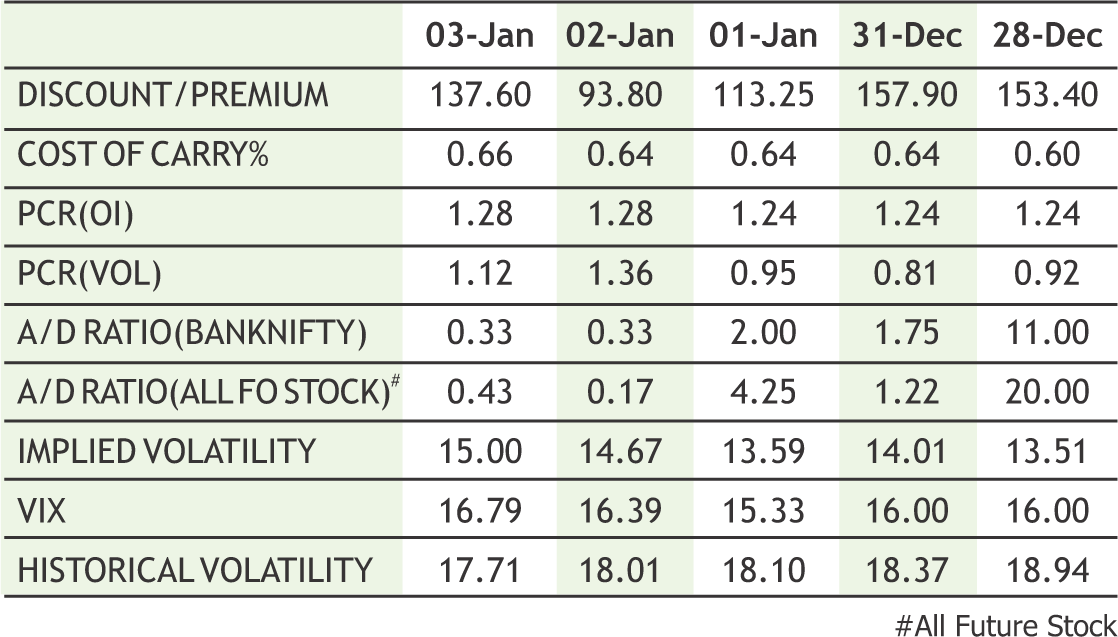
SENTIMENT INDICATOR (BANKNIFTY)


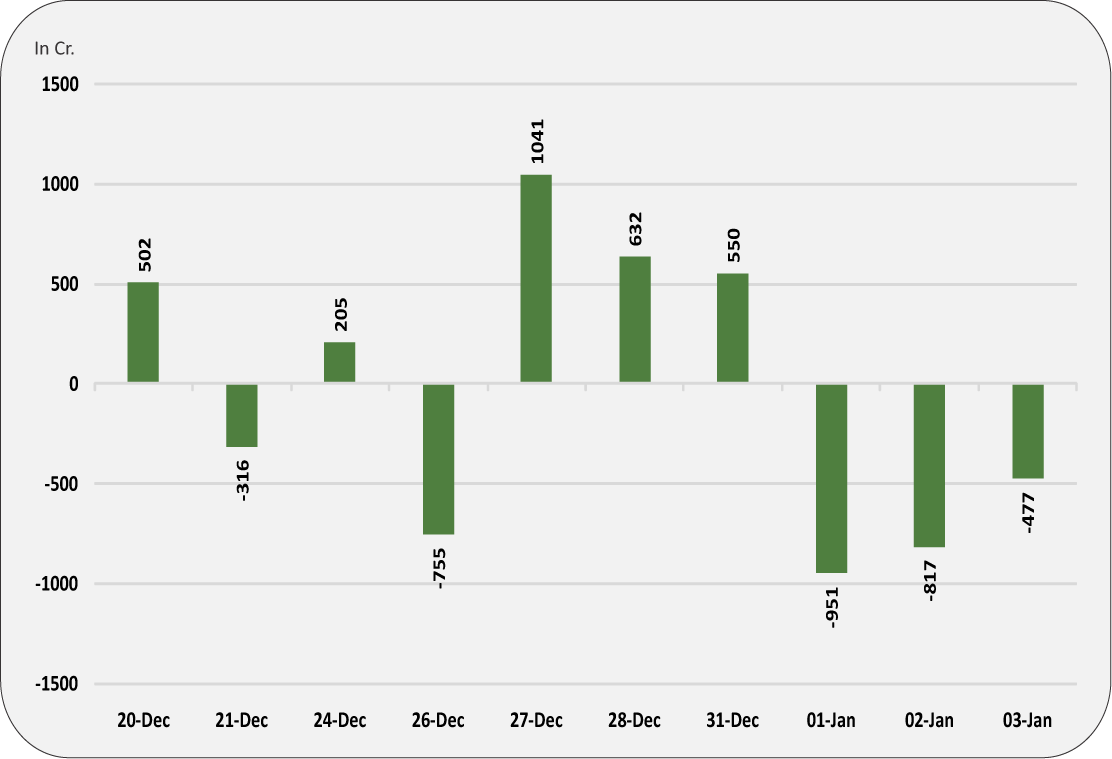
FII’S ACTIVITY IN INDEX FUTURE


FII’s ACTIVITY IN DERIVATIVE SEGMENT


Top 10 Rollover


Bottom 10 Rollover


**The highest call open interest acts as resistance and highest put open interest acts as support.

# Price rise with rise in open interest suggests long buildup | Price fall with rise in open interest suggests short buildup

# Price fall with fall in open interest suggests long unwinding | Price rise with fall in open interest suggests short covering


9

COMMODTY


SPICES


Coming week, lower level buying can be seen near 6550 levels in turmeric futures (Apr), eyeing a target of 6750-6850 levels. It is expected that this counter would hold on to 6500 levels & the downside may remain capped. The fresh crop is likely to enter the spot markets in mid-January, but prices are unlikely to fall for the time due to lower carryover stocks. Prices of good quality turmeric are showing signs of improvement at the markets in Erode and the buyers are purchasing medium and even the poor quality to fulfil their local orders. Jeera futures (Mar) is expected to remain trapped in a consolidation zone in the range of 17000-18200 levels with upside getting capped. The export demand at present is said to be sluggish, while domestic buyers are doing need-based buying due to expectations of correction ahead amid good crop outlook. Sowing of Jeera in Gujarat almost completed with area reached at 3.21 lakh hectares against normal (5 year average) area of 3.18 lakh hectares. An upside bias may be seen in coriander futures (Apr) as it can test 7000 levels. In markets of Rajasthan, buyers are actively procuring any commodity available due to expectations of better return amid concern about crop. Already, there are estimates of lower output this season & on the top of it, the winter temperature has been dropping below ideal level required for crops in many parts, has raised worries about crop loss. Under present conditions, it is being assessed that the crop is unlikely to hurt significantly, but quality is likely to damage extensively and thus coriander prices are in bullish momentum.

BULLIONS


Bullion counter, which have witnessed steady upside on safe haven buying on weaker greenback, tumbling stock markets and fears of a global economic slowdown, is expected to extend its rally further. However, on the domestic bourses, some appreciation in local currency may cap the upside. Gold can again test the resistance of 32200 taking support near 31500 while silver can move further northwards and can test 40200. Meanwhile weaker US economic data slammed the stock markets and pushed investors to bet that the Federal Reserve could reverse its policy tightening before the end of this year. Meanwhile Fed funds futures market now shows a 90% chance the Federal Reserve will stand pat on interest rates in 2019, or even make a cut. ISM manufacturing data for November month came at 54.1 against previous reading of 59.3 raising concern about health of US economy, which has been attracting gold as safe investment. Uncertainty related to US government shutdown is also keeping yellow metals supported on lower levels. The new Democratic-held House passed legislation that would end a partial government shutdown. The temporary spending measure would give lawmakers more time to work out an immigration compromise. But it would also delay, rather than resolve, the border wall impasse. U.S. Mint sales of American Eagle gold and silver coins dropped to their lowest in 11 years during 2018, U.S. Mint data showed recently as investors favored higher-yielding assets, despite global stock and bond market volatility late in the year. SPDR Gold Trust, holdings stood at 795.31 tonne recently.


OIL AND OILSEEDS


Since past two weeks, soybean prices on the domestic bourse have shown a decent upside on the back of slow farmers selling on the spot markets. Going ahead, the same positive momentum is likely to continue & the forward month contract (Feb) is expected to test 3580 levels. Soybean arrivals had dropped significantly in the country due to slow farmers selling at lower rates and they are waiting for appreciation in prices. Soybean outlook in the domestic market seems to be steady to positive due to prospects of better meal exports this FY 2018-19 followed by good domestic demand. According to market participants Iran, missing from the list of major buyers of Indian soymeal for years, may end up buying a significant quantity from India in 2018-19 (OctSep) & may become one of the largest buyers of Indian soymeal this year. Mustard futures (Jan) is likely to witness a lower level buying near 3880 & move higher to test 4000-4020 levels. The sentiments are positive due to improved demand from oil millers and mustard meal exporters. However, it is advised to keep a cautious approach as the stocks with farmers, processors, stockists and state-run agencies as on 31st Dec were estimated around 9.5 lakh tonnes & the new crop arrivals will begin in February and gain momentum by March. CPO futures (Dec) is trading near its 4-weeks high on the national bourse & in days to come we can see more upside of 540 levels, taking support near 520 levels. While, soy oil futures (Jan) is expected to surpass the resistance near 742 & test 748 levels. Once again, the weakening rupee has come into the picture making imports costlier.

ENERGY COMPLEX


Crude oil prices may continue to hover in narrow range as it seems that the steep downfall being witnessed in past few weeks has paused for time being. Oil prices continue to remain downbeat as U.S. followed most other major economies into a manufacturing downturn, although supply cuts by producer club OPEC kept declines in check. Crude oil prices are expected to consolidate in range of 3100 -3480. Despite the global market turmoil, traders said oil prices are expected to receive some support as supply cuts announced late last year by the Organization of the Petroleum Exporting Countries (OPEC) start to kick in. OPEC, Russia and other non-members agreed last December to reduce supply by 1.2 million bpd in 2019 versus October 2018 levels. The other minor supportive factor for crude oil was disruption in Libya where the closure of Sharara oilfield will lead to supply disruption of 8,500 Bpd to looting after three security breaches in a week. U.S. crude production stood at a record 11.7 million barrels per day (bpd) in late 2018, making the United States the world's biggest oil producer. The natural gas counter can continue to remain fragile on warmer weather forecast as its prices can further dip towards 195 levels taking resistance near 215 levels. Natural gas prices held near their lowest in three months on forecasts for warmer-than-normal weather through mid-January. Warmer than normal weather is expected to cover most of the United States for the next 8-14 day which should put downward pressure on natural gas demand.


OTHER COMMODITIES


Despite the fact that cotton output for the year 2018-19 (November–October) is expected fall way below initial estimates & also that recent arrivals have been dismal, with the total this season standing at only 11.5 million bales, the prices may not see an upside momentum. Day’s ahead, cotton futures (Jan) on MCX is expected to face resistance near 21300 levels. The reason being, cotton import will rise to a record high. According to preliminary estimates by the Cotton Association of India, we may see imports of 2.7 million bales in the current year. Also, the exports are also expected to shrink to 5.3 million bales this year, from 6.5 million bales the last year. On the international front, prices have fallen sharply for the second week in a row due to the U.S government shutdown. Guar seed futures (Feb) may consolidate in the range of 4250-4475 levels, while guar gum futures (Feb) will possibly face resistance near 8800 levels. Amid, volatility in crude oil prices in the international markets and global economy concern, the stockists are mostly sidelined. On the demand front, questions are being raised on guargum exports after it is reported that in U.S thousands of shale wells that were drilled in the last five years are pumping less oil and gas than their owners forecast to investors, due to less profitability of the fracking boom. The Wall Street Journal’s findings suggest current production levels may be hard to sustain without greater spending because operators will have to drill more wells to meet growth targets. Yet shale drillers are under pressure to cut spending in the face of a 40% crude-oil price decline since October.

BASE METALS


In base metal counter, prices can remain subdued on weaker Chinese economic data. China’s manufacturing sector remains an area of concern, while industrial profits are now barely positive, raising disinflationary concerns. China has launched a number of measures, including reductions in RRR for banks, tax cuts and more infrastructure spending, to ward off sharp growth deceleration. Copper may continue to extend its bearish momentum as its prices can test 390 level in MCX. Meanwhile Lead may remain on sideways bias as it can take support near 136 level while it has resistance near in 148level. Aluminium can witness further lower level buying as it can recover towards 136 taking support near 125 levels. Indian manufacturers urged the government to hike import duty on aluminium scrap and primary aluminium to 10 percent from 2.5 percent and 7.5 percent, respectively. Geopolitical factors such as sluggish growth in China, the world’s largest consumer of aluminium and the lifting of American sanctions on Russian producer Rusal, too, hit prices. Zinc can continue its weakness as it can test 164 levels. Chinese steel futures jumped to the highest in more than two months, buoyed by expectations that steel mills would replenish their stocks of the raw material. Nickel prices is also expected to continue last week recovery as it can test 780 taking support near 740 levels. A global nickel market deficit will nearly halve to 49,000 tonnes in 2019 from 93,000 tonnes this year on higher output of primary metals by global suppliers.

12

COMMODTY


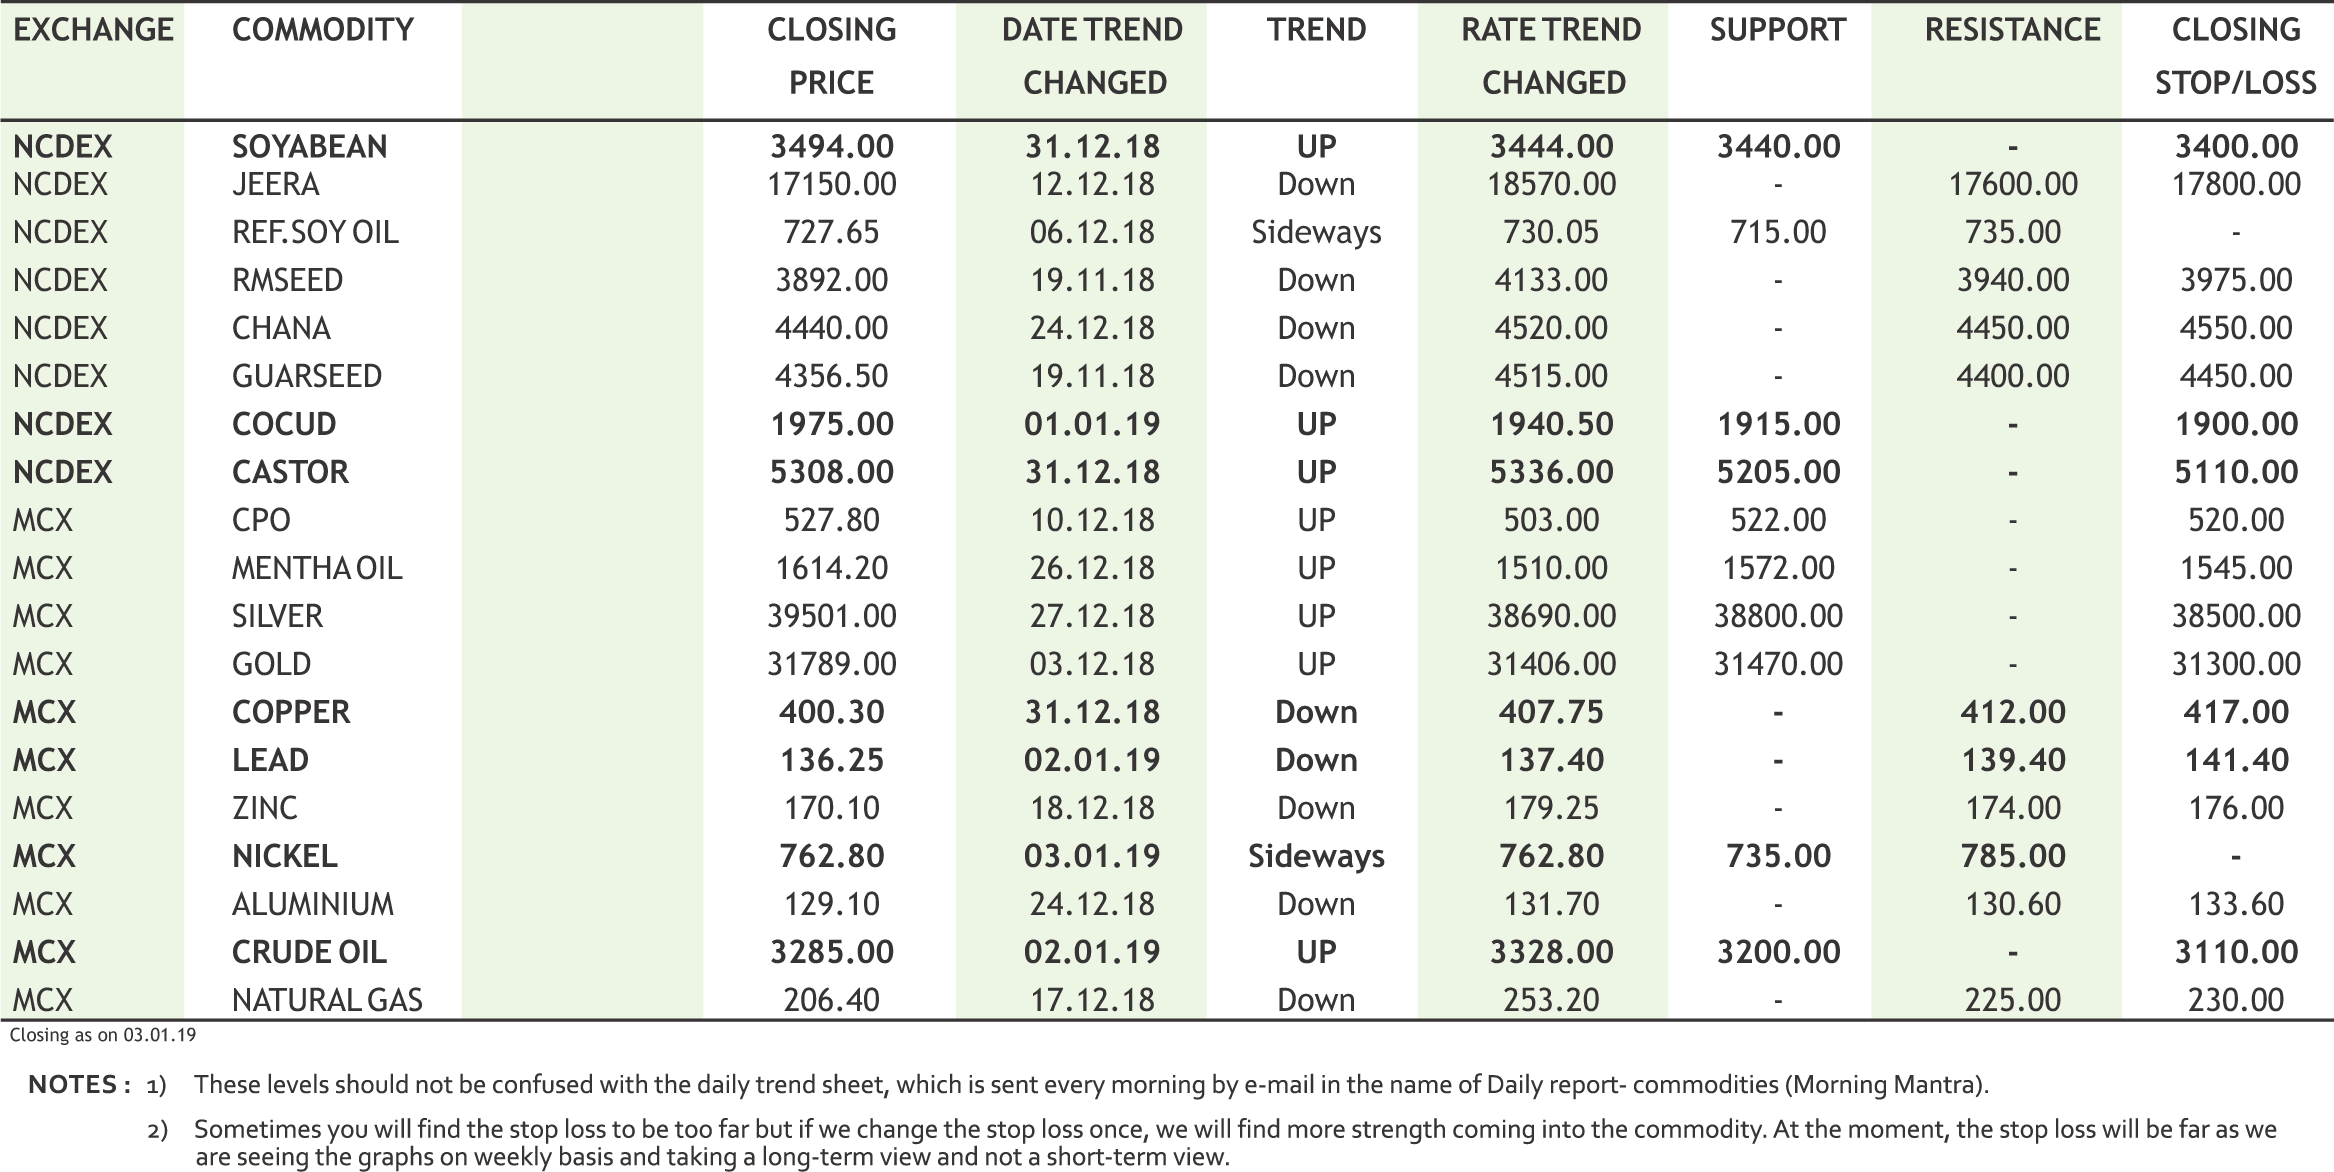
TREND SHEET


TECHNICAL RECOMMENDATIONS


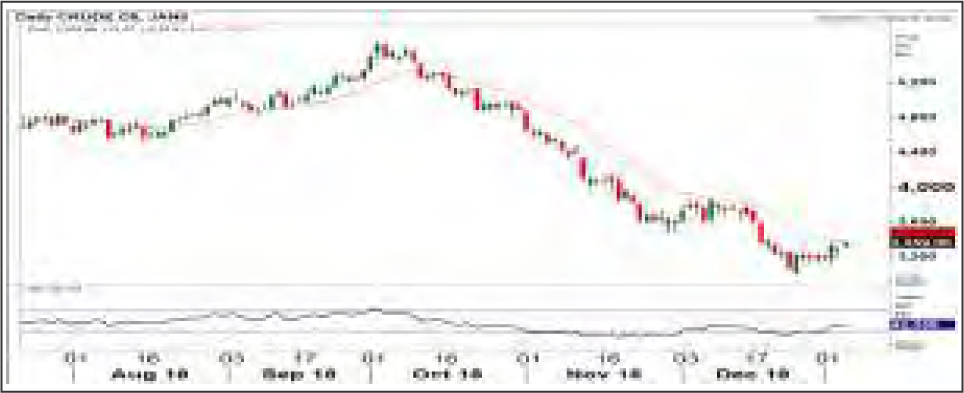
CRUDEOIL MCX (JAN)contract closed at Rs. 3285 on 3rd Jan’19. The contract made its high of Rs. 5533 on 3rd Oct’18 and a low of Rs. 2993 on 26th Dec’18. The 18-day Exponential Moving Average of the commodity is currently at Rs. 3376. On the daily chart, the commodity has Relative Strength Index (14-day) value of 42.98.

One can buy at Rs. 3270 for a target of Rs. 3440 with the stop loss of Rs. 3200.


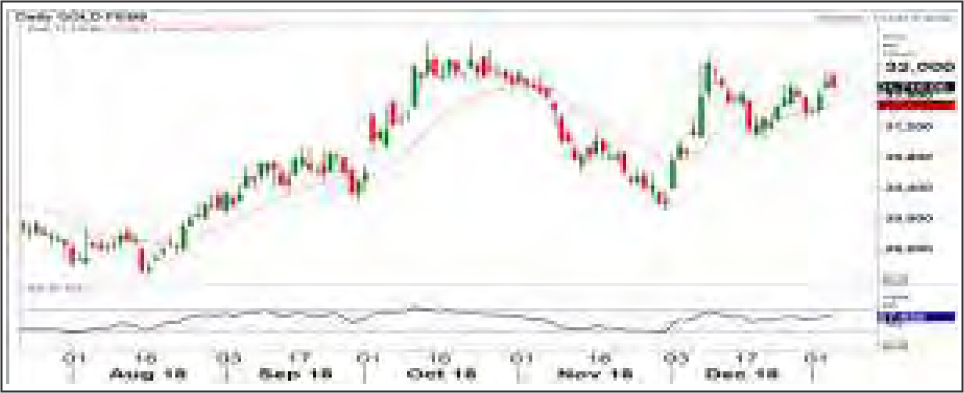
GOLD MCX (FEB) contract closed at Rs. 31789 on 3rd Jan’19. The contract made its high of Rs. 32530 on 15th Oct’18 and a low of Rs. 29838 on 16th Aug’18. The 18-day Exponential Moving Average of the commodity is currently at Rs. 31498. On the daily chart, the commodity has Relative Strength Index (14-day) value of 56.82.

One can buy at Rs. 31620 for a target of Rs. 32020 with the stop loss of Rs. 31420.

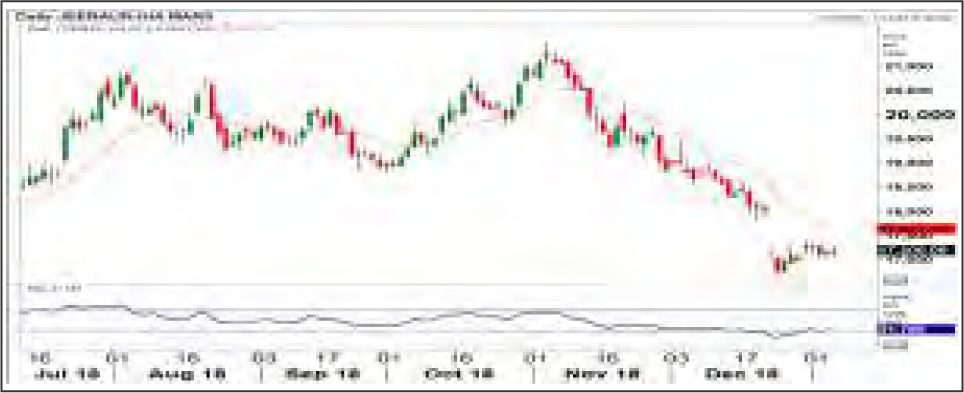
JEERA NCDEX (MAR) contract closed at Rs. 17150 on 3rd Jan’19. The contract made its high of Rs. 19400 on 1th Nov’18 and a low of Rs. 16750 on 24th Dec’18. The 18-day Exponential Moving Average of the commodity is currently at Rs. 17302.85. On the daily chart, the commodity has Relative Strength Index (14-day) value of 42.129.

One can buy at Rs. 17100 for a target of Rs. 17400 with the stop loss of Rs 16950.


13

COMMODTY


NEWS DIGEST


• SEBI has allowed custodial services in the commodity derivatives market which would enable participation of institutional investors, including mutual funds, in the segment.

• The Cabinet Committee on Economic Affairs, has given its approval for including merchant exporters under the Interest Equalisation Scheme (IES) for Pre and Post Shipment Rupee Export Credit by allowing them interest equalisation rate of 3% on such credit for export of products covered under 416 tariff lines identified under the scheme.

• Russia’s Baikal Mining Company, operator of a large Udokan copper deposit, has agreed $1.25 billion of project financing from banks.

• China Caixin/Markit Manufacturing Purchasing Managers' Index for December fell to 49.7 from 50.2 in November.

• Libya's Sharara oilfield will be losing up to 11,000 barrels per day (bpd) when production restarts because of damage to the facility.

• India slashed import tax to 40 % from 44 %, while a tax on the refined variety was cut to 50 % from 54 % sourced from Southeast Asian (ASEAN) countries.

• Mustard oil mills across the country crushed 550,000 tn of the oilseed in December, up 29.4% on year. On a month-onmonth basis, crushing increased 22.2% from 450,000 tn in November. - Mustard Oil Producers Association of India.

• India's soymeal exports are expected to have declined 24% on month to around 200,000 tn in December. - Soybean Processors Association of India

WEEKLY COMMENTARY


The first week of 2019 was a mix week where we saw correction in industrial metals, some gains in precious metals; and fresh buying in crude and some agri commodities. If we talk about INR, it depreciated marginally amid strong dollar against major global currencies overseas and heavy selling in domestic equities. Dollar index traded negative third week in a row on weak data which caused concerns over the global growth. The latest PMI reading of US was the lowest seen since February 2016. Factory activity weakened across much of Europe and Asia in December as the US - China trade war and a slowdown in demand hit the production in many economies. A series of purchasing managers' indexes for December released on Wednesday mostly showed declines or slowdowns in manufacturing activity across the globe. It weighed on the sentiments of industrial metals and most of them traded negative; except nickel which saw some lower level buying. . Crude oil prices rose, drawing support from signs that Saudi Arabia is cutting crude output but pressured by concerns that slowing global economic growth could dent demand. In the week ending on December 21, US crude oil production was 11.7 MMbpd (million barrels per day)—back to its record levels. Gold advanced above $1,300 an ounce to extend a New Year rally. Investors flocked to the metal with global equities in retreat, signs of a slowdown stacking up, and the oldest of havens showing its mettle as exchange-traded funds draw in increased flows. Silver saw a terrific rise alongwith the upside in gold and in MCX both gold and silver crossed the mark of 31800 and 39500 respectively .

In the agri commodities, oil seeds and edible oil saw some gains. Malaysian palm oil futures rose to their highest in nearly two weeks on the first trading day of 2019, after world's largest edible oil importer India announced import tax cuts, amid expectations of a fall in production. India, the world's largest importer of edible oils will lower the duty on crude palm oil imports to 40 percent from 44 percent, while a tax on refined oils was cut to 50 percent from 54 percent. Some upside in crude prices gave much needed support to guar counter. Castor prices increased on lower level buying. Turmeric, jeera and dhaniya saw limited upside. It was mentha which gave good buying opportunity to the buyers in last three week.

NCDEX TOP GAINERS & LOSERS (% Change)


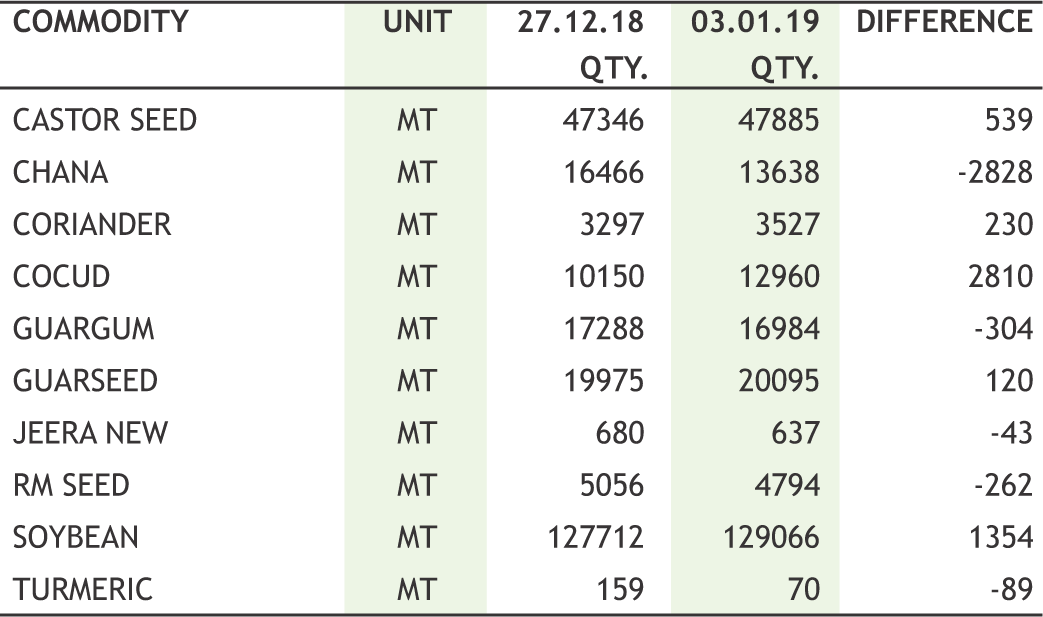
WEEKLY STOCK POSITIONS IN WAREHOUSE (NCDEX)


MCX TOP GAINERS & LOSERS (% Change)


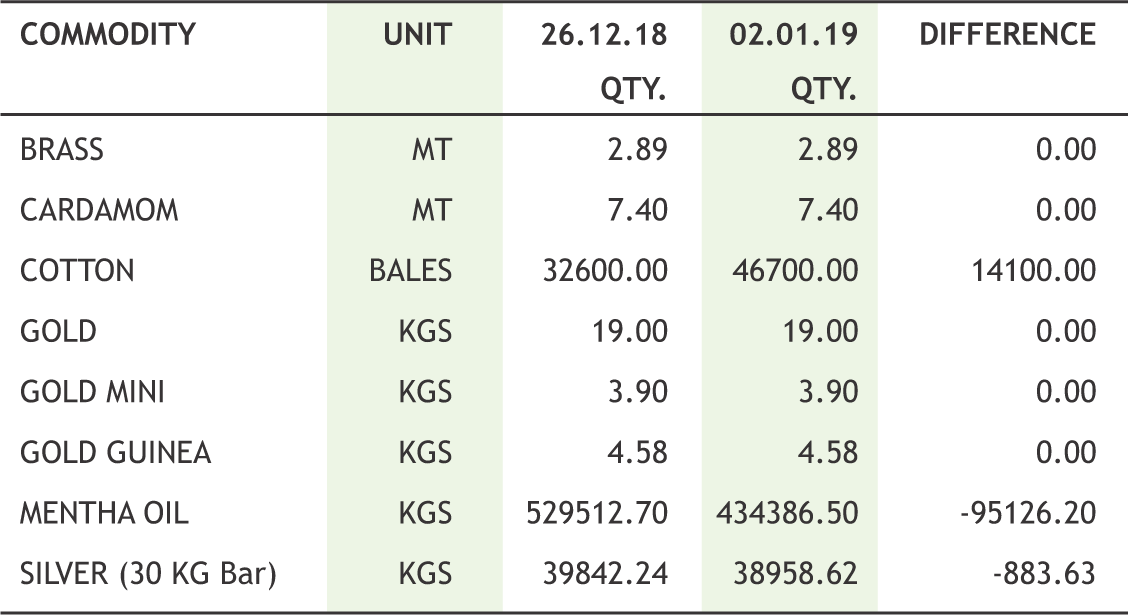
WEEKLY STOCK POSITIONS IN WAREHOUSE (MCX)


14

COMMODTY


SPOT PRICES (% change)


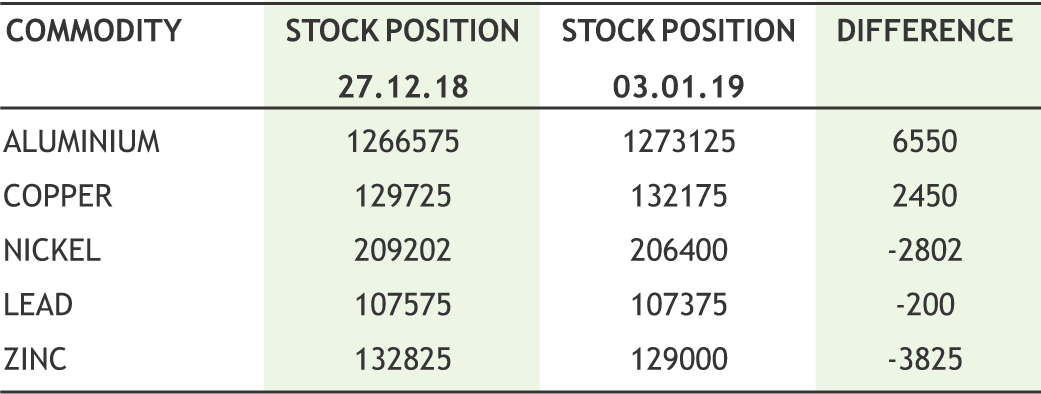
WEEKLY STOCK POSITIONS IN LME (IN TONNES)


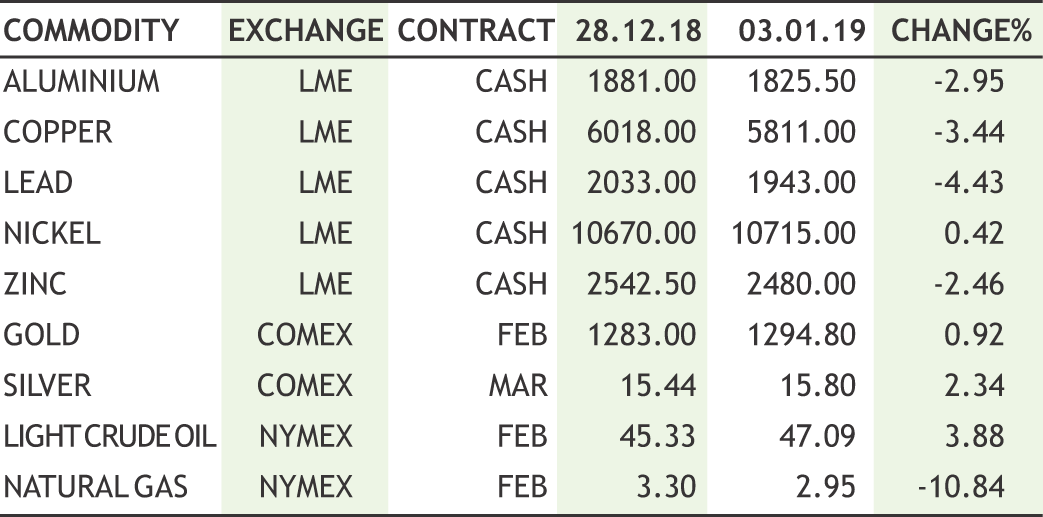
PRICES OF COMMODITIES IN LME/ COMEX/ NYMEX (in US $)


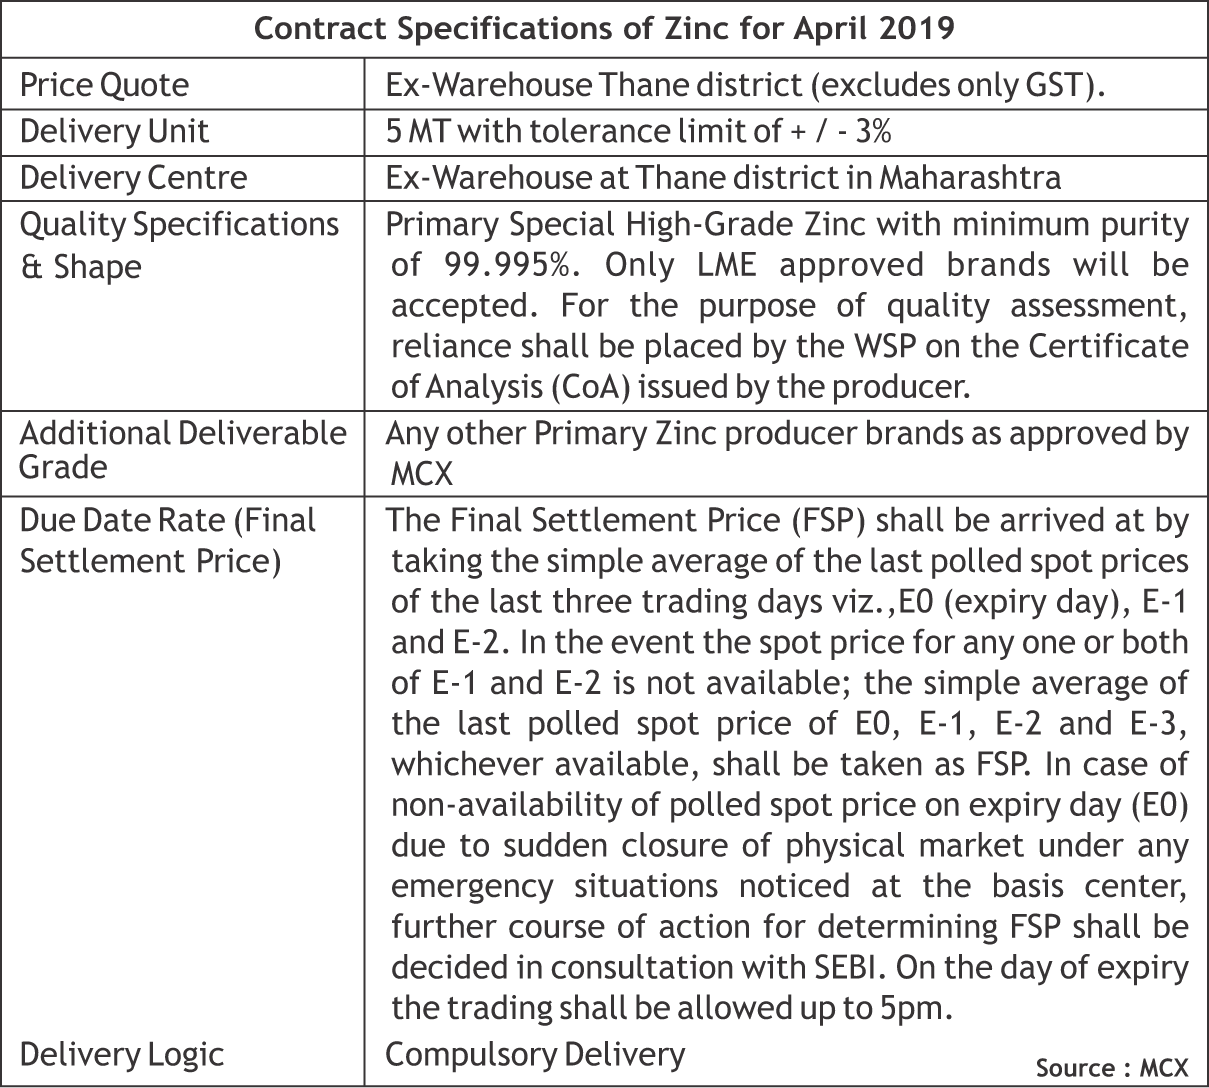
Modifications in Aluminium and Zinc Futures Contracts

MCX has revised contract specifications for Aluminium and Zinc Futures Contracts specified with regards to Price Quote, Delivery Unit, Delivery Centre, AdditionalDelivery Centre (s), Quality Specifications & Shape, Additional Deliverable Grade, DueDate Rate (Final Settlement Price) and Delivery Logic will be implemented w.e.f.January 03, 2019.

INTERNATIONAL COMMODITY PRICES


13

CURRENCY


Currency Table


News Flows of last week


31st DEC India's external debt declines to US$ 510.4 billion end September 2018.
31st DEC Italy squeezed its budget through parliament, averting a head-on collision with the EU.
1st JAN RBI favours liquidity limit on income, liquid funds.
2nd JAN Indian Manufacturing activity slowed in December, PMI at 53.2.
2nd JAN ECB calls in administrators to save Italy's Carige.
2nd JAN US Manufacturing PMI revised lower to 15-month low.
2nd JAN RBI plans to extend implementation of last tranche of 0.625% CCB by a year.
3rd JAN Irish PM says he has escalated no-deal Brexit preparations.
3rd JAN US ADP Payroll increased biggest in nearly 2 years.
3rd JAN US Factory activity growth slowed to 2-year low.

Market Stance


Rupee remained in a tight range for yet another week due to lack of participation by the international traders in forex markets and global cues. Indecision was seen among the traders at the end of this week. Bond yields started to rise last week, which will have positive impact on INR and lower commodity prices kept USDINR prices in check. But rise in Crude oil prices could spoil the party for INR bulls. The reduction in external debt to 510.4 billion dollars gave INR bulls another chance to cheer but lower than expected Manufacturing PMI made INR to depreciate strongly in just one session. The tiff between Indian government and RBI cooled off a bit after ruling government’s ministers reiterated they government will not require RBI funds to meet fiscal deficit. Meanwhile on the cross currency front, weak economic numbers from US, UK and Euro zone kept JPY, EUR & GBP on a roller-coaster ride against USD. The negative news flow on Italy’s Carige bank made bears to take hold of EUR while Brexit concerns had negative on GBP prices against USD. Next week, IIP numbers, FOMC meeting minutes and ECB’s account of monetary policy meeting will impact the domestic currency. Expect USDINR to stay above 69.50 and gradually move towards 70.50.

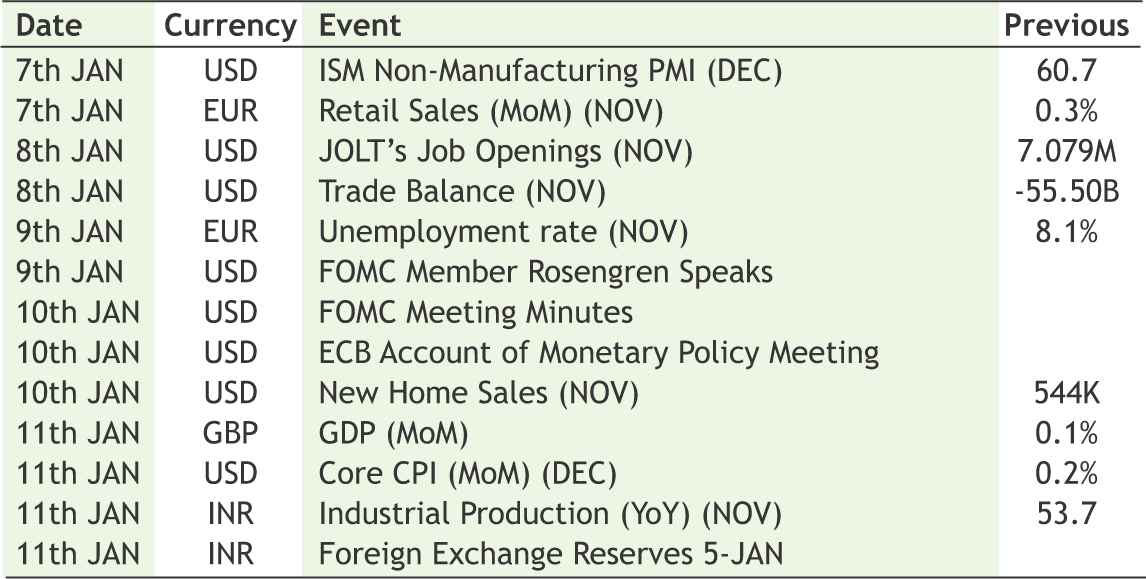
Economic gauge for the next week


Technical Recommendation

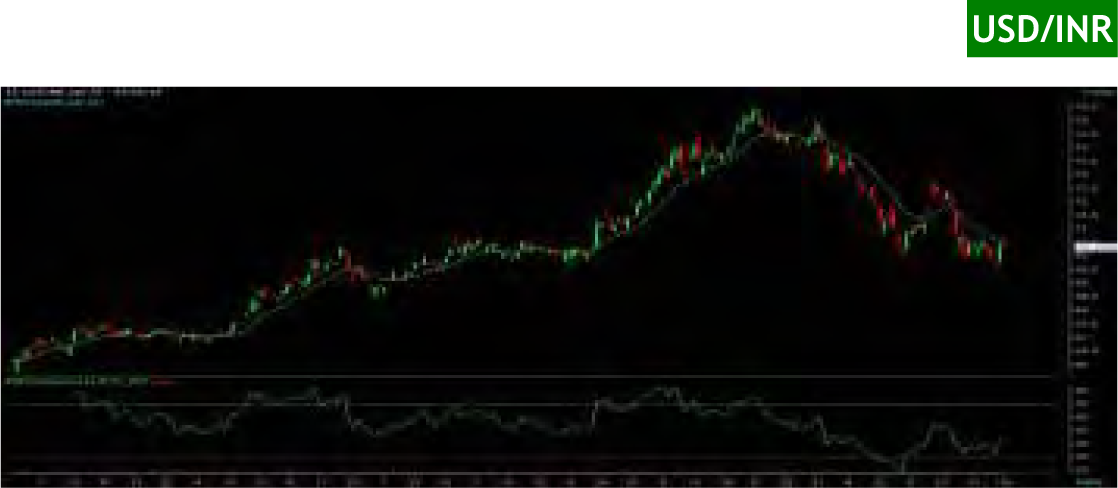
USD/INR (JAN) contract closed at 70.32 on 3rd Jan’ 19. The contract made its high of 70.6975 on 3rd Jan’19 and a low of 69.5775 on 1st Jan’ 18 (Weekly Basis). The 14-day Exponential Moving Average of the USD/INR is currently at 70.51

On the daily chart, the USD/INR has Relative Strength Index (14-day) value of 41.98. One can go long above 70.15 for the target of 70.75 with the stop loss of 69.85.


EUR/INR (JAN) contract closed at 80.0450 on 3rd Jan’ 19. The contract made its high of 80.74 on 2nd Jan’19 and a low of 79.97 on 2nd Jan’19 (Weekly Basis). The 14-day Exponential Moving Average of the EUR/INR is currently at 80.69

On the daily chart, EUR/INR has Relative Strength Index (14-day) value of 35.71. One can sell at 80.20 for a target of 79.60 with the stop loss of 80.50.

GBP/INR (JAN) contract closed at 88.4450 on 3rd Jan’ 19. The contract made its high of 89.59 on 2nd Jan’19 and a low of 88.3925 on 3rd Jan’18 (Weekly Basis). The 14-day Exponential Moving Average of the GBP/INR is currently at 89.54

On the daily chart, GBP/INR has Relative Strength Index (14-day) value of 24.87. One can buy above 89 for a target of 89.60 with the stop loss of 88.70.

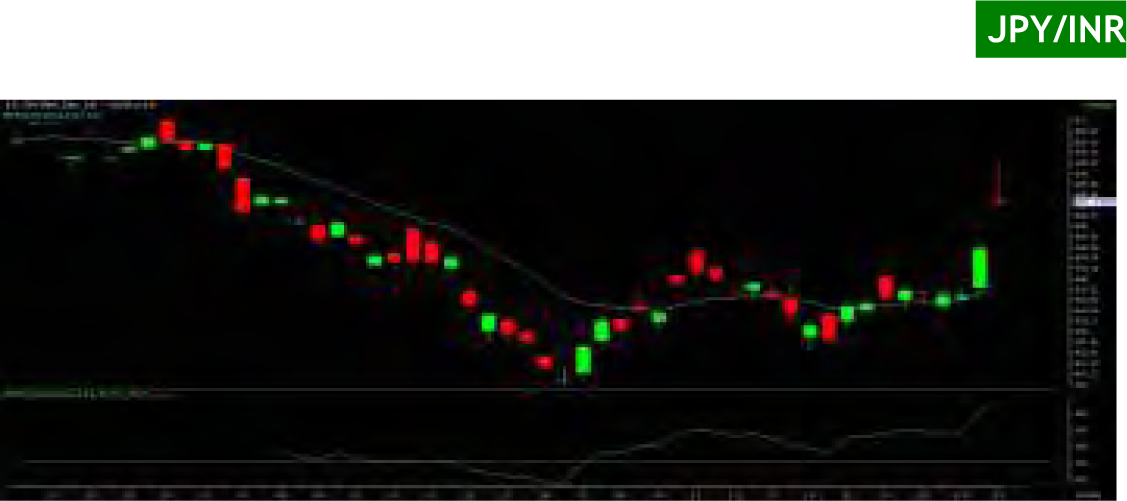
JPY/INR (JAN) contract closed at 65.45 on 3rd Jan’ 19. The contract made its high of 66.2850 on 3rd Jan’19 and a low of 63.40 on 31st Dec’18 (Weekly Basis). The 14- day Exponential Moving Average of the JPY/INR is currently at 63.94

On the daily chart, JPY/INR has Relative Strength Index (14-day) value of 69.08. One can sell at 65.30 for a target of 64.70 with the stop loss of 65.60.


14

FIXED DEPOSIT MONITOR


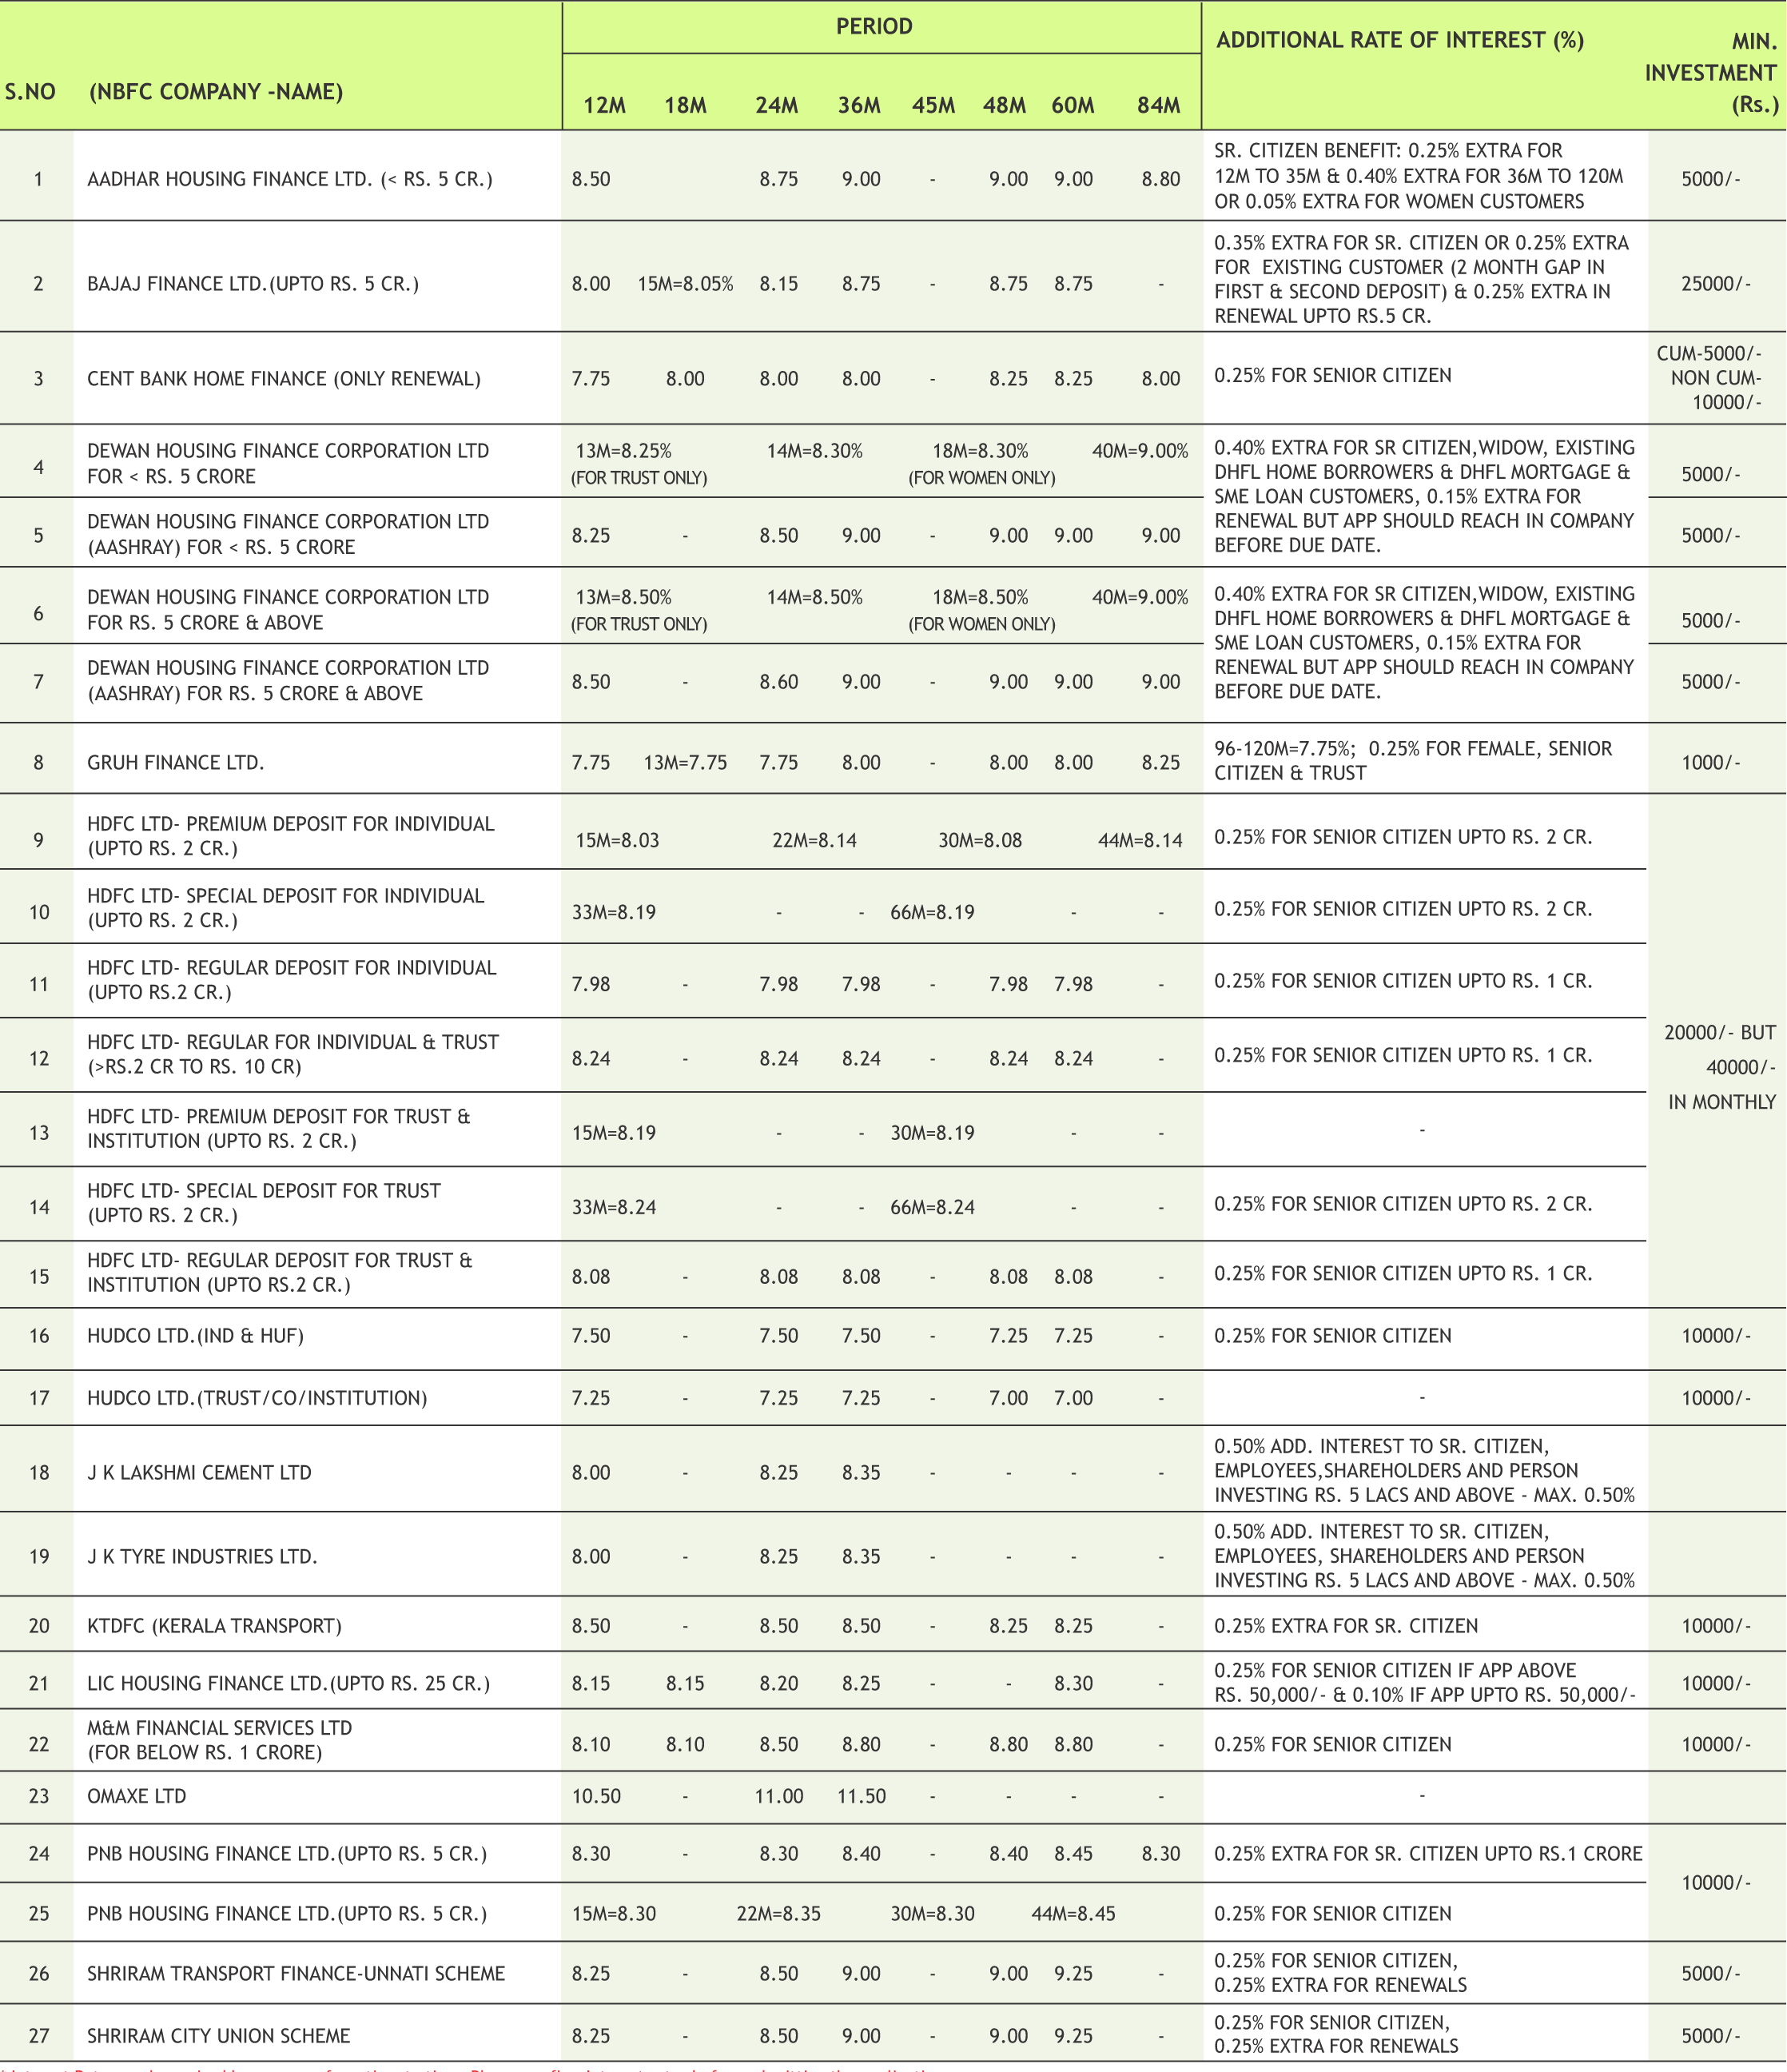
FIXED DEPOSIT COMPANIES


* Interest Rate may be revised by company from time to time. Please confirm Interest rates before submitting the application.

* For Application of Rs.50 Lac & above, Contact to Head Office.

* Email us at fd@smcindiaonline.com


16

MUTUAL FUND

Performance Charts


EQUITY (Diversified)
TAX Fund
BALANCED
INCOME FUND
SHORT
Due to their inherent short term nature, Short term funds have been sorted on the basis of 6month returns

Note:Indicative corpus are including Growth & Dividend option . The above mentioned data is on the basis of 08/08/2019 Beta, Sharpe and Standard Deviation are calculated on the basis of period: 1 year, frequency: Weekly Friday, RF: 7%


*Mutual Fund investments are subject to market risks, read all scheme related documents carefully

17

Mr. D K Aggarwal (CMD, SMC Investments & Senior VP – PHD Chamber of Commerce) during the Infrastructure Conclave-2018 held on Friday, 5th October, 2018 at PHD House, New Delhi.

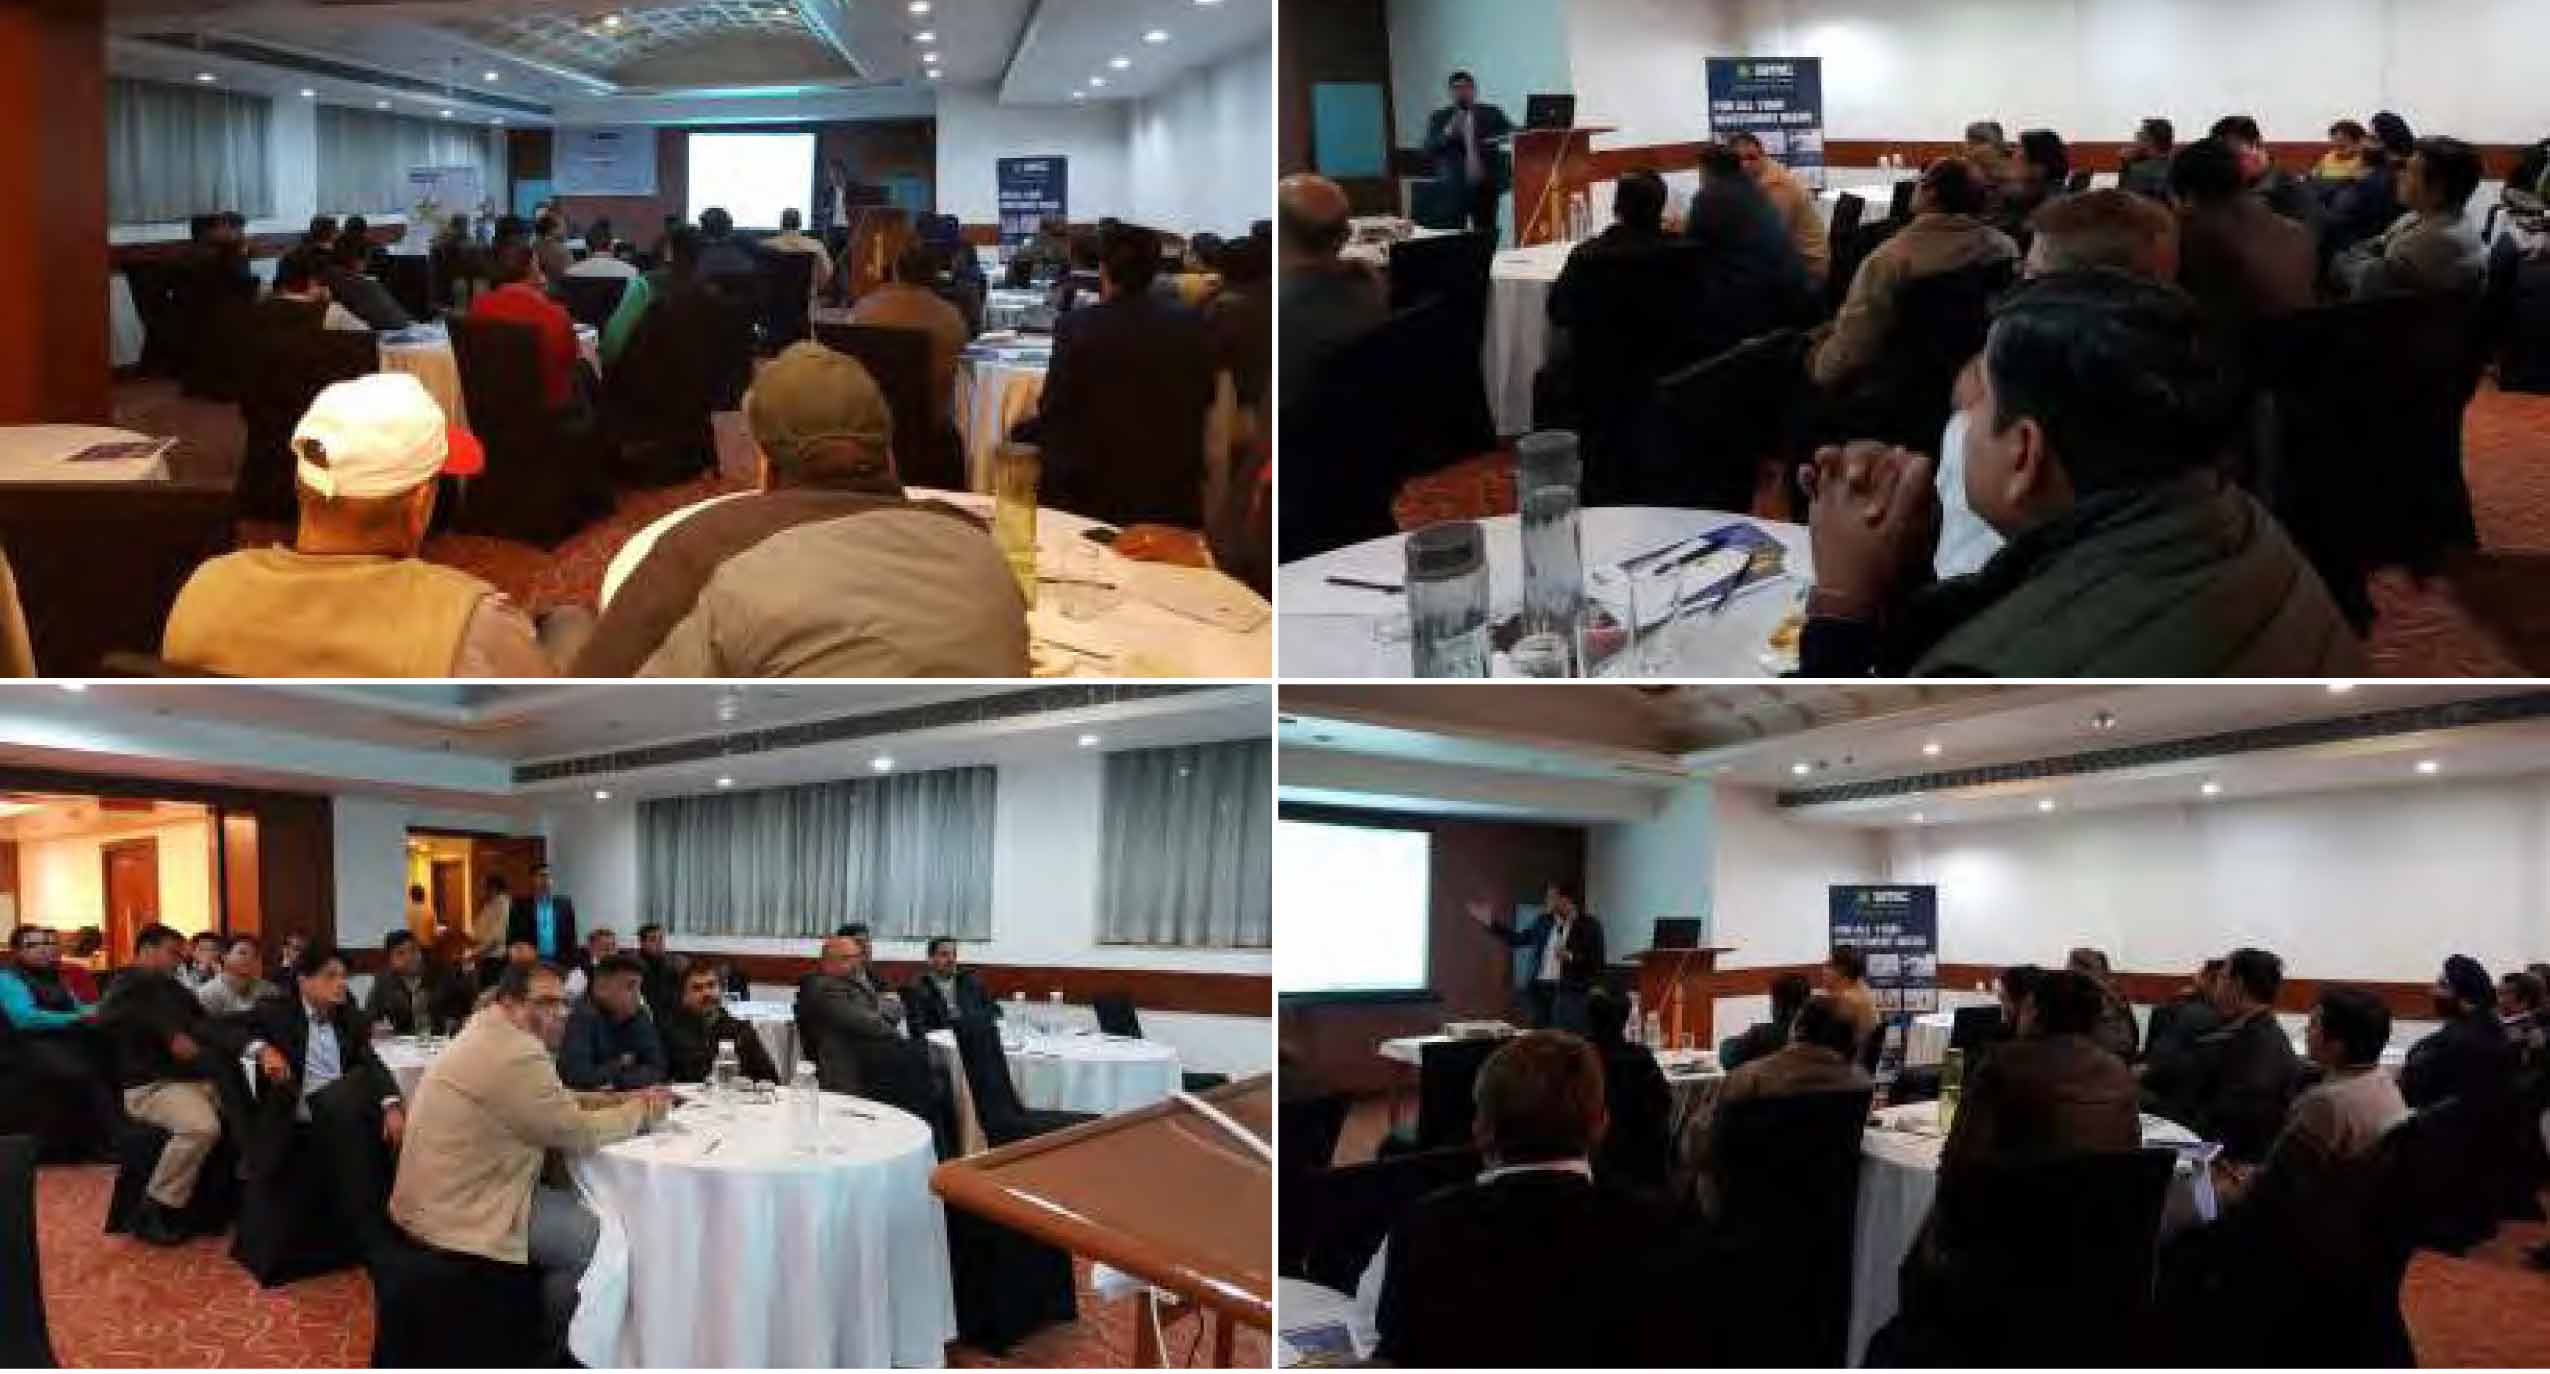
SMC organised Investor Awareness Program for the sub brokers in association with NSE and NSDL held on Friday, 28th December, 2018 at Hotel Jivitesh, Pusa Road, New Delhi.

Mr. Mahesh C Gupta (Vice CMD, SMC Group), Mr. Ajay Garg (Director & CEO, SMC Global Securities Ltd) and Mrs. Reema Garg (Director & CHRO, SMC Group) along with SMC employees during the December month birthday celebration held at SMC Head Office and Daryaganj Branch, New Delhi.

www.smcfinance.com

FOCUS ON YOUR BUSINESS,NOT FINANCE

Get easy business loans with SMC Finance

At SMC Finance, We make it easy for you to get a loan. Whether you are expanding your business, upgrading new equipments or for working capital. We are here to help you grow fast.

Professional and Transparent approach

Quick loan approval & disbursal

Hassle-free documentation process

Attractive Rate of Interest

Call Toll-Free 1800118818

E-mail nbfccare@smcfinance.com


Medical Equipment Finance | Personal Loan | Loan Against Property | Loan Against Shares/Mutual Funds/Bonds | MSME/SME Financing | Lease Rental Discounting | Promoter Financing | Debtors Financing | Structured Financing | Affordable Housing Application Financing | IPO/ NCD Financing | Business Loan

Moneywise Financial Services Pvt. Ltd. (A wholly owned subsidiary of SMC Global Securities Ltd.) Corporate Office: 11/6-B, 2nd Floor, Pusa Road, New Delhi 110005, Tel. +91-11-30111000, CIN No.: U51909WB1996PTC078352


SMC GROUP PRESENCE:

  • DELHI
  • |
  • MUMBAI
  • |
  • KOLKATA
  • |
  • AHEMDABAD
  • |
  • LUCKNOW
  • |
  • CHANDIGARH
  • |
  • DUBAI

SMC GLOBAL SECURITIES LTD.

REGISTERED OFFICES:

11 / 6B, Shanti Chamber, Pusa Road, New Delhi 110005. Tel: 91-11-30111000, Fax: 91-11-25754365

MUMBAI OFFICE:

Lotus Corporate Park, A Wing 401 / 402 , 4th Floor , Graham Firth Steel Compound, Off Western Express Highway, Jay Coach Signal, Goreagon (East) Mumbai - 400063

Tel: 91-22-67341600, Fax: 91-22-67341697

KOLKATA OFFICE:

18, Rabindra Sarani, Poddar Court, Gate No-4,5th Floor, Kolkata-700001 Tel.: 033 6612 7000/033 4058 7000, Fax: 033 6612 7004/033 4058 7004

AHMEDABAD OFFICE :

10/A, 4th Floor, Kalapurnam Building, Near Municipal Market, C G Road, Ahmedabad-380009, Gujarat

Tel : 91-79-26424801 - 05, 40049801 - 03

CHENNAI OFFICE:

Salzburg Square, Flat No.1, III rd Floor, Door No.107, Harrington Road, Chetpet, Chennai - 600031.

Tel: 044-39109100, Fax -044- 39109111

SECUNDERABAD OFFICE:

315, 4th Floor Above CMR Exclusive, BhuvanaTower, S D Road, Secunderabad, Telangana-500003

Tel : 040-30031007/8/9

DUBAI OFFICE:

2404, 1 Lake Plaza Tower, Cluster T, Jumeriah Lake Towers, PO Box 117210, Dubai, UAE

Tel: 97145139780 Fax : 97145139781

Email ID : pankaj@smccomex.com

smcdmcc@gmail.com

Printed and Published on behalf of

Mr. Saurabh Jain @ Publication Address

11/6B, Shanti Chamber, Pusa Road, New Delhi-110005

Website: www.smcindiaonline.com

Investor Grievance : igc@smcindiaonline.com

Printed at: S&S MARKETING

102, Mahavirji Complex LSC-3, Rishabh Vihar, New Delhi - 110092 (India) Ph.: +91-11- 43035012, 43035014, Email: ss@sandsmarketing.in