2019: Issue 673, Week: 04th – 08th March
A Weekly Update from SMC (For private circulation only)
WISE M NEY
NEY


2019: Issue 673, Week: 04th – 08th March
A Weekly Update from SMC (For private circulation only)
NEY


| Equity | 4-7 |
| Derivatives | 8-9 |
| Commodity | 10-13 |
| Currency | 14 |
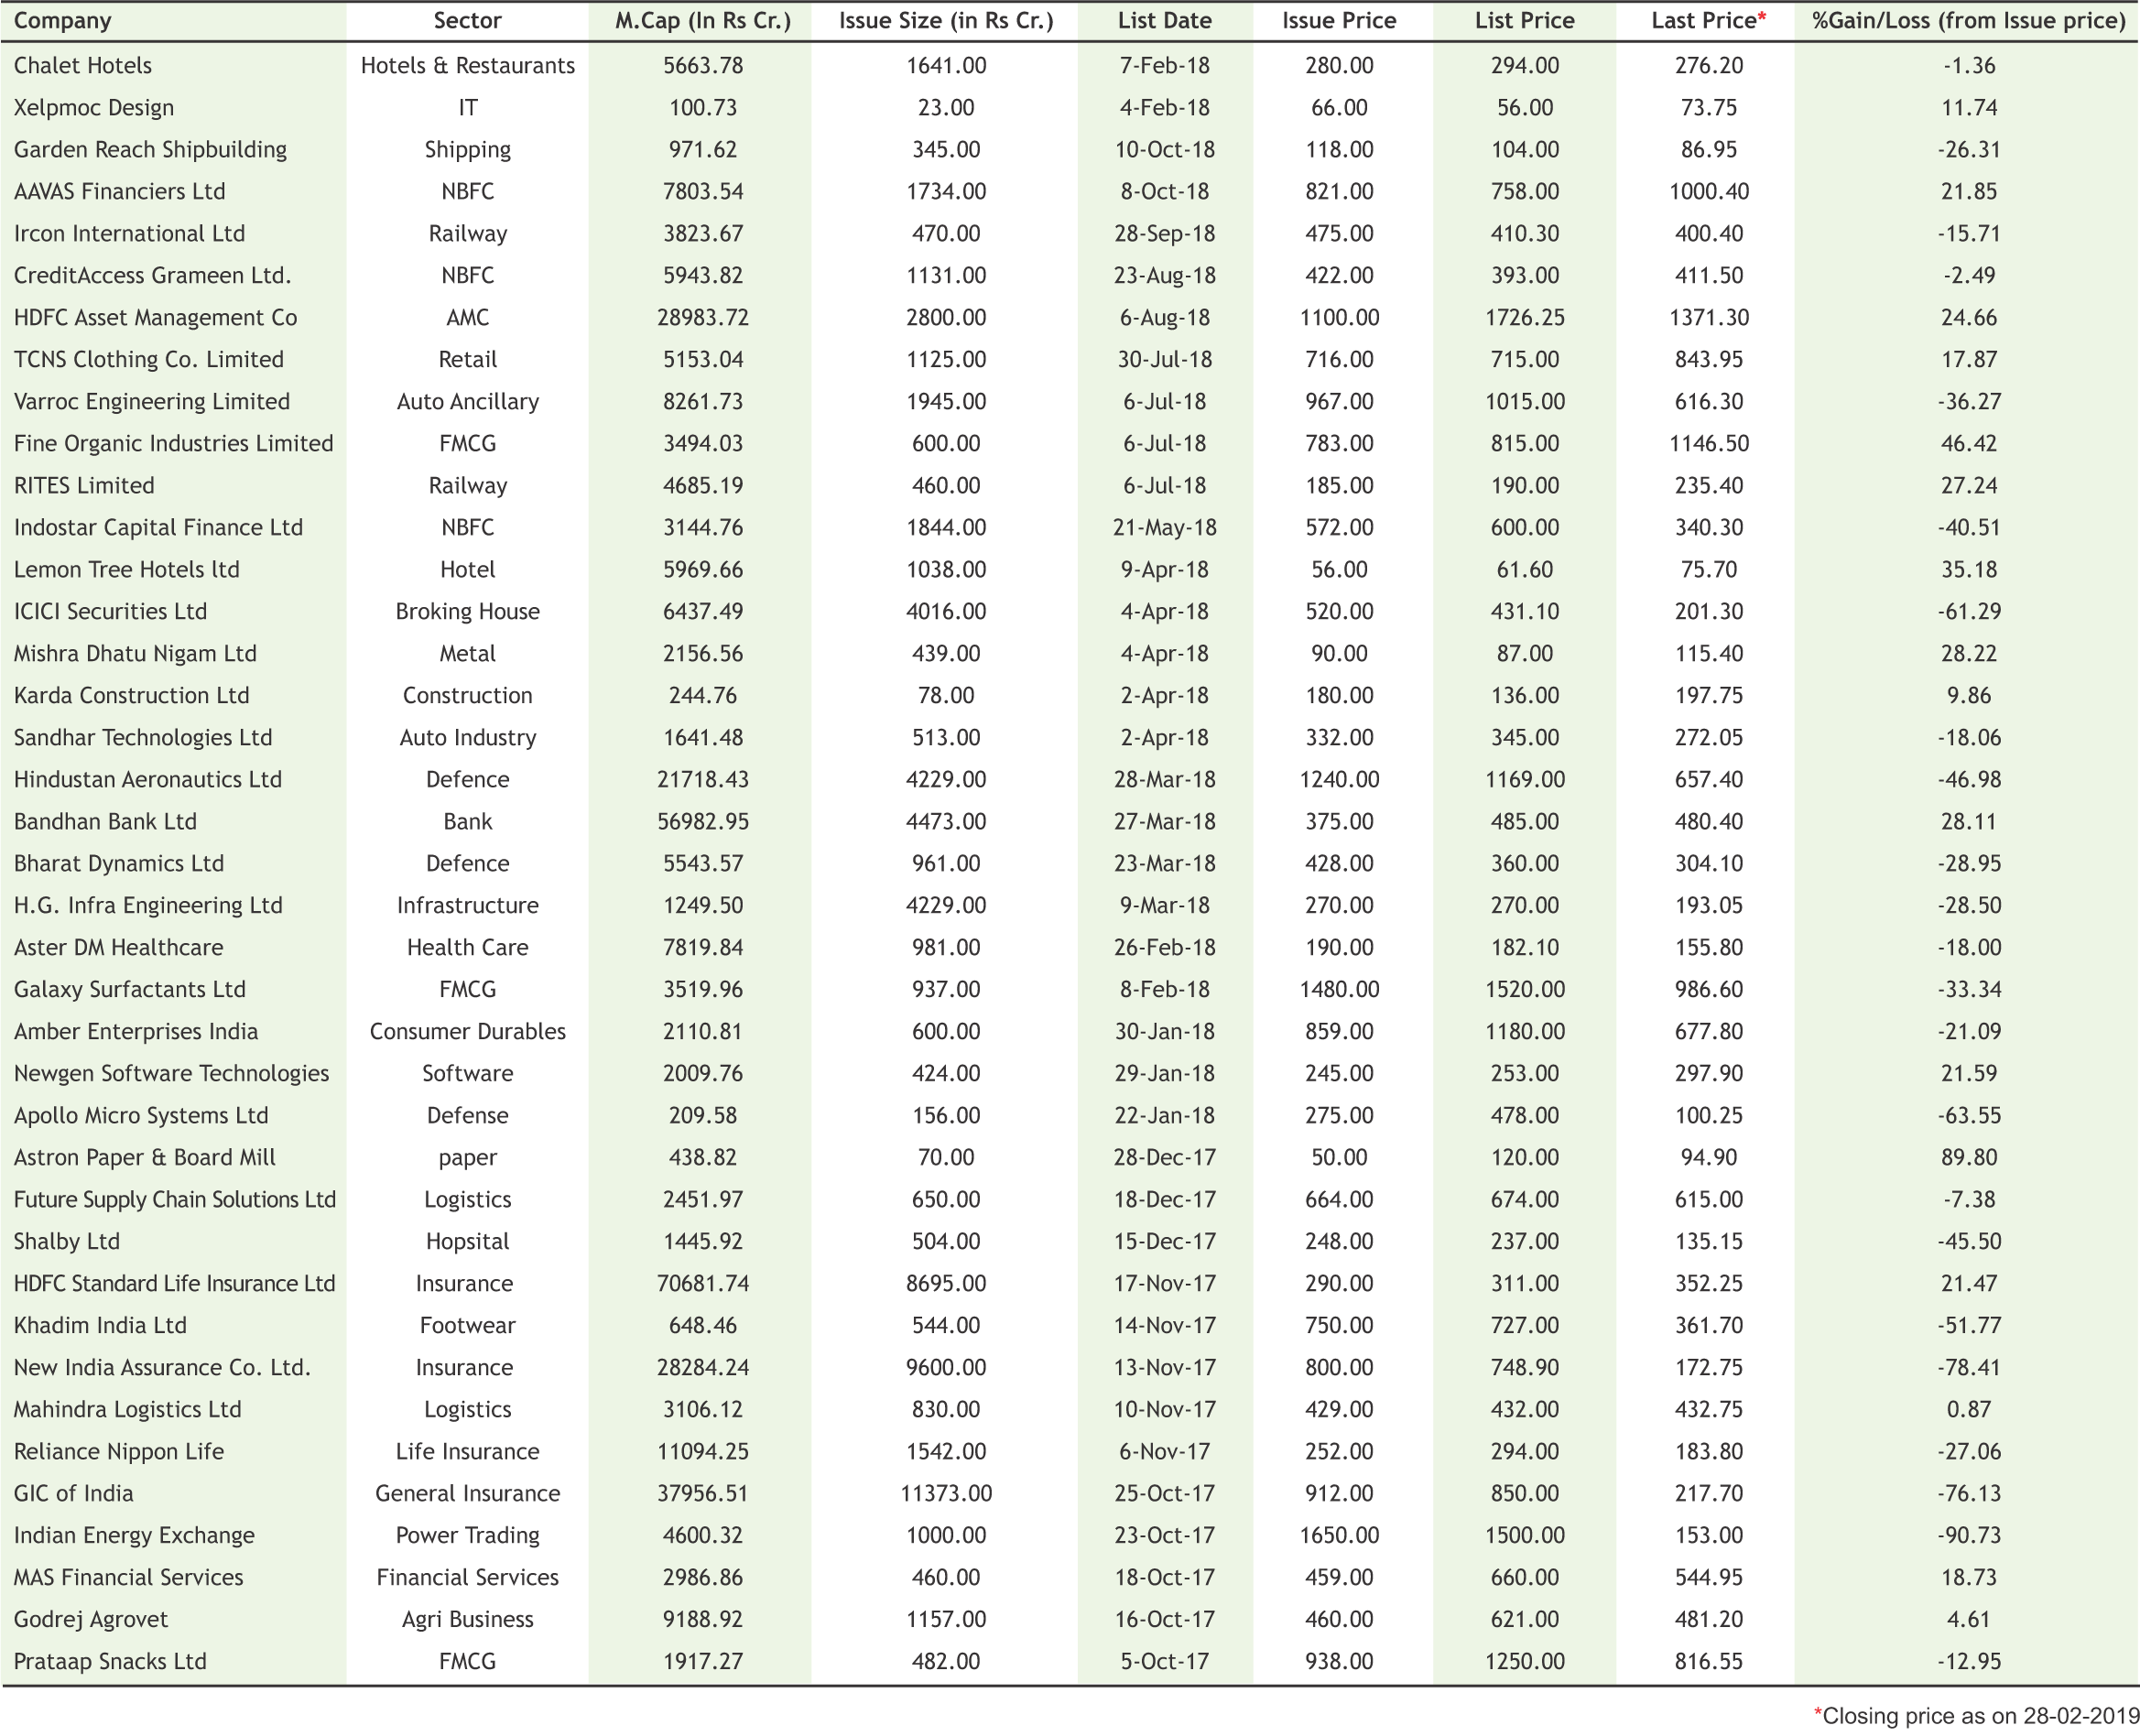
| IPO | 15 |
| FD Monitor | 16 |
| Mutual Fund | 17-18 |
I
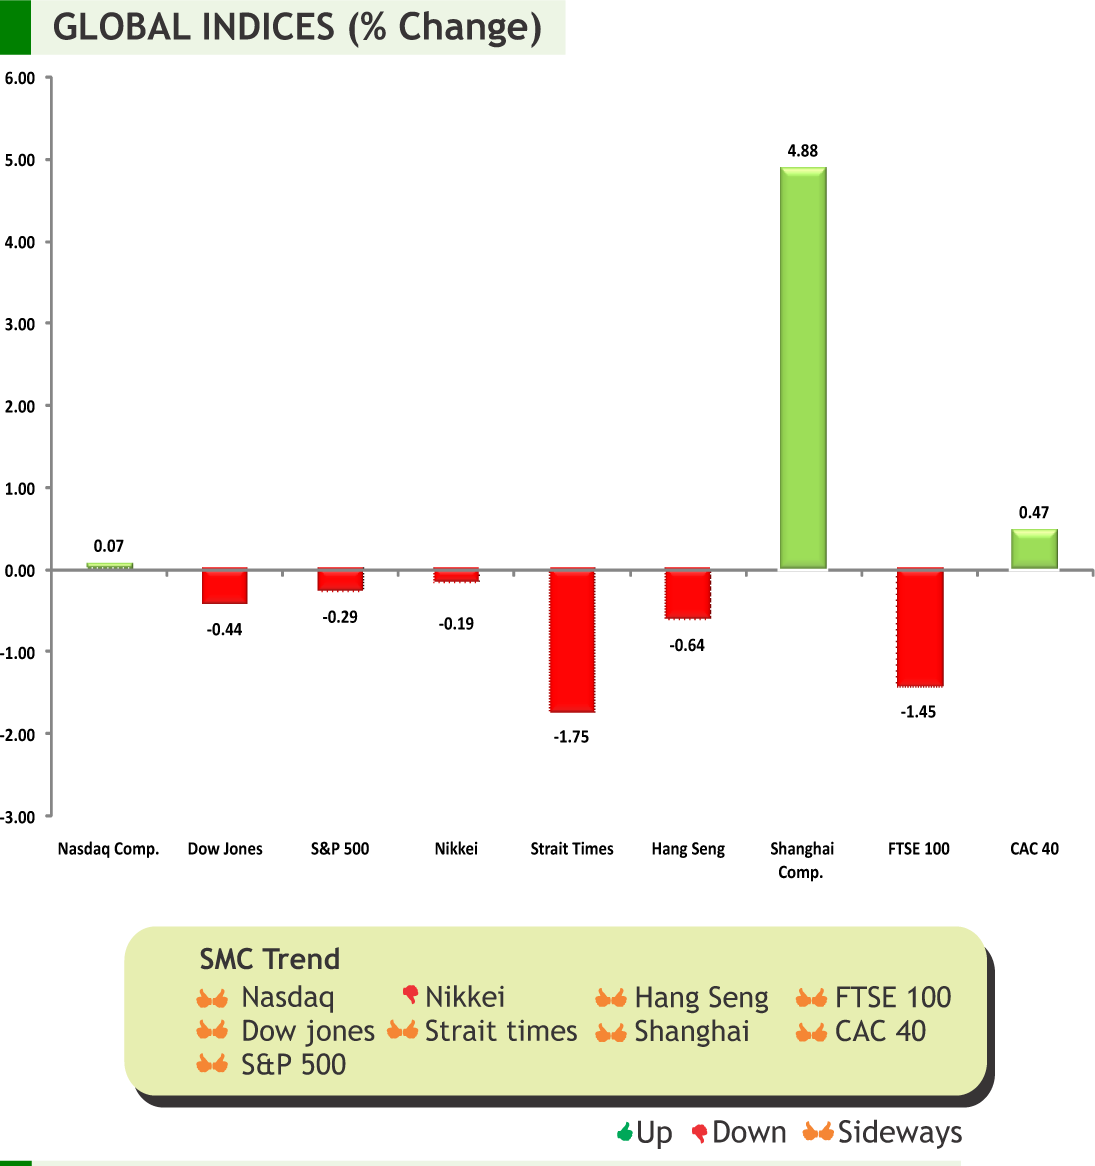
n the week gone by geopolitical news ruled the stock market across the globe keeping I an eye on the Trump-Kim summit and U.S.-China trade relations. Meanwhile, U.S. economy expansion for the quarter ending December 2018 came at 2.6 percent annualized rate as business environment picked up suggesting that the growth would stay stronger going forward. Federal reserve Chairman once again reiterated that the bank would remain patient in view of soft inflation and conflicting economic signals. Economic confidence in the Euro-area dropped for eighth consecutive month suggesting slide in sentiments. China’s manufacturing purchasing managers index fell below the 50 mark that signifies contraction showing further weakness on account of trade war and global slowdown.
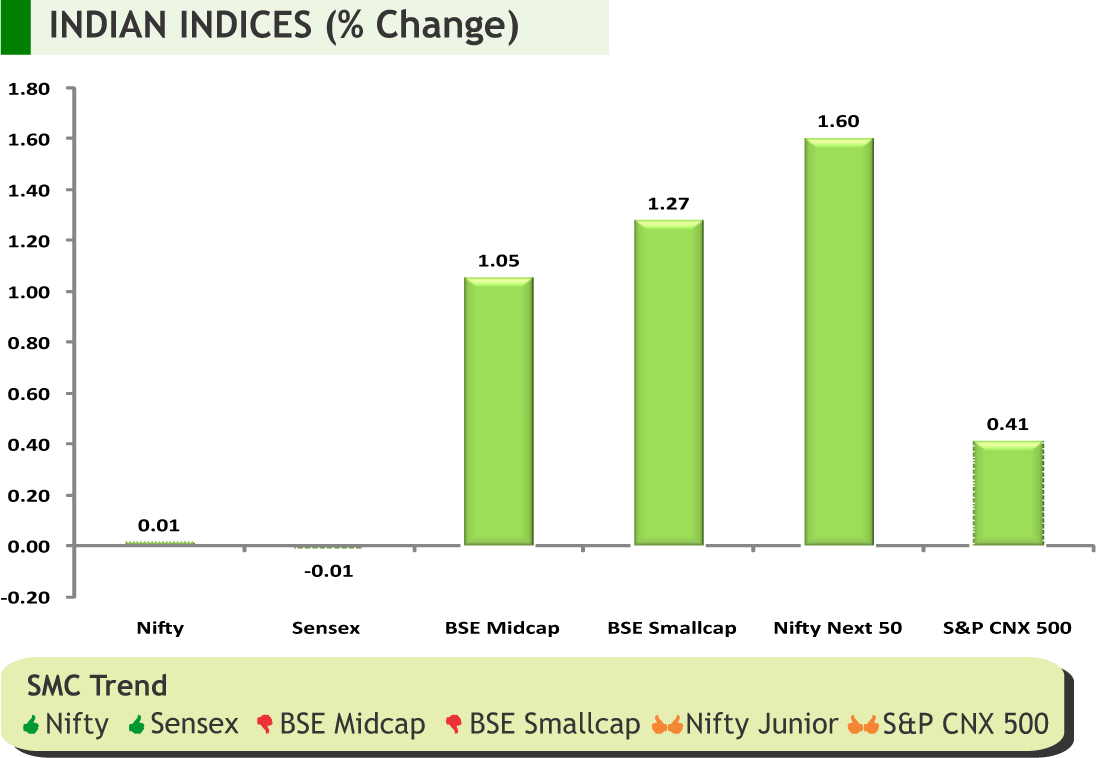
Back at home, markets witnessed extra bout of volatility on account of spike in tensions between India and Pakistan. Additionally, volatility was on the rise ahead of the monthly derivative expiry on Thursday. India economic expansion dropped to six quarters low to 6.6 percent in the third quarter ending December 2018 from 7 percent recorded in prior quarter. Recently, Moody has said that Indian economy is expected to grow at 7.3 per cent in calendar year 2019 and 2020. On banking sector, Moody's said, although the overall strength of the system is improving, it remains a constraint on the economy. Moreover, it has said that RBI is likely to be able to maintain their current monetary policy stance after some tightening last year. On the data front, growth of the eight core industries that account for about 41 percent of the total factory output eased to 1.8 percent in January due to fall in output of crude oil, refinery products and electricity. Foreign institutional investors were seen on the buy side and kept on supporting markets. Going forward, market will continue to track the global markets along with the military operation in the India Pakistan border. Besides, the rupee movement along with crude oil prices movement will be equally tracked.
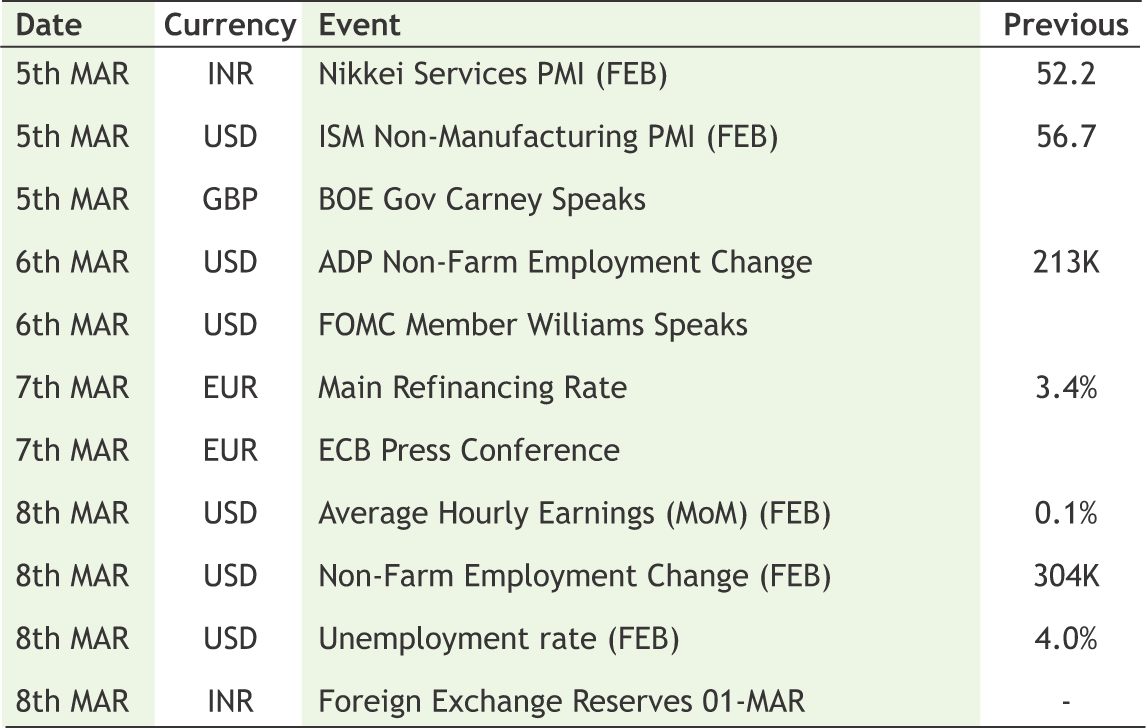
On the commodity market front, it was an average week for commodities in which mix trends were witnessed. CRB closed down after a two week continuous gain. Dollar index moved down though better than expected GDP data of US offered it timely strength and it saw marginal recovery in the weekly loss. INR traded with wild swings on ongoing tension between India and Pakistan; even equity market reacted in the same manner. Overall it appreciated further, which locked the volatility in commodities to some extent. Despite geopolitical tensions and frustrations over the global economy and political headlines; bullion counter nosedived on some better economic data’s. Durable Goods Orders, Advance Goods Trade Balance, ISM Non-Manufacturing/Services Composite¸ Change in Non-farm Payrolls and Unemployment Rate of US, GDP of Australia, Bank of Canada Rate Decision¸ ECB Rate Decision, CPI of China, Unemployment Rate of Canada, etc are few data that are scheduled this week.

SMC Global Securities Ltd. (hereinafter referred to as “SMC”) is a registered Member of National Stock Exchange of India Limited, Bombay Stock Exchange Limited and its associate is member of MCX stock Exchange Limited. It is also registered as a Depository Participant with CDSL and NSDL. Its associates merchant banker and Portfolio Manager are registered with SEBI and NBFC registered with RBI. It also has registration with AMFI as a Mutual Fund Distributor.
SMC is a SEBI registered Research Analyst having registration number INH100001849. SMC or its associates has not been debarred/ suspended by SEBI or any other regulatory authority for accessing /dealing in securities market.
SMC or its associates including its relatives/analyst do not hold any financial interest/beneficial ownership of more than 1% in the company covered by Analyst. SMC or its associates and relatives does not have any material conflict of interest. SMC or its associates/analyst has not received any compensation from the company covered by Analyst during the past twelve months. The subject company has not been a client of SMC during the past twelve months. SMC or its associates has not received any compensation or other benefits from the company covered by analyst or third party in connection with the research report. The Analyst has not served as an officer, director or employee of company covered by Analyst and SMC has not been engaged in market making activity of the company covered by Analyst.
The views expressed are based solely on information available publicly available/internal data/ other reliable sources believed to be true.
SMC does not represent/ provide any warranty express or implied to the accuracy, contents or views expressed herein and investors are advised to independently evaluate the market conditions/risks involved before making any investment decision.
DOMESTIC NEWS
Economy
• India's economic growth slowed in the three months to December. Gross domestic product grew 6.6 percent year-on-year in the October to December quarter, after expanding 7 percent in the previous three months. Economists had forecast growth of around 6.9 percent.
7• Eight core sectors growth dropped to 1.8 per cent in January, the lowest in the last 19 months primarily on lower production of electricity, crude oil and refinery products, data from the Commerce Ministry showed. The index of the eight sectors comprising coal, crude oil, natural gas, refinery products, fertilizers, steel, cement and electricity grew by 6.2 per cent in January 2018.
Technology
• Tech Mahindra has announced a collaboration with California based blockchain startup TBCASoft to promote a distributed-ledger platform for telecom firms. TBCASoft leads the Carrier Blockchain Study Group (CBSG), a global consortium of telecom firms responsible for the blockchain platform. The collaboration aims to use the platform in areas like supply chain, contract management and mobile transactions.
• Tata Consultancy Services announced the release of Ignio Cheetah, an upgrade of its cognitive automation product suite for IT operations and workload management. Ignio Cheetah augments blueprinting and automation functionality with several new capabilities, including Intelligent events and alerts management, capable of real-time detection and prediction of anomalous IT conditions that need attention.
Oil Refineries
• BPCL Kochi Refinery has commenced a major expansion project to set up a petrochemical complex for producing polyols. The complex being commissioned with an investment of Rs 11,300 crore is expected to go on stream by 2022-end. The polyol complex is the second expansion project of the refinery after the Rs 5,500-crore one to produce acrylic acid, acrylates and oxo-alcohol.
Infrastructure
• Adani Enterprises bagged the rights to operate manage and develop airports at Ahmedabad, Jaipur, Lucknow, Thiruvananthapuram and Mangalore by offering the highest per-passenger fee (PPF). PPF is paid by the developer to state-owned AAI for every domestic and international passenger handled at the airport.
Automobiles
• Tata Motors has launched the 2019 edition of its SUV Hexa with price ranging between Rs 12.99 lakh and Rs 18.36 lakh (ex-showroom Delhi).The updated model now comes with various additional features like a seven-inch touch screen infotainment system with android auto connectivity across variants.
INTERNATIONAL NEWS
• U.S. real gross domestic product climbed by 2.6 percent in the fourth quarter compared to the 3.4 percent jump in the third quarter. Economists had expected GDP to increase by 2.3 percent.
• U.S. Jobless claims rose in the week ended February 23rd, climbed to 225,000, an increase of 8000 from the previous week's revised level of 217,000. Economists had expected jobless claims to edge up to 220,000.
• U.S. factory orders inched up by 0.1 percent in December after falling by a revised 0.5 percent in November. Economists had expected orders to climb by 0.5 percent compared to the 0.6 percent decrease originally reported for the previous month.
• Japan manufacturing PMI fell into contraction in February, the latest survey from Nikkei revealed with a 32-month low manufacturing PMI score of 48.9. That's down from 50.3 in January, and it slips beneath the boom-or-bust line of 50 that separates expansion from contraction.
• China manufacturing PMI continued to contract in February with a manufacturing PMI score of 49.2, the latest survey from the National Bureau of Statistics revealed. That missed expectations for a score of 49.5, which would have been unchanged from the previous month.
| Stocks | *Closing Price | Trend | Date Trend Changed | Rate Trend Changed | SUPPORT | RESISTANCE | Closing S/l |
|---|---|---|---|---|---|---|---|
| S&P BSE SENSEX | 36064 | UP | 15.02.19 | 34970 | 35400 | 34700 | |
| NIFTY50 | 10864 | UP | 15.02.19 | 10316 | 10600 | 10400 | |
| NIFTY IT* | 15848 | UP | 21.07.17 | 10712 | 15200 | 14800 | |
| NIFTY BANK | 27044 | UP | 30.11.18 | 26863 | 25900 | 25400 | |
| ACC | 1482 | UP | 01.03.19 | 1482 | 1420 | 1400 | |
| BHARTIAIRTEL | 308 | DOWN | 25.01.18 | 453 | 330 | 340 | |
| BPCL | 346 | DOWN | 15.02.19 | 328 | 350 | 350 | |
| CIPLA | 552 | UP | 01.03.19 | 552 | 530 | 530 | |
| SBIN | 273 | UP | 02.11.18 | 286 | 270 | 260 | |
| HINDALCO | 196 | DOWN | 04.01.19 | 211 | 205 | 210 | |
| ICICI BANK | 354 | UP | 02.11.18 | 355 | 350 | 340 | INFOSYS | 742 | UP | 14.12.18 | 706 | 690 | 670 |
| ITC | 278 | DOWN | 22.01.19 | 274 | 283 | 290 | |
| L&T* | 1309 | DOWN | 18.01.19 | 1318 | - | 1318 | |
| MARUTI | 6935 | DOWN | 14.09.18 | 8627 | 7300 | 7500 | |
| NTPC | 143 | DOWN | 26.10.18 | 159 | 143 | 147 | |
| ONGC** | 149 | DOWN | 05.10.18 | 147 | - | 150 | |
| RELIANCE | 1226 | UP | 30.11.18 | 1168 | 1200 | 1170 | |
| TATASTEEL*** | 508 | DOWN | 26.10.18 | 552 | - | 510 | |
*LT has breached the resistance of 1300 **ONGC has breached the resistance of 145 ***TATASTEEL has breached the resistance of 490
Closing as on 01-03-2019
NOTES:
1) These levels should not be confused with the daily trend sheet, which is sent every morning by e-mail in the name of "Morning Mantra ".
2) Sometimes you will find the stop loss to be too far but if we change the stop loss once, we will find more strength coming into the stock. At the moment, the stop loss will be far as we are seeing the graphs on weekly basis and taking a long-term view and not a short-term view.
| Meeting Date | Company | Purpose |
|---|---|---|
| 5-Mar-19 | Quick Heal Technologies | Buyback |
| 6-Mar-19 | Asian Granito India | Fund Raising |
| 6-Mar-19 | Vedanta | Dividend |
| 6-Mar-19 | Mazda | Buyback |
| 6-Mar-19 | H U D C O | Fund Raising & Dividend |
| 7-Mar-19 | Kewal Kiran Clothing | Dividend |
| 7-Mar-19 | Power Grid Corp of India | Dividend |
| 11-Mar-19 | RITES | Dividend |
| 13-Mar-19 | India Nippon Electricals | Dividend |
| 14-Mar-19 | Tide Water Oil Company (India) | Dividend/Other business matters |
| Ex-Date | Company | Purpose |
|---|---|---|
| 5-Mar-19 | Tech Mahindra | Buy Back |
| 5-Mar-19 | ACC | Dividend - Rs 14 Per Share |
| 6-Mar-19 | HDFC AMC | Interim Dividend - Rs 12 Per Share |
| Interim Dividend - Rs 12 Per Share | Wipro | Bonus 1:3 |
| 7-Mar-19 | Standard Chartered PLC | Dividend |
| 11-Mar-19 | National Aluminium Company | Interim Dividend |
| 11-Mar-19 | REC | Interim Dividend |
| 14-Mar-19 | Power Grid Corp of India | Interim Dividend |
| 22-Mar-19 | Tide Water Oil Company (India) | Interim Dividend |
| 22-Mar-19 | India Nippon Electricals | Interim Dividend |
| 28-Mar-19 | CRISIL | Dividend Rs - 11 Per Share |
4


5
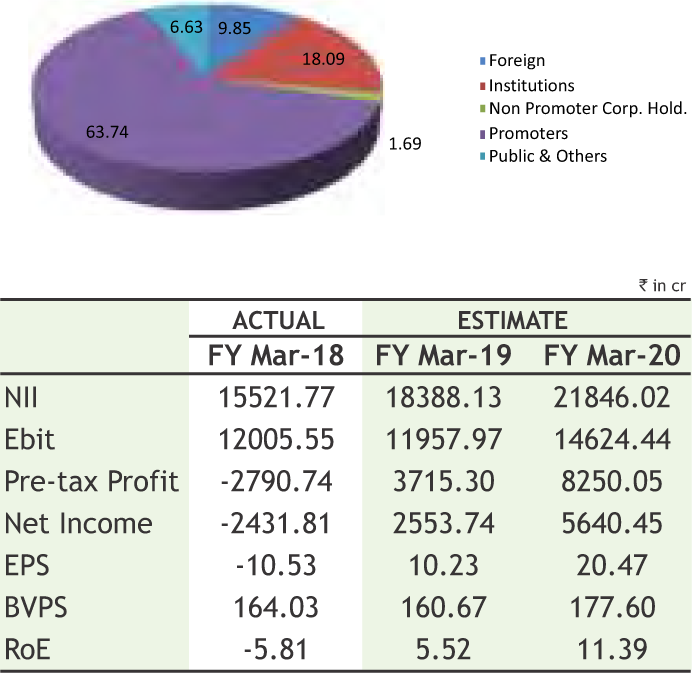
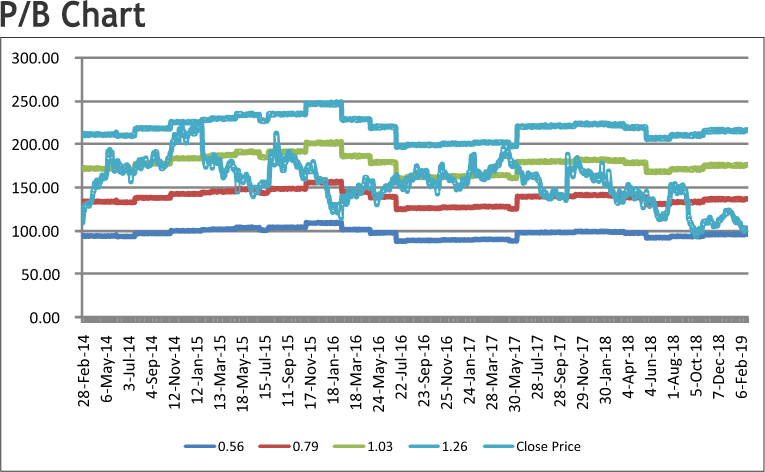
BANK OF BARODA
CMP: 108.50
Target Price: 130
Upside: 19%
| Face Value (Rs.) | 2.00 |
| 52 Week High/Low | 157.45/90.70 |
| M.Cap (Rs. in Cr.) | 26732.94 |
| EPS (Rs.) | 0.00 |
| P/E Ratio (times) | 0.00 |
| P/B Ratio (times) | 0.61 |
| Stock Exchange | BSE |
Investment Rationale
• The bank has posted healthy core operating performance in the quarter ended December 2018. The net interest income of the bank has increased 16.6% after adjustment for IT refund, while the bank has posted 16.11% growth in the core fee income in Q3FY2019. The fee income of the bank is showing strong traction, while bank is strongly focusing on growing and broad basing fee income to offset the impact of volatility in treasury income.
• Continuous credit growth registered with an average growth of 19.43% from last five quarters. Domestic Y-o-Y credit growth on terminal and average basis at 21.13% and 23.34% respectively. Retail loans increased by 32.58% led by home and auto loans at 33.93% and 50.61% respectively.
• Domestic CASA grew by 10.3% YoY– driven by both domestic CA at 9.9% YoYwhile domestic SA at 10.3% YoY; domestic CASA ratio now stands at 40.0% v/s 40.5% in 2QFY19.
• The bank has improved margin to 2.69% in Q3FY2019 from 2.61% in Q2FY2019.
• The provision coverage ratio improved above 73.47% end December 2018 and slippages are leveled. Dec’18 quarter fresh slippages include an amount of INR 1,169 crore from IL&FS group which contributed 40% of fresh slippages. The exposure to NBFC sector stand sat Rs 72843 crore end December 2018.
• Gross NPA reduced to 11.01% as on December 31, 2018 against 11.78% last quarter. Net NPA ratio declines to 4.26% from 4.86% last quarter. Absolute amount of Net NPA also declines by Rs. 1,929 crore to Rs.19,130 crore, lowest in seven quarters. The bank aims to reduce net NPA ratio to 3% by March 2020.
• The bank has focused on improving its sales force team, which could support business growth. Further, the bank is talking to many corporate regarding working capital solutions, providing wealth management products, etc., to generate fee income for the bank. With regard to merger with Dena and Vijaya Bank, the bank expects the effective date of merger to be 1 April 2019.
Risk
• Unidentified Asset Slippages. (Non- Identified NPA’s)
• Regulatory Provisioning on assets
• Corporate Governance issue
Valuation
The bank has been delivering on improvement on asset quality, cost efficiency, other income & productivity in the past few quarters. The transformation journey aims at improved market share, quality business growth, portfolio diversification and enhanced fee income, with cutting edge digitization of processes, while ensuring due focus is accorded to compliance and controls. Thus, it is expected that the stock will see a price target of Rs.130 in 8 to 10 months time frame on an average P/Bv of 0.73x and FY20 BVPS of Rs.177.60.
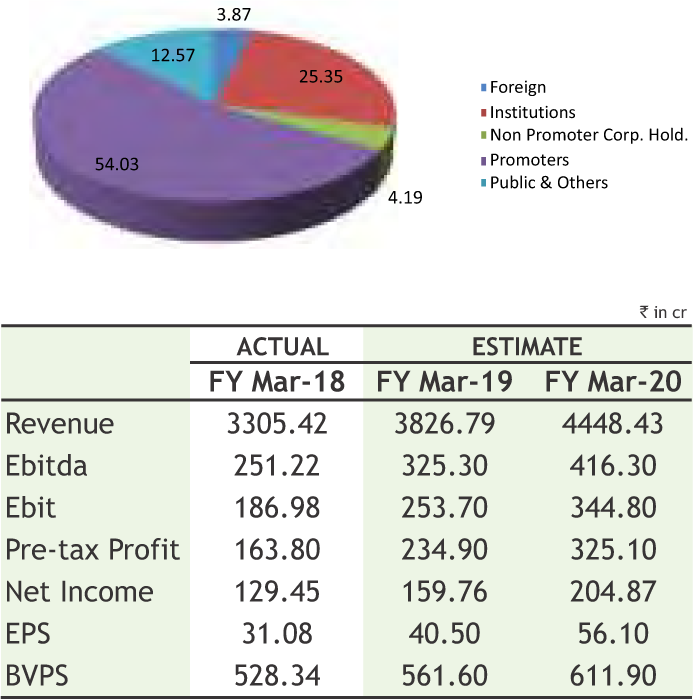
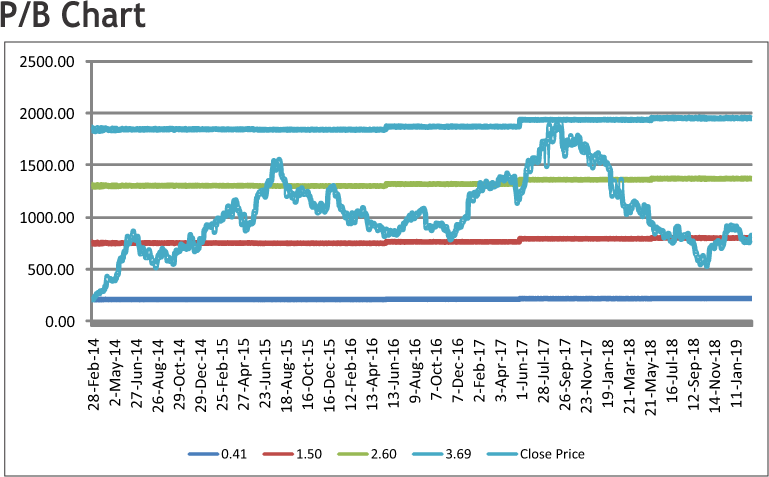
BEML LIMITED
CMP: 853.00
Target Price: 985
Upside: 15%
| Face Value (Rs.) | 10.00 |
| 52 Week High/Low | 1418.05/521.00 |
| M.Cap (Rs. in Cr.) | 3479.23 |
| EPS (Rs.) | 21.36 |
| P/E Ratio (times) | 39.12 |
| P/B Ratio (times) | 1.61 |
| Dividend Yield (%) | 0.96 |
| Stock Exchange | BSE |
Investment Rationale
• BEML Limited manufactures and supplies defence ground support equipment such as Tatra based high mobility trucks; Under Mining and Construction business, it manufactures equipment like bulldozers, excavators, dumpers, shovels etc. and under Rail and Metro business, it manufactures rail coaches, metro cars, steel and aluminum wagons etc. It is the first Indian company which has acquired Metro Car manufacturing capability in the country.
• It has recently received contracts worth about Rs 400 crore for 7 metro train sets for metro services in Bengaluru & an order from DMRC (Delhi Metro Rail Corporation) for supply of 378 metro coaches to Mumbai Metro Line worth about Rs 3,015 crore.
• Recently, it has signed a Certificate of Partnership with US-based Lockheed Martin Aeronautics Company. This step opens up avenues for collaboration between the two companies to explore manufacturing of support equipment opportunities in aerospace. As at the end of Q3 FY19, the company’s order book stands at Rs. 9,339 Crores.
• The company’s order book enhances the revenue visibility. The company’s role as a nodal agency for sourcing by the Ministry of Defence underlines its strategic importance to the Government and is expected to support its defence revenues going forward. The management has committed to take the pie of defence vertical to around 25% of the overall revenues by end of Fy19.
• In Q3 FY19, Revenue from operations witnessed a strong growth of 26% YoY to Rs 924 crores from Rs 732 crores in Q3 FY18. EBITDA surged 81% YoY to Rs 75 crores resulting in EBITDA margin swelling by
247 bps to 8.2%. Net profit after taxes more than doubled as PAT jumped from Rs 17 crores in Q3 FY18 to Rs 45 crores in Q3 FY19.
Risk
• Revenue realization
• Commodity price fluctuation
Valuation
BEML will continue to benefit from its market position, strong relationship with its customers and diversified product portfolio. Engagement with government organizations such as DRDO (Defence Research and Development Organization) and ARAI (Automotive Research Association of India) has lead to development of new products, which have yielded significant dividends and will continue to do so. Government’s make in India programme and the subsequent indigenization of Rail coaches, Mobility vehicles & in Defence and Aerospace sector will provide significant traction going forward. Thus, it is expected that the stock will see a price target of Rs. 985 in 8 to 10 months time frame on the current P/BVx of 1.61x and FY20 BVPS of Rs. 611.90.
Source: Company Website Reuters Capitaline
Above calls are recommended with a time horizon of 8 to 10 months.
6

The stock closed at Rs 233.90 on 08th March, 2019. It made a 52-week low of Rs 202.05 on 17th May 2018 and a 52-week high of Rs. 249.80 on 03rd September 2018. The 200 days Exponential Moving Average (DEMA) of the stock on the daily chart is currently at Rs 222.39
Stock melted down sharply from 90 levels and made yearly low of 33 in short span of time. Then after, it was trading in consolidation zone for eight months and formed an “Inverted Head and Shoulder” pattern on weekly charts, which is considered to be bullish. Last week, stock has given the breakout of same by gained over 9%, along with rise in volumes which gives the positive outlook for coming days. Therefore, one can buy in the range of 48-49 levels for the upside target of 58-60 levels with SL below 44.

The stock closed at Rs 574.95 on 01st March, 2019. It made a 52-week low at Rs 472.25 on 08th Oct 2018 and a 52-week high of Rs. 664.70 on 23rd April 2018. The 200 days Exponential Moving Average (DEMA) of the stock on the daily chart is currently at Rs 550.17
As we can see on charts that stock was consolidating in the wide range of 480 to 600 levels and formed a “Continuation Triangle” on weekly charts, which is bullish in nature. Last week, stock has given the breakout of same by registering gains over 8% and also has managed to close above the same so follow up buying can continue in coming days. Therefore, one can buy in the range of 564-568 levels for the upside target of 610-620 levels with SL below 530.
Disclaimer : The analyst and its affiliates companies make no representation or warranty in relation to the accuracy, completeness or reliability of the information contained in its research. The analysis contained in the analyst research is based on numerous assumptions. Different assumptions could result in materially different results.
The analyst not any of its affiliated companies not any of their, members, directors, employees or agents accepts any liability for any loss or damage arising out of the use of all or any part of the analysis research.
SOURCE: CAPITAL LINE
Charts by Spider Software India Ltd
Above calls are recommended with a time horizon of 1-2 months
7
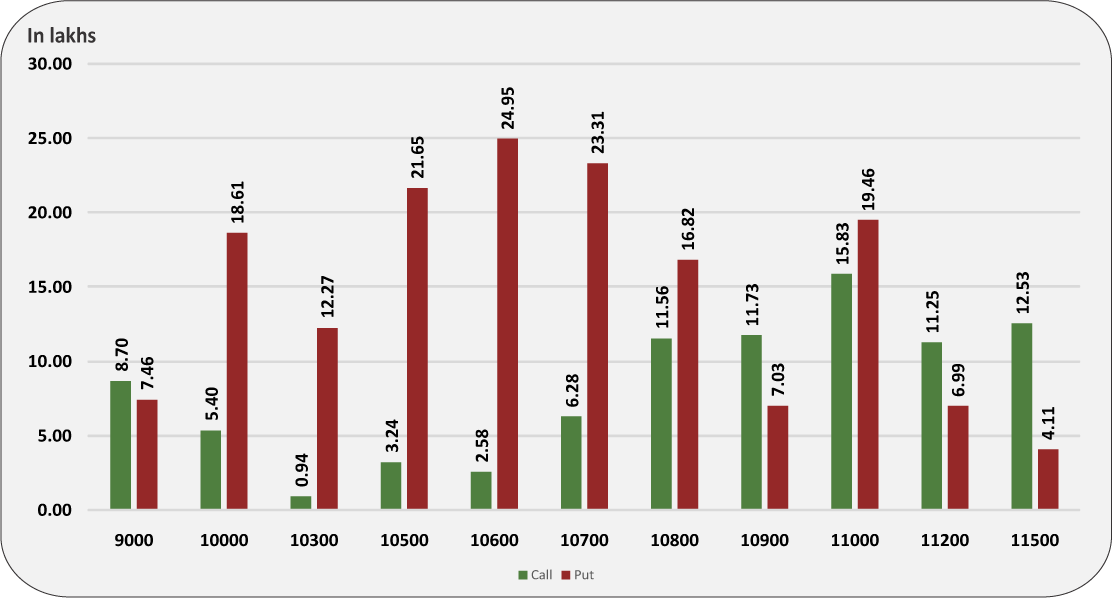
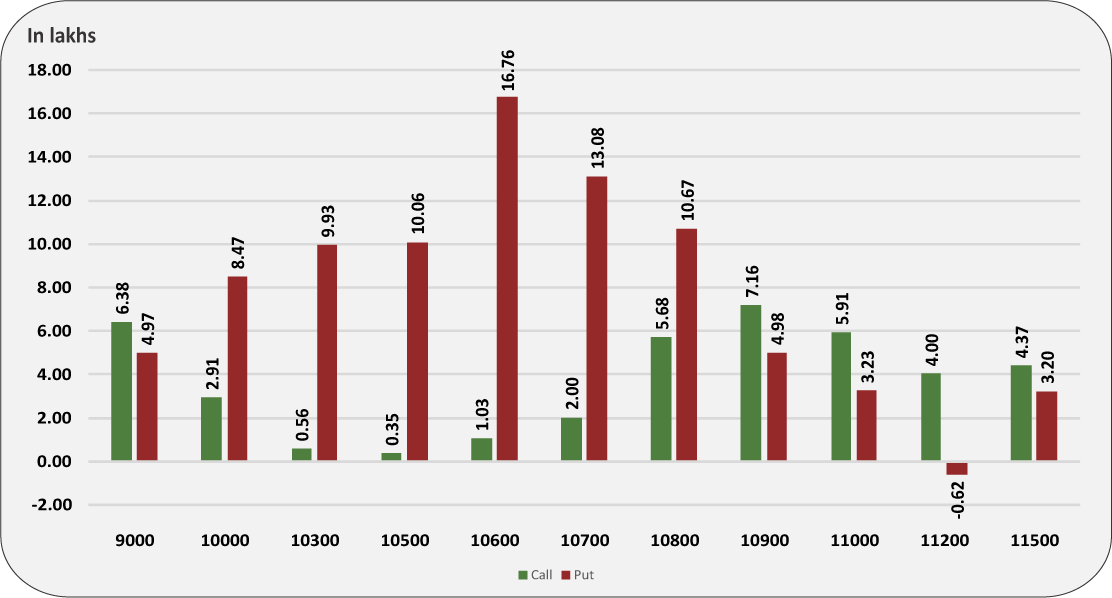
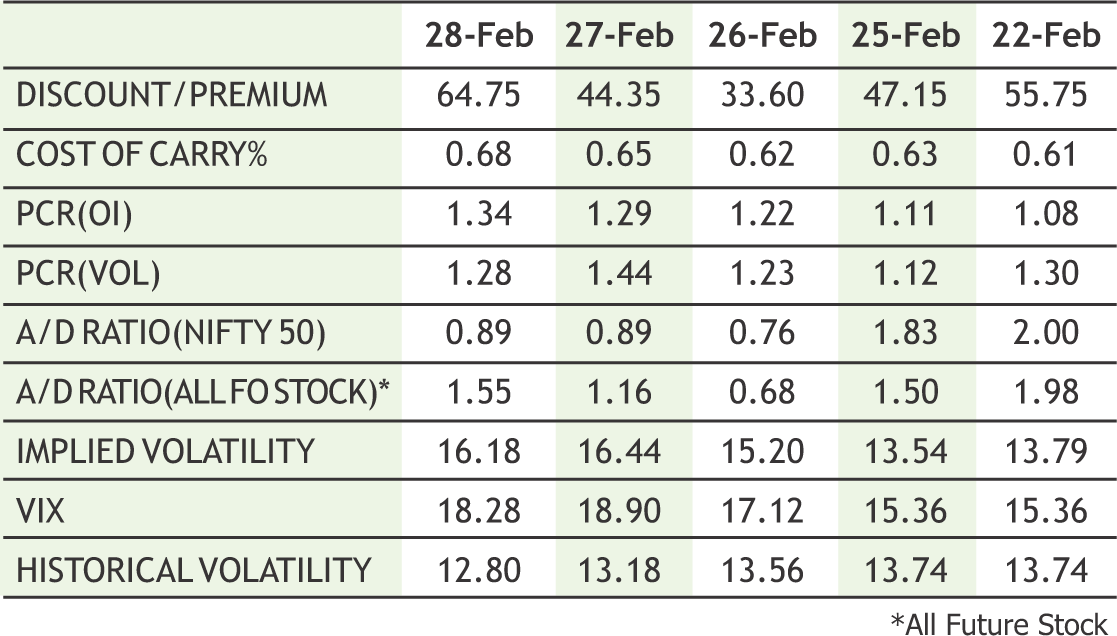
The rollover of nearly 1 crore 42 lakh shares was witnessed in Nifty from February to March series, which is lowest as compared to January and December expiry. Nifty has been rollover within range of 10800- 10850 to March series. Market began the new series with a positive note as smart recovery was seen from lower levels. However, from derivative front options data reflects that calls writers and put writers were actively selling OTM options. The maximum open interest buildup of more than 25 lakh shares at 10600 puts was seen, which should act as strong support zone moving forward whereas at 11000 call option sellers are active in monthly and weekly series which will act as resistance in upcoming sessions. The Implied Volatility (IV) of calls closed at 16.18% while that for put options closed at 16.03%. The Nifty VIX for the week closed at 18.28% and is expected to remain sideways. Next week, we expect that Nifty is most likely to trade in the range of 10600 to 11000 with high volatility and some stock specific action. The PCR OI for the week closed up at 1.34 which indicates OTM put writing. On the technical front, 10800-10750 future levels is strong support zone and current trend is likely to remain sideways with stock specific moves.
8
|
|
|
|
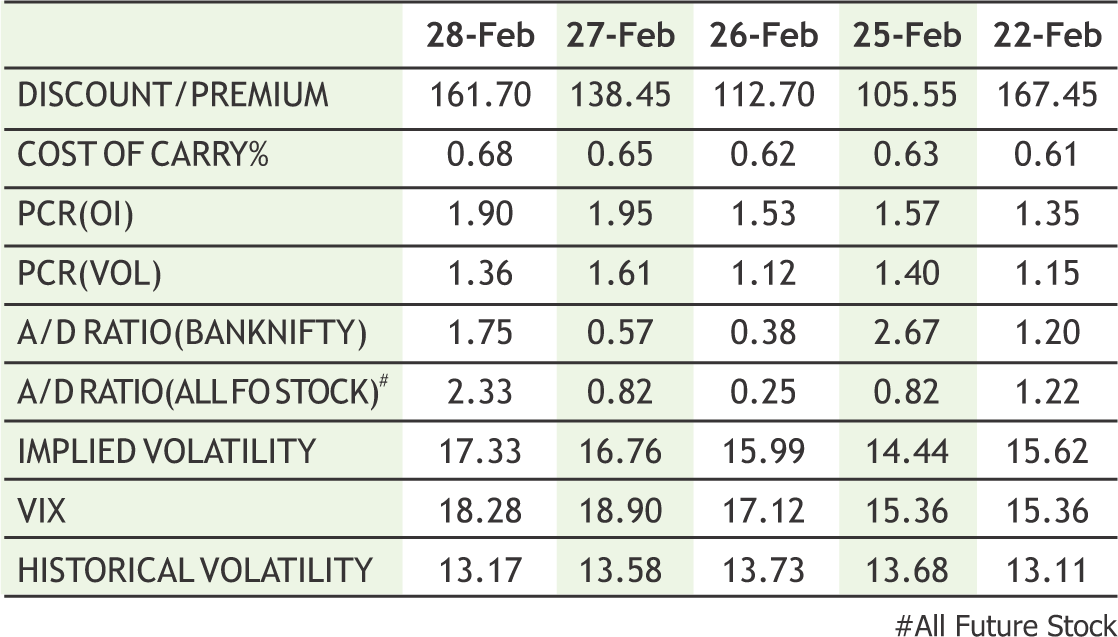
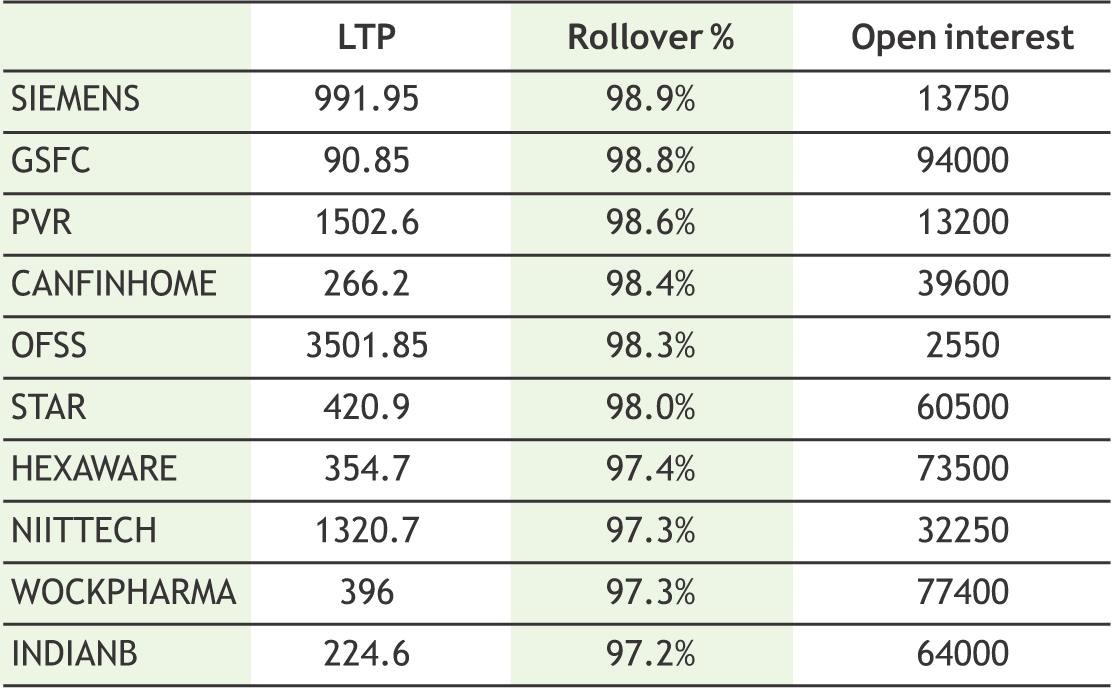
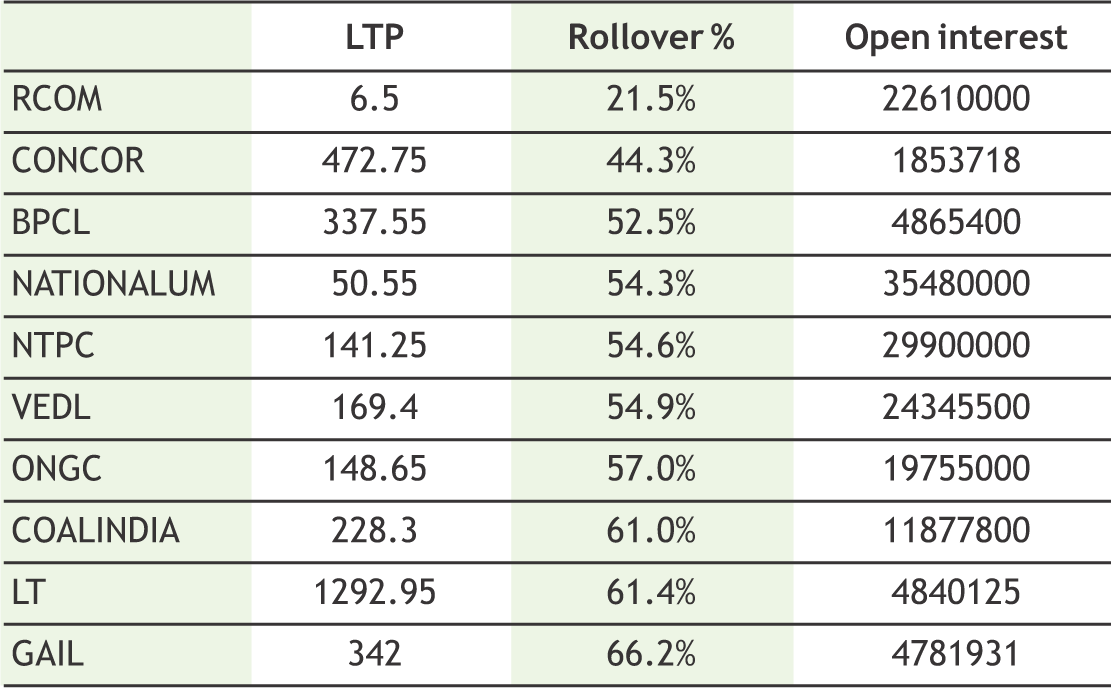
**The highest call open interest acts as resistance and highest put open interest acts as support.
# Price rise with rise in open interest suggests long buildup | Price fall with rise in open interest suggests short buildup
# Price fall with fall in open interest suggests long unwinding | Price rise with fall in open interest suggests short covering
9
The gains due to lower level buying seen in turmeric futures (Apr) is likely to be temporary as the overall fundamentals are bearish due to oversupply. Turmeric prices have slumped nearly 11% in the past 2 months thanks to mounting stocks at wholesale markets. Apart from the aforesaid, one of the major factors that is hitting the turmeric farmers is increased yield in Maharashtra and other state. Jeera futures (Mar) is likely to witness an upside momentum & test 15800-15900 taking support near 15300 levels. The reason being is that there is a possibility of damage to the cumin seed crop due to unfavorable weather over the growing regions. It is reported seasonal diseases are beginning to occur in jeera crop due to mixture of all weather conditions from sun-shadow to moisture and hot weather. The growers have started putting pesticides in fields. However if the clouds rinsed again, then owing to the dew, the cumin seed will be blackened. Thereby, there will be a substantial loss of cash crop in the crop. Coriander futures (Apr) is expected to hover sideways in the range of 6000-6400 levels. The downside may remain capped and the supply concerns are expected to support prices. Further, export demand for Indian coriander too has been high from countries such as Malaysia, Egypt, UAE and Saudi Arabia. This demand is likely to go even higher in the remaining months of the fiscal as the output by the other producers are going to be lesser. It is estimated that the global coriander production is estimated to decline by 40 per cent this year.
Bullion counter may witness selling pressure at higher levels as bounce back in greenback amid better than expected US GDP numbers. The US economy grew at 2.6% as compared to estimates of 2.2%. Weakness in the gold could be restricted after US president Trump walked out prematurely on second day of talks with him and the North Korea leader. Both the leaders had disagreement on their negotiation talk and it ended up a “no deal” event. With failed summits, investors focus returned to US- China talks, where Trump administration is also having problems reaching a closure to its tariffs war with Beijing. Gold (April) can test 32400 while facing resistance near 33500 while silver (May) can dip towards 39000 while facing resistance near 40600. UK Prime Minister Theresa May put off a vote in parliament on her Brexit deal until as late as March 12 - just 17 days before Britain is due to leave the EU. Federal Reserve’s chairman reiterated that the U.S. central bank would stay patient on further interest rate hikes. Rising risks and recent soft data shouldn’t prevent solid growth for the U.S. economy this year, but the Fed will remain “patient” in deciding on further interest rate hikes, Fed Chair Jerome Powell stated recently. The U.S. Mint sold 12,500 ounces of American Eagle gold coins in February, down 81.1 percent from the previous month. China’s net gold imports via main conduit Hong Kong doubled in January from the previous month, as banks in the world’s top consumer likely stocked up at the beginning of the year.
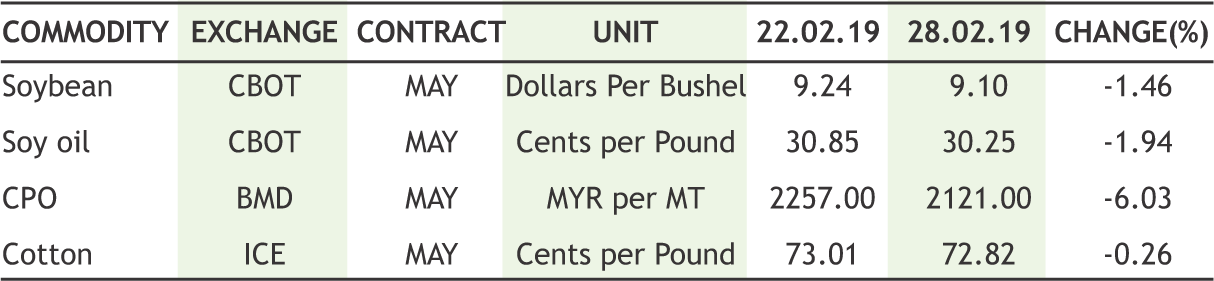
Soybean futures (Mar) is likely to break the support near 3615 & plunge further to test 3550-3500 levels. In the present scenario, the South America meal prices are at much cheaper rate compared to Indian soymeal, hence the export demand for Indian origin meal is likely to remain down in coming weeks. The same shall continue to pressurize domestic market sentiments in coming sessions. CPO futures (Mar) may witness a decline for the third consecutive week towards 545-540 levels due to situation of oversupply in the domestic market. The imports of RBD Palmolein (finished product) have doubled in just two months to almost 275000 in February 2019 from 130,000 tonnes in December 2018 owing to reduction in duty difference from 10% to 5% for Malaysia. Going ahead, the main focus of Malaysian market will be on supply side as the February data will be reported by the Malaysian Palm Oil Board on March 11. Mustard futures (Apr) is trading near its one month low & this downtrend is expected to continue till 3740 levels. India's mustard output in 2018-19 (Jul-Jun) is estimated at 85 lakh tons, up 19% on year. This season yield is also good due to supportive weather conditions in key growing regions. The yield is likely to be around 1,281 kg/ha against 1,120 kg/ha on 63.93 lakh hectares last year. Fresh arrivals of mustard crop have already started in some parts of Rajasthan. According to the trade bodies, so far, about 20-25 per cent of the overall crop has been harvested and the entire harvest is expected to be completed in the next 3-4 weeks.
Crude oil prices may continue to remain on upbeat note as falling stockpiles and decline in US production supported the prices higher. Recently falling EIA oil stockpiles and indications that OPEC will not waiver in its bid to drain oversupply supported the crude oil prices higher. Meanwhile, EIA monthly report stated that U.S. crude oil production edged lower in Dec to 11.85 million Bpd, its first decline since May. Production fell 56,000 bpd from a record 11.91 million bpd in November. Crude oil can test 4250 while taking support near 3900. In Venezuela, suffering from a political and economic crisis, oil exports have plunged by 40 percent to around 920,000 barrels per day (bpd) since the U.S. government slapped sanctions against its petroleum industry on Jan. 28. This drop comes as the Organization of the Petroleum Exporting Countries (OPEC), of which Venezuela is a member, has led efforts since the start of the year to withhold around 1.2 million bpd of supply to prop up prices. Oil markets have generally received support this year from supply curbs by the Organization of the Petroleum Exporting Countries (OPEC), which together with some non-affiliated producers like Russia, known as OPEC+, agreed late last year to cut output by 1.2 million barrels per day (bpd). Natural gas counter may witness short covering at lower levels as it may take support near 180-185 range and recover towards 220 levels. According to Natgasweather the West in US will be cool and stormy as weather systems continue to bring rain and snow this week.
A consolidation can be seen in cotton futures (Mar) in the range of 20250- 20750 levels. On the spot markets, cotton prices have softened, despite a lower crop, on weak demand from both yarn mills and overseas markets. From the total 330 lakh bales of crop, cotton farmers have brought 50% & the balance will be bringing into the markets over the next couple of months. On the demand side, the cotton export from the country is expected to slow down in coming months due to comparatively higher domestic prices than the world. On the international market, market participant’s activity in cotton continues to be handcuffed by the U.S-China trade dispute. Chana futures (Mar) will possibly see 4000 levels this week amid slackened physical trade activity, ongoing new arrivals. Sentiments are weak due to rise in selling of chana by the NAFED. The latest report on Nafed sale report of Chana Procured under PSS during Rabi-18 season as on 27 February, 2019 shows that the total procured Qty. (Net) is 27,24,051.17 MT, progressive quantity sold is 7,81,115.16 MT, leaving a surplus of 19,42,936.01 MT. Mentha oil (Mar) is expected to hold above 1560 levels on reports of delayed sowing in the major growing regions due to the ongoing weather disturbances. As per reports, farmers are worried as untimely rains and inclement weather conditions may affect the crop yield. The market participants are holding on to the optimistic view that prices of mentha oil should rise because of demand from local consumers due to falling stocks of the previous crop. The new crop of mentha oil is likely to hit markets by June.
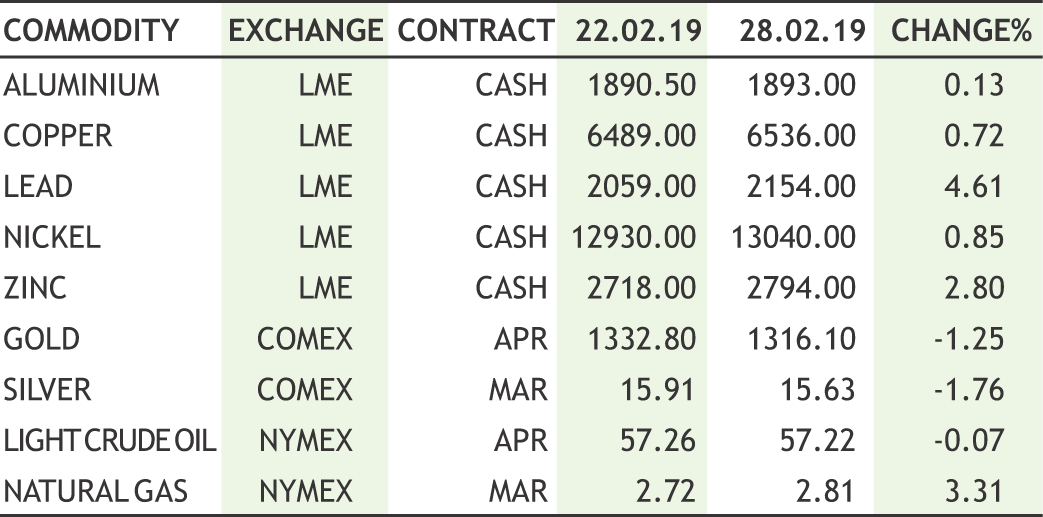
In base metal counter, prices are expected to trade with positive path as falling stockpiles and increase in cancelled warrants may support the sentiments further. Recently weak Chinese data capped the upside to some extent. China factory activity in China contracted to a three-year low in February. Copper may find some support near 445 and can recover towards 485. Supply of copper looked tight after on-warrant stocks available to the market in LME-registered warehouses fell to 21,600 tonnes from around 300,000 tonnes a year ago. They are now the lowest since 2005. Cash copper has also risen to a premium of $46.50 a tonne over the three-month contract from a discount around $20 a tonne earlier in February. Copper inventories in LME-registered warehouses, near 130,000 tonnes, are close to their lowest in 10 years. China imports of copper scrap fell 11.5 percent year on year to 180,000 tonnes in January. Meanwhile Lead may take support near 146 levels and can recover towards 158 levels. Lead hit the highest since late July 2018. On-warrant LME lead inventories slid 42% this week to 44,150 tonnes. Aluminium can remain on firm note as it can recover towards 155 taking support near 146. China’s imports of primary aluminium from Russia rose tenfold year on year in January, data released by the General Administration of Customs showed recently. Global aluminium production contracted in China and the rest of the world in January. Zinc may find support near 192 levels and can recover towards 205 levels. Nickel can also find some support near 880 levels and can recover towards 960 levels.
10
|

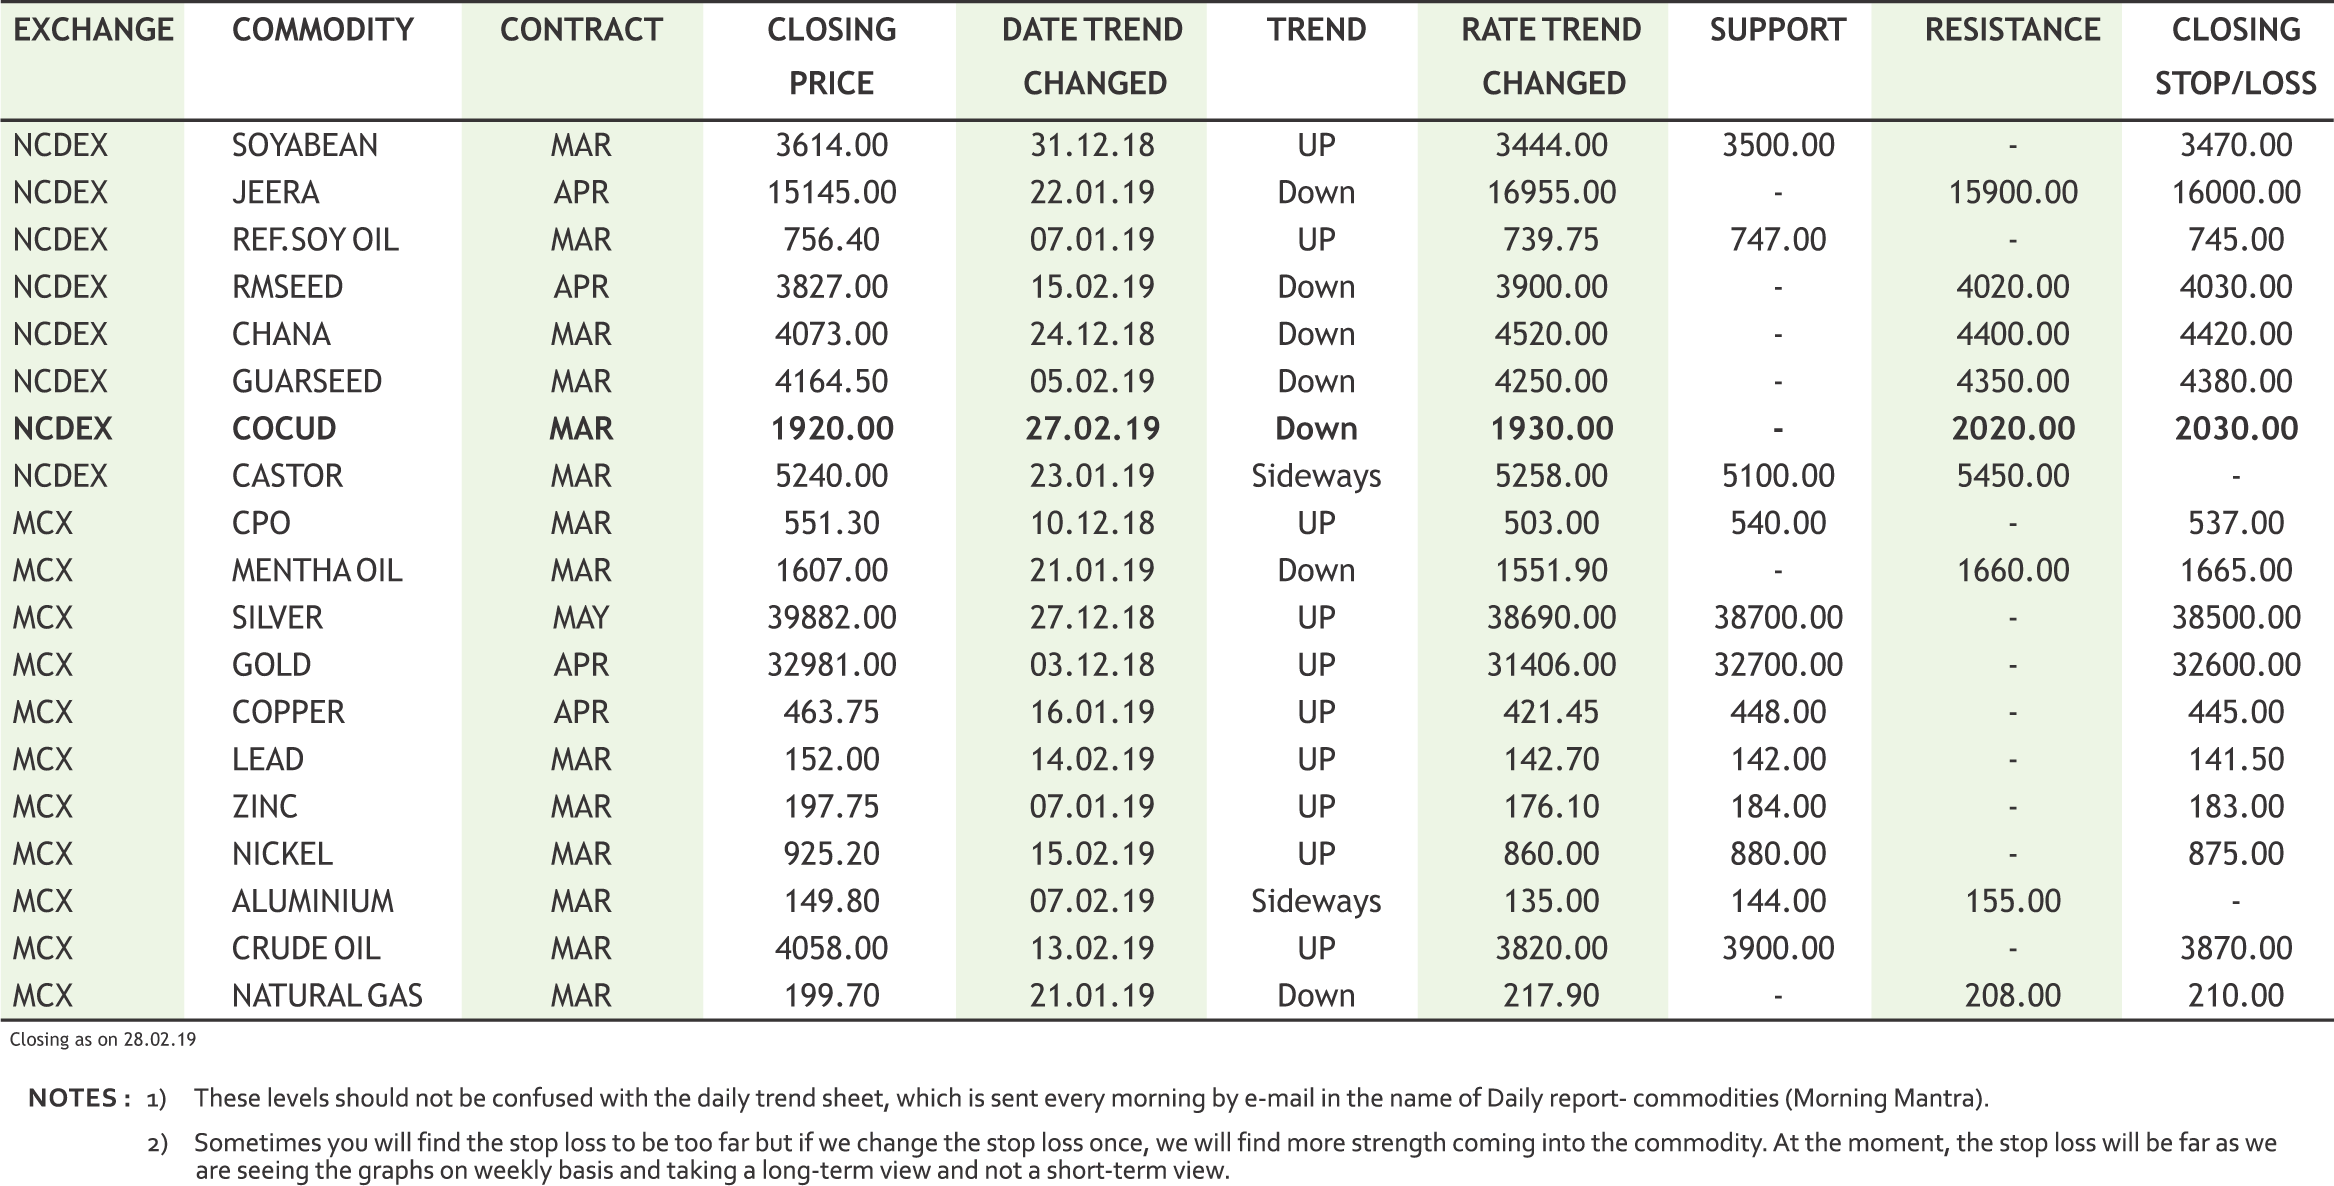
CRUDE OIL MCX (MAR) contract closed at Rs. 4058 on 28th Feb’19. The contract made its high of Rs. 4126 on 22nd Feb’19 and a low of Rs. 3090 on 26th Dec’18. The 18-day Exponential Moving Average of the commodity is currently at Rs. 3936.On the daily chart, the commodity has Relative Strength Index (14-day) value of 60.52.
One can buy at Rs. 4000 for a target of Rs. 4350 with the stop loss of Rs. 3850.

JEERA NCDEX (MAR) contract was closed at Rs. 15425 on 28th Feb’19. The contract made its high of Rs. 19400 on 1st Nov’18 and a low of Rs. 15140 on 26th Feb’19. The 18- day Exponential Moving Average of the commodity is currently at Rs. 15605.8.On the daily chart, the commodity has Relative Strength Index (14-day) value of 40.318.
One can buy above Rs. 15350 for a target of Rs. 15800 with the stop loss of Rs. 15125.

SOYBEAN NCDEX (APR) contract was closed at Rs. 3715 on 7th Mar’19. The contract made its high of Rs. 3985 on 28th Jan’19 and a low of Rs. 3429 on 24th Dec’18. The 18- day Exponential Moving Average of the commodity is currently at Rs. 3753.20.On the daily chart, the commodity has Relative Strength Index (14-day) value of 42.984.
One can sell at Rs. 3770 for a target of Rs. 3650 with the stop loss of Rs 3830.
11
• Chile's Chuquicamata underground copper mine is due to start operations in middle of this year.
• Glencore has lodged a complaint with LME about the company’s inability to take speedy delivery of aluminium from warehouses owned by ISTIM UK in Port Klang, Malaysia.
• U.S. President Donald Trump has warned OPEC not to tighten the oil market too much and risk another spike in prices that could harm the global economy.
• Russia remained China's largest crude oil supplier in January, with imports rising 25% year on year to hold off rival Saudi Arabia.
• Cabinet approves up to Rs.10,540 crore soft loan to sugar mills for clearing cane arrears.
• The Agriculture Ministry’s second advance estimates has pegged that total food grain output for 2018-19 is estimated to be 281.37 MT, nearly 3.5 MT lower than last year’s latest estimates.
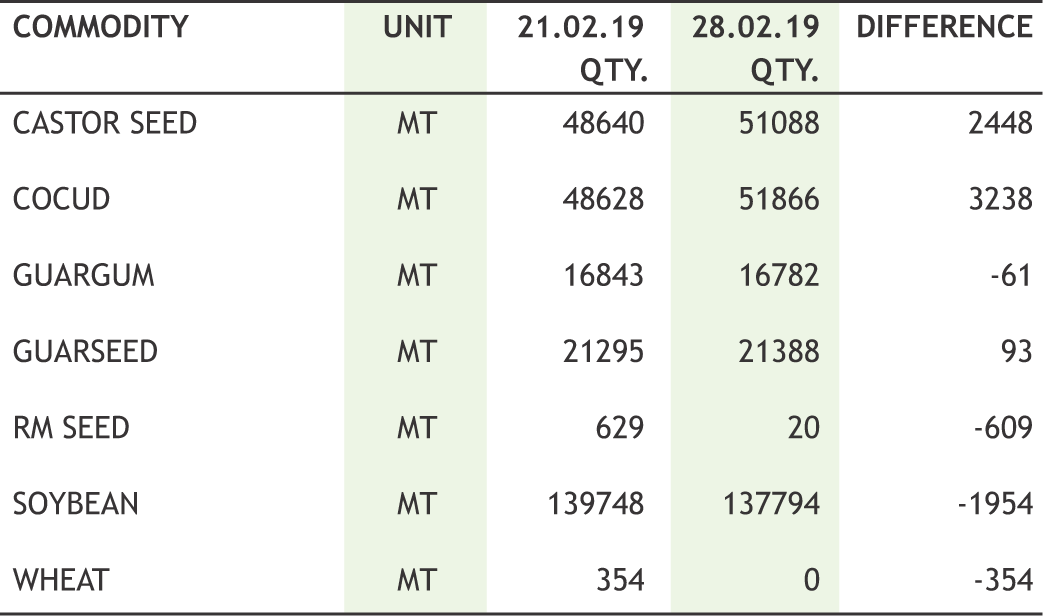
• Additional margin of 5% on both long side and short side of all running contracts and yet to be launched contracts in Castor Seed (CASTOR) shall be withdrawn with effect from beginning of the day Tuesday, March 05, 2019.
• India's castor oil exports fell 13.4% on year to 39,433 tn in January. - Solvent Extractors' Association of India.
• India's mustard output in 2018-19 (Jul-Jun) is estimated at 8.5 mln tn, up 19% on year owing to better yield and favourable weather conditions. - Solvent Extractors' Association of India.
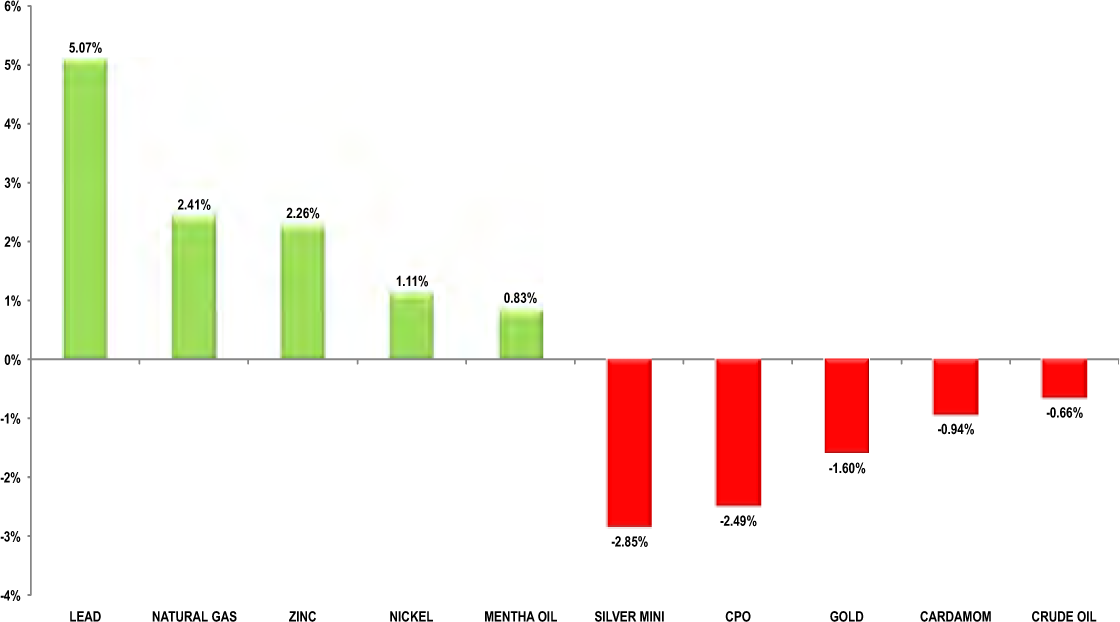
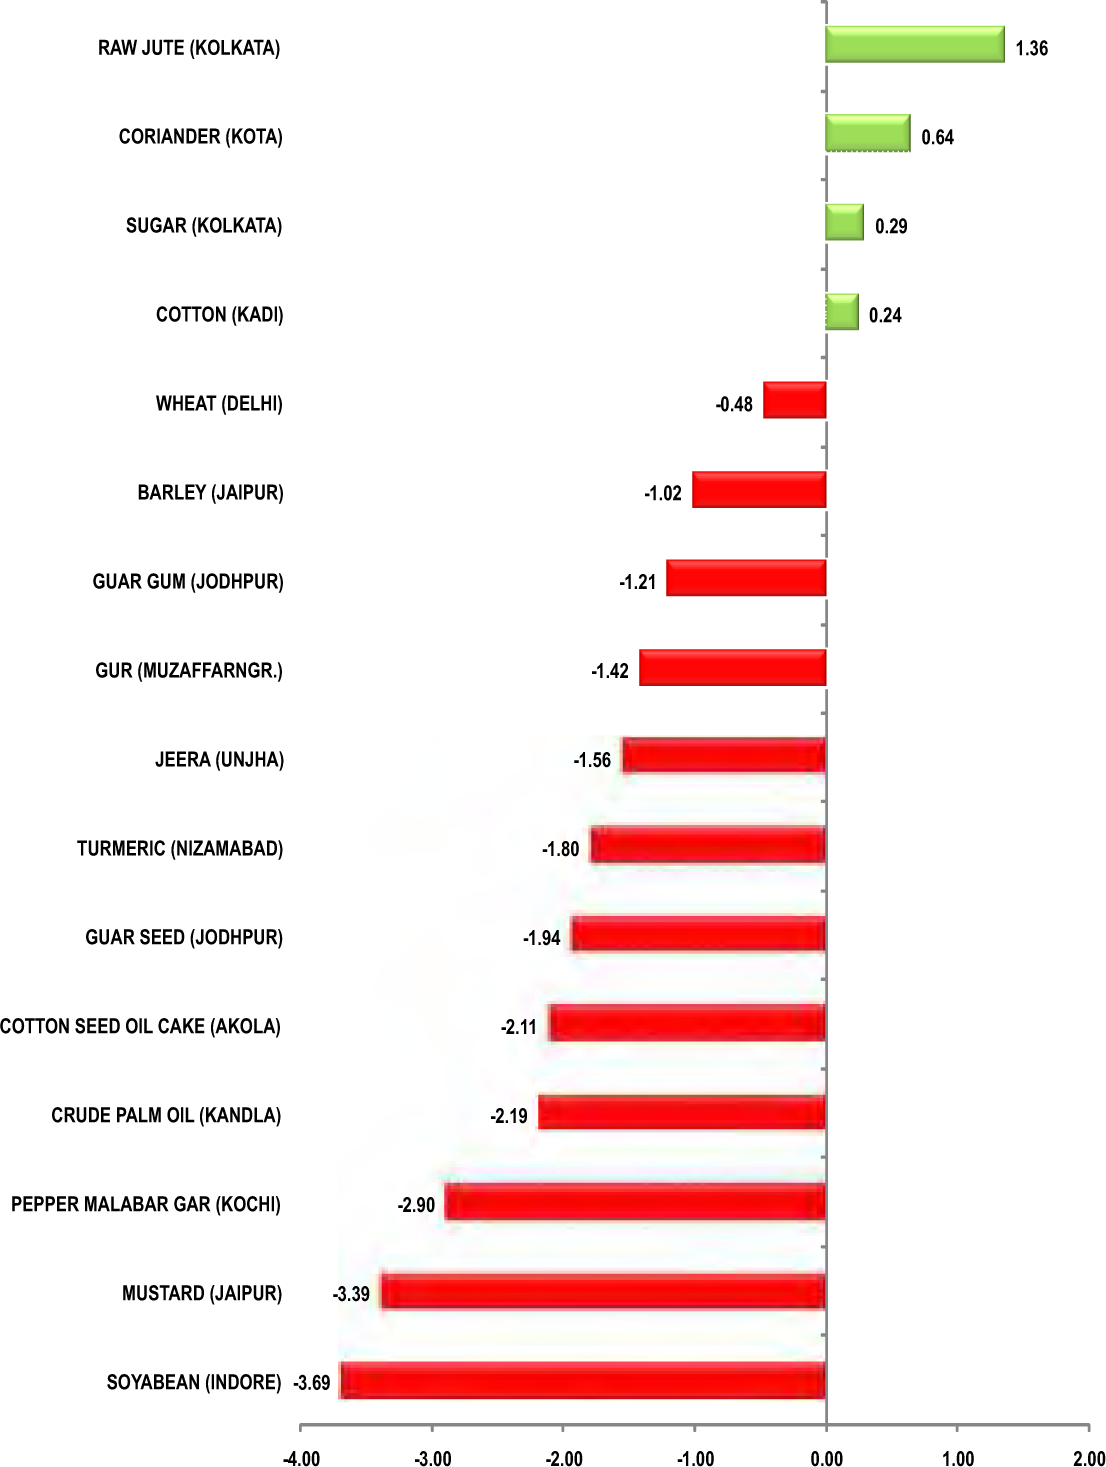
In the week gone by, we saw a mix trend. CRB closed down after a two weeks continuous gain. Dollar index moved down though better than expected GDP data of US offered it timely strength and it saw marginal recovery in the weekly loss. INR traded with wild swings on ongoing tension between India and Pakistan; even equity market reacted in the same manner. Overall it appreciated further, which locked the volatility in commodities to some extent. Despite geopolitical tensions and frustrations over the global economy and political headlines; bullion counter nosedived on some better economic data. In the energy counter, both natural gas and crude moved up; nevertheless the upside in natural gas was limited with the end of winter in sight, there is little prospect of a major rebound in natural gas prices. With roughly six weeks left in the winter season, the chance of meaningful storage scarcity is rapidly declining. The shale gas industry continues to ramp up production, while ongoing gains in associated gas in the Permian have added new supplies. Crude prices rose as much as 8% in February, extending their gains from January's rally. WTI jumped after the latest weekly energy data from the U.S. EIA showed a phenomenal slump in domestic crude inventories that validated OPEC's production cuts. Venezuela's oil exports sank 40% in the first full month after the beginning of U.S. sanctions designed to oust Socialist President Nicolas Maduro. Base metals counter rebounded on ongoing talk between U.S.-China talks amid downside in dollar index coupled with some better economic releases for US. Though; negative trade data from China capped the upside. In agri counter, soyabean prices touched mufti week low as investors worry about U.S.-China trade deal. U.S. soybean prices fell on Thursday despite stronger-than-expected export sales. Mustard prices traded weak too and the bearishness could be attributed the persistent weakness in the prices to cutting down of positions by participants amid weak trend at the spot market. Rising of bets by speculators, driven by surging demand from consuming industries at the spot market against limited supplies from producing regions, drove mentha oil prices higher in futures trade. Halt in arrivals from producing belts amid robust demand from guar gum makers added strength in futures as well. Good rebound witnessed in turmeric futures from lower levels. Like turmeric; coriander prices augmented as well. Lesser production in both domestic and the international market are expected to support coriander prices in the coming months.

|
|
12
|
|
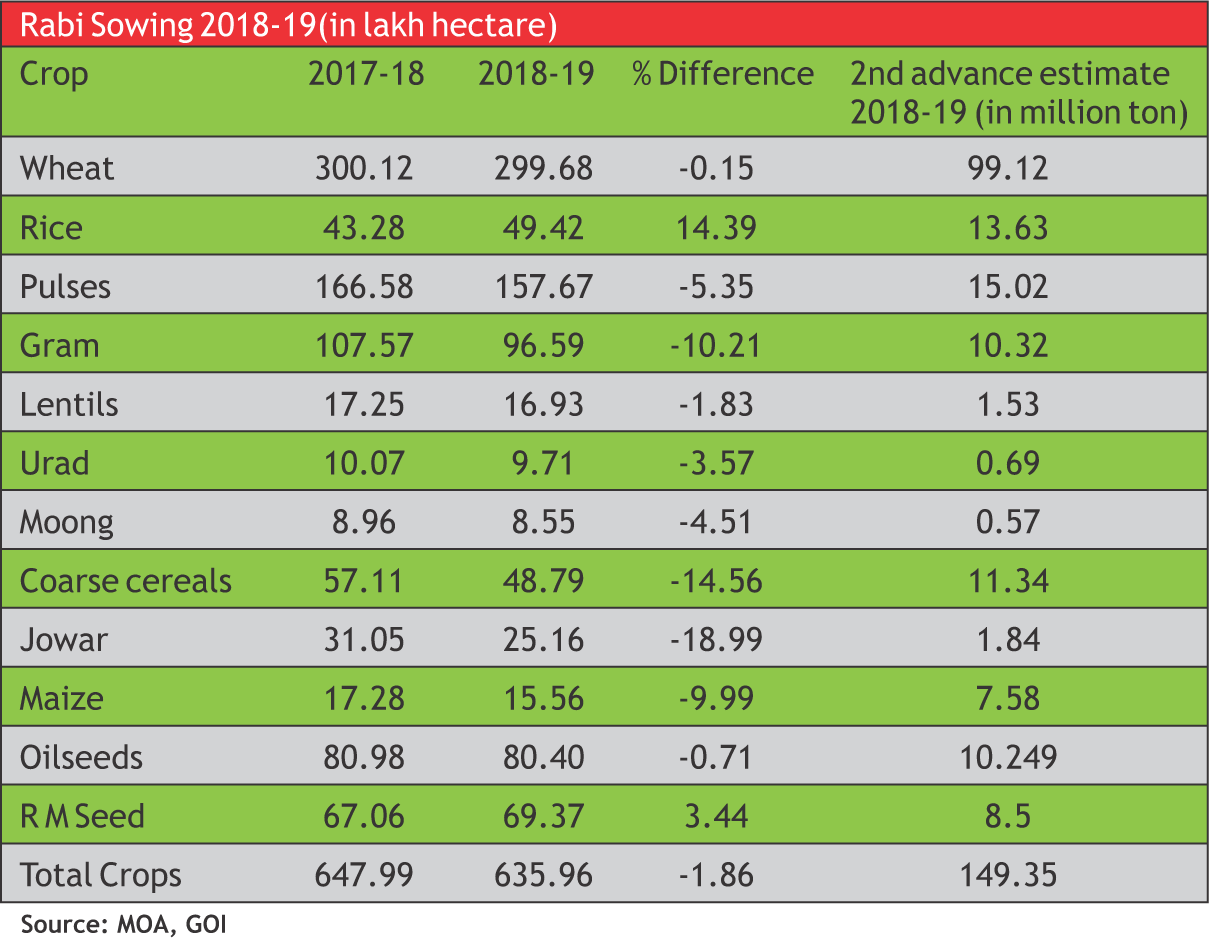
AThe pulses and coarse cereals were nearly 5 and 15 per cent lower than the corresponding period last year while the area under oilseeds are at 80.4 lh, remained more or less the same as in the last rabi season, the data showed. The drought in Maharashtra has dragged down the pulses and coarse cereal cultivation. Karnataka is the state that reported a lower area under pulses cultivation. Thanks to an increase in mustard/rapeseed cultivation in Rajasthan as compared to last year, oilseeds have been able to match up in area, even though the area under oilseeds cultivation is lower than the normal in many States, including Karnataka.
More production in From lesser area
Although the total area sown to all rabi crops was lagging behind as compared with corresponding period of last year, the overall rabi crops is expected to higher than last season. According to agricultural commissioner of India, wheat production in the current rabi season would cross 100 million tonnes on improved productivity despite of similar area coverage to last year. Similarly, despite of only 3.44% increase in area, the country’s rapeseed-mustard crop is likely to provisionally increase 19 per cent to 85 lakh tonnes for 2018-19 on higher yields from 71.5 lt reported in the previous year as estimates shown by the Mustard Oil Producers Association of India (MOPA) and Solvent Extractors Association of India (SEA). The gram production too is expected to be good this year while gram cultivation is down by about 10 per cent as compared last year. This year, the total production of pulses is estimated to touch 25 million tonnes, which would be yet another year of bumper production.
This shows the scenario is emerging that India is poised from area-led growth to productivity-led growth. With better pest management and no incidence of diseases followed by lower temperature in February than last year and the latest rains received has proved a boon for getting a good plant growth for rabi crops.
|
13
|
| 25th FEB | May, Juncker agree Brexit work must be done by March 21, says EU. |
| 25th FEB | Britain to scrap many EU tariffs on unfairly traded goods post-Brexit. |
| 26th FEB | British PM offered lawmakers a choice, no-deal or delay. |
| 26th FEB | Indian Air Force violated LoC, dropped payload, Pakistan alleges. |
| 26th FEB | RBI to infuse Rs 12500 cr through OMO on February 28. |
| 27th FEB | RBI to pump in Rs 1 Lakh Crore cash to ease liquidity. |
| 27th FEB | Japan's factory output posts biggest fall in a year, outlook sags. |
| 28th FEB | RBI, Bank of Japan completes signing of $75 bn currency swap pact. |
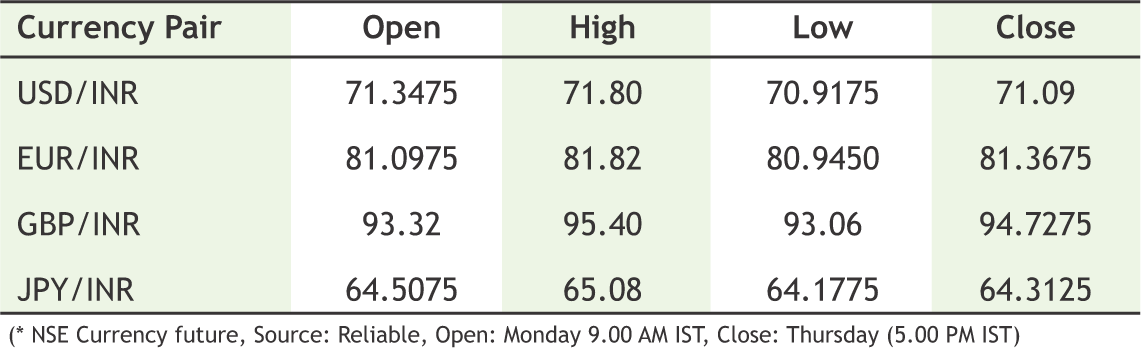
India’s border tension was the only factor, which guided Rupee to south over the week. Indian GDP growth in Oct-Dec printed 6.6 agaisnt 7.7 YoY which give RBI more cushion to further rate cut. Indian Bond market is expecting schedule for OMOs purchase from RBI which can be a supporting factor for Rupee. Globally Trump-Kim summit ended with moderate outcome. The Fed Chair – Jay Powell testimony this week shows the patience Fed is holding for raising Fed Funds rate further though Powell raises alarm for slowdown in economy with inflation expectations are drifitng lower. The economic data from Eurozone and China are declining amid slowdown in global economy and not much influenced by trade conflicts between US-CHINA. As far as Brexit process is concerned, Mrs May gained consensus to delay exit deadline, although Pound has rallied amid such positivity. Going forward next week ECB will lay-out monetary policy as Draghi has cleared his stance for downside risk in growth across Eurozone. Additionaly, US monthly labor data will create some momentum for FOMC to follow through interest rate cycle. USDINR is expected to stay within the range of 70.30 and 71.50.
|

USD/INR (MAR) contract closed at 71.09 on 28th Feb’ 19. The contract made its high of 71.80 on 26th Feb’19 and a low of 70.9175 on 28th Feb’ 18 (Weekly Basis). The 14-day Exponential Moving Average of the USD/INR is currently at 71.42
On the daily chart, the USD/INR has Relative Strength Index (14-day) value of 42.26. One can sell below 70.90 for the target of 70.30 with the stop loss of 71.20.

EUR/INR (MAR) contract closed at 81.3675 on 28th Feb’ 19. The contract made its high of 81.82 on 27th Feb’19 and a low of 80.9450 on 25th Feb’19 (Weekly Basis). The 14-day Exponential Moving Average of the EUR/INR is currently at 81.34
On the daily chart, EUR/INR has Relative Strength Index (14-day) value of 52.14. One can sell at 81.30 for a target of 80.70 with the stop loss of 81.60.

GBP/INR (MAR) contract closed at 94.7275 on 28th Feb’ 19. The contract made its high of 95.40 on 27th Feb’19 and a low of 93.06 on 25th Feb’18 (Weekly Basis). The 14-day Exponential Moving Average of the GBP/INR is currently at 93.55
On the daily chart, GBP/INR has Relative Strength Index (14-day) value of 57.16. One can sell at 94.60 for a target of 94 with the stop loss of 94.90.

JPY/INR (MAR)contract closed at 64.3125 on 28th Feb’ 19. The contract made its high of 65.08 on 27th Feb’19 and a low of 64.1775 on 28th Feb’19 (Weekly Basis). The 14-day Exponential Moving Average of the JPY/INR is currently at 64.72
On the daily chart, JPY/INR has Relative Strength Index (14-day) value of 48.95. One can buy at 63.60 for a target of 64.20 with the stop loss of 63.30.
14
Muthoot Microfin looking at listing in March
Muthoot Microfin, the micro finance arm of Muthoot Pappachan Group (MPG), may list in the local stock market as soon as mid-March, according to Chairman Thomas John Muthoot. The Rs 500-crore IPO together with another Rs 500-crore offer for sale for institutions will dilute the promoter stake in the company to 70 per cent from 86 per cent currently, Muthoot said. The company received a go ahead from the Securities and Exchange Board of India (Sebi) in October last year and will file an update red herring prospectus in the next few days, setting the stage for a possible listing by mid-March. Kerala-based MPG started its microfinance business in 2010. It’s flagship, Muthoot Fincorp, deals in gold loans and loans to micro and small enterprises. The microfinance company was a subsidiary of Muthoot Fincorp till it was spun off. It will be the second company to be listed from the MPG stable after Muthoot Capital services, which deals in two-wheeler loans. The average ticket size in the microfinance business is Rs 30,000, while for gold and MSME loans it is Rs 31,000. The group also has a housing finance arm. It plans to leverage all these businesses. Total microfinance loans are at around Rs 3,000 crore, spread across 537 branches and 17 states. The average loan tenure is about 18 months. In the first nine months of the fiscal, the microfinance company made a net profit of around Rs 100 crore with net NPA of 1.47 per cent. The company’s net interest margin is around 12.15 per cent. It also plans to sell its microfinance loans to banks wanting to make up their priority sector targets.
|
15
|
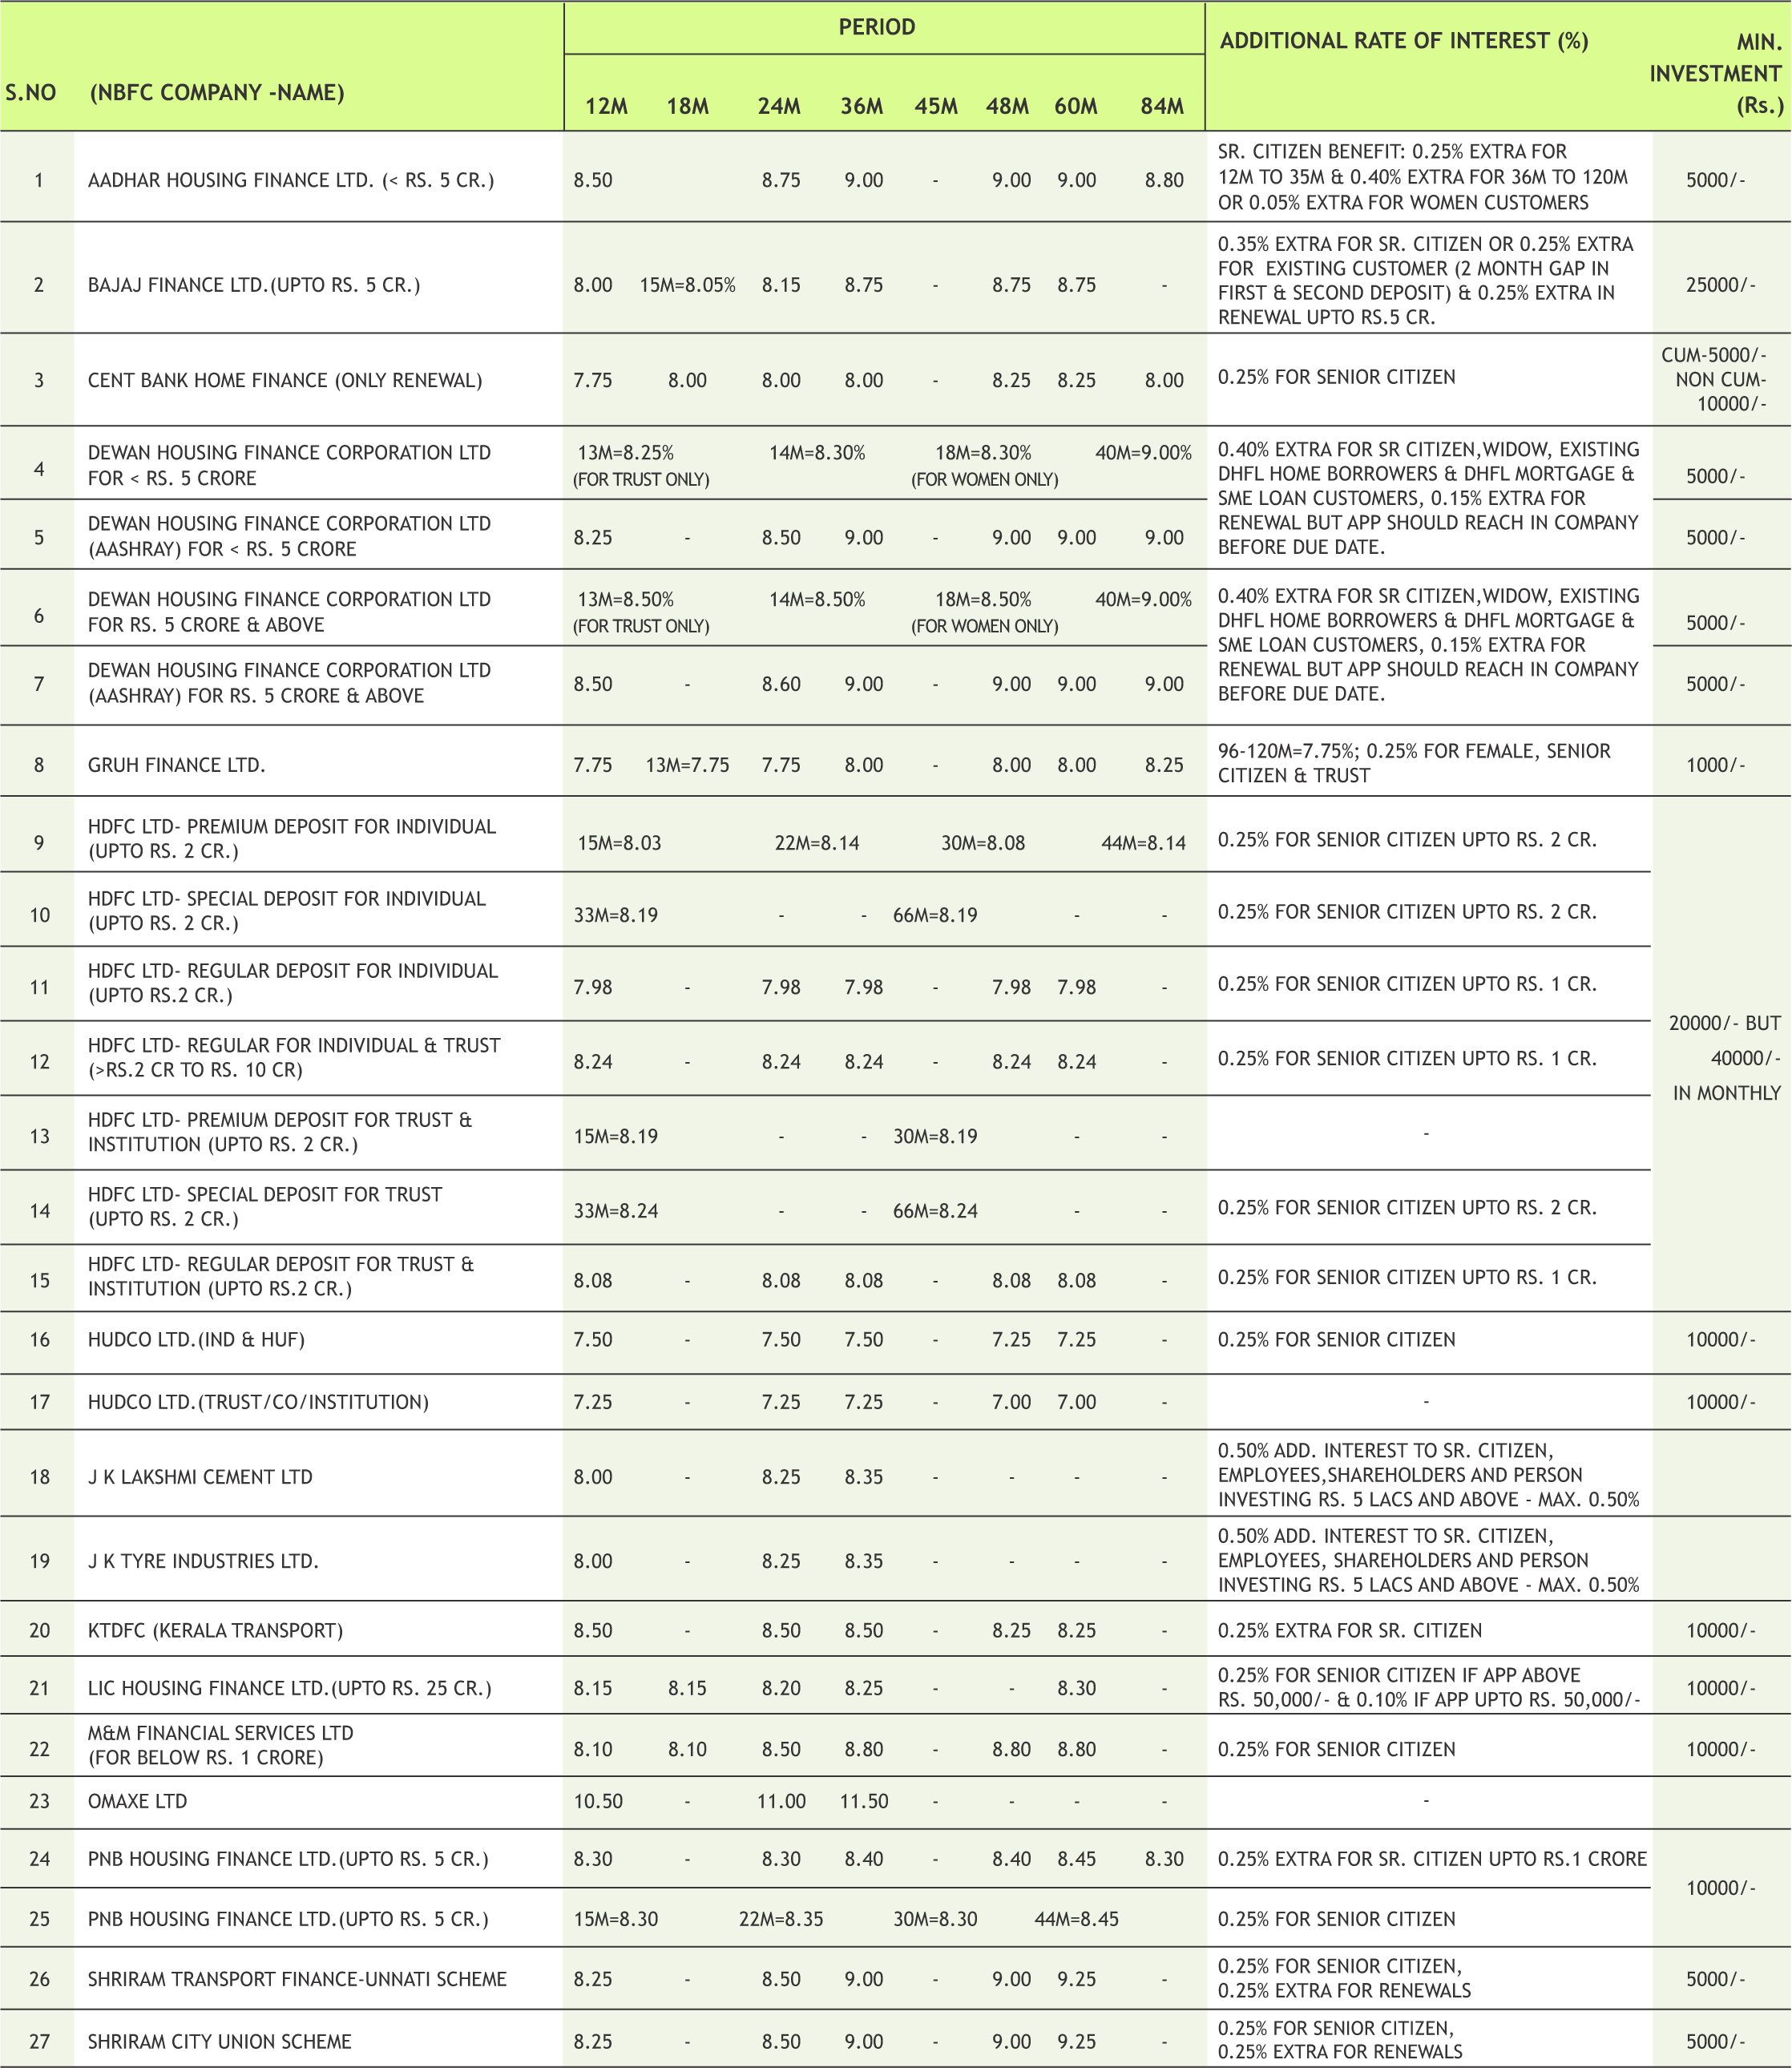
* Interest Rate may be revised by company from time to time. Please confirm Interest rates before submitting the application.
* For Application of Rs.50 Lac & above, Contact to Head Office.
* Email us at fd@smcindiaonline.com

16
Equity fund folio helps add 6.62 lakh investor accounts in January; gold ETFs hit
Equity fund folio addition boosted domestic mutual fund industry, helping it register over 6.62 lakh more investor accounts in January, Securities and Exchange Board of India (SEBI) data shows. Total investor accounts stood at 8.1 crore in January.Equity funds added 3.80 lakh accounts last month, taking the total equity fund folios to 4.99 crore. Equity-linked savings schemes (ELSS) saw an addition of 1.74 lakh accounts due to the tax saving season. Typically, January-March sees a slew of investors flocking to ELSS schemes who invest in them to save taxes. Equity schemes (including equitylinked savings schemes) witnessed total inflows of Rs 6,158 crore in the last month. Apart from equity schemes, balanced funds also added around 18,000 accounts despite the category recorded net outflows of Rs 952 crore in January. Equity funds include pure equity, balanced and ELSS funds. On the debt front, interestingly, liquid funds that were beaten down the most in terms of outflows and fall in the AUM in the last few months, saw an addition of 47,648 accounts. Despite persistent concerns debt funds added 37,917 accounts during the review period. As on January-end, income funds saw inflows of Rs 2,080 crore against outflow of Rs 3,407 crore in December, according to the data on Association of Mutual Funds in India.
Axis Mutual Fund announced the launch of Axis Overnight Fund
Axis Mutual Fund announced the launch of Axis Overnight Fund, an open-ended debt scheme investing in overnight securities. The New Fund Offer (NFO) will open for subscription on Mar 7, 2019 and will close on Mar 12.
Principal Mutual Fund announced the change in exit load of Principal Balanced Advantage Fund
Principal Mutual Fund announced the change in exit load of Principal Balanced Advantage Fund. As per the revised structure, 0.25% of applicable NAV will be applicable on redemptions within 7 days from the date of allotment effective Mar 1, 2019.
DSP Mutual Fund announced change in fund manager of all existing DSP Dual Advantage Funds
.DSP Mutual Fund announced change in fund manager of all existing DSP Dual Advantage Funds with effect from Mar 1, 2019. The new fund manager for the debt portion would be Laukik Bagwe and M. Suryanarayan for the equity portion.
17
|
|
|
|
|
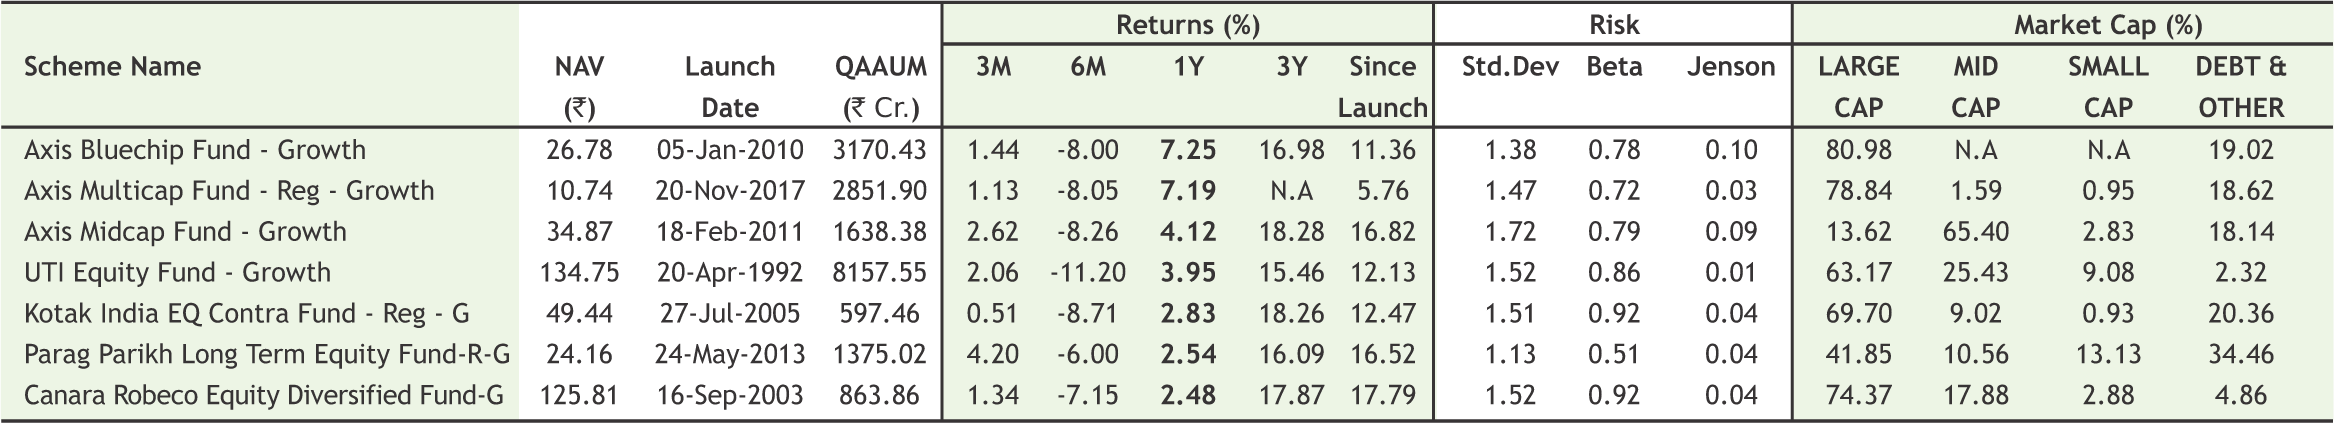
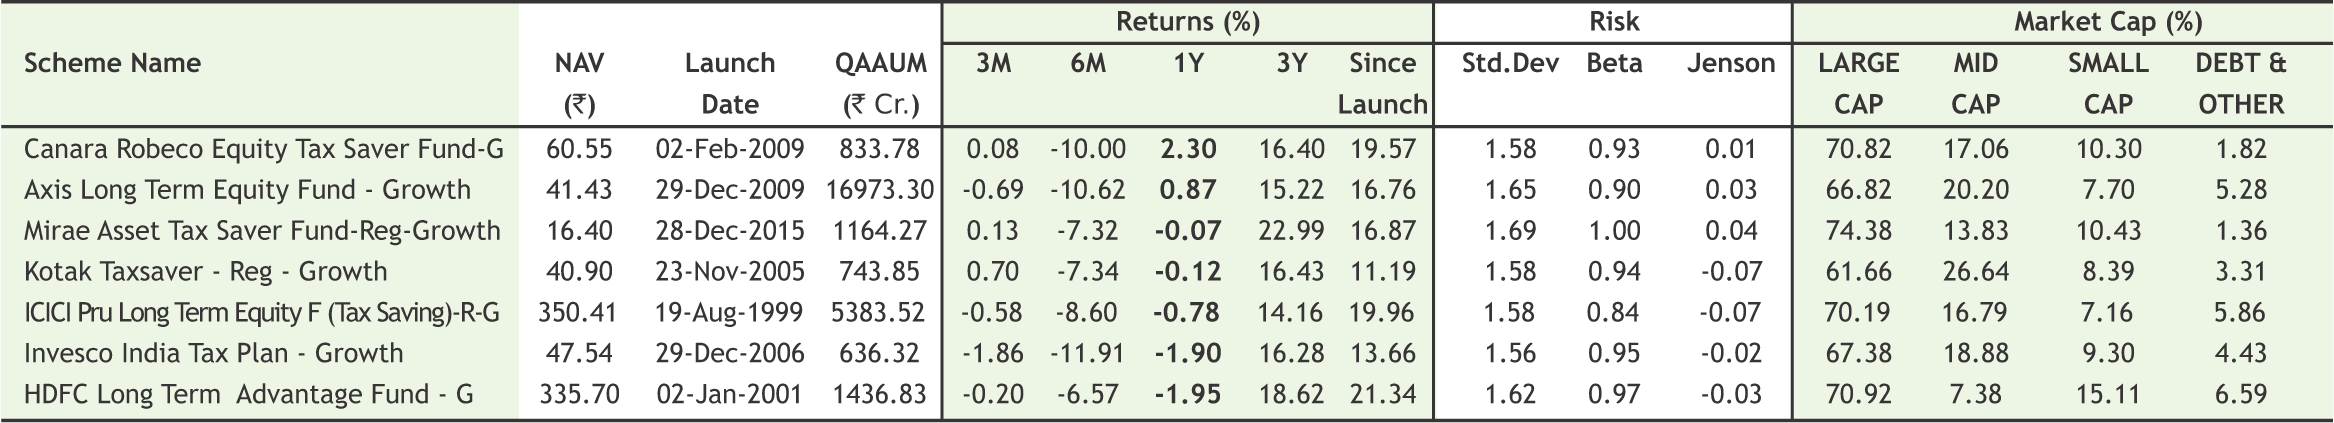
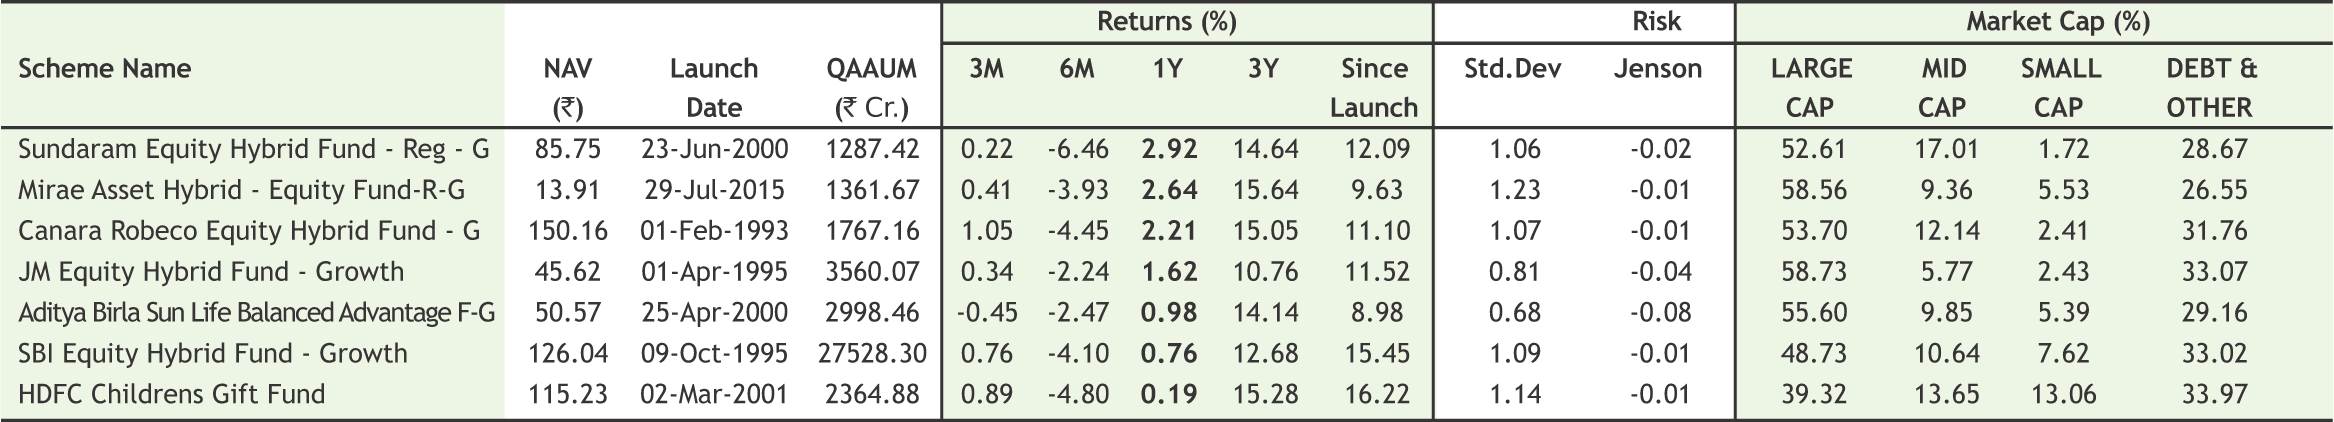
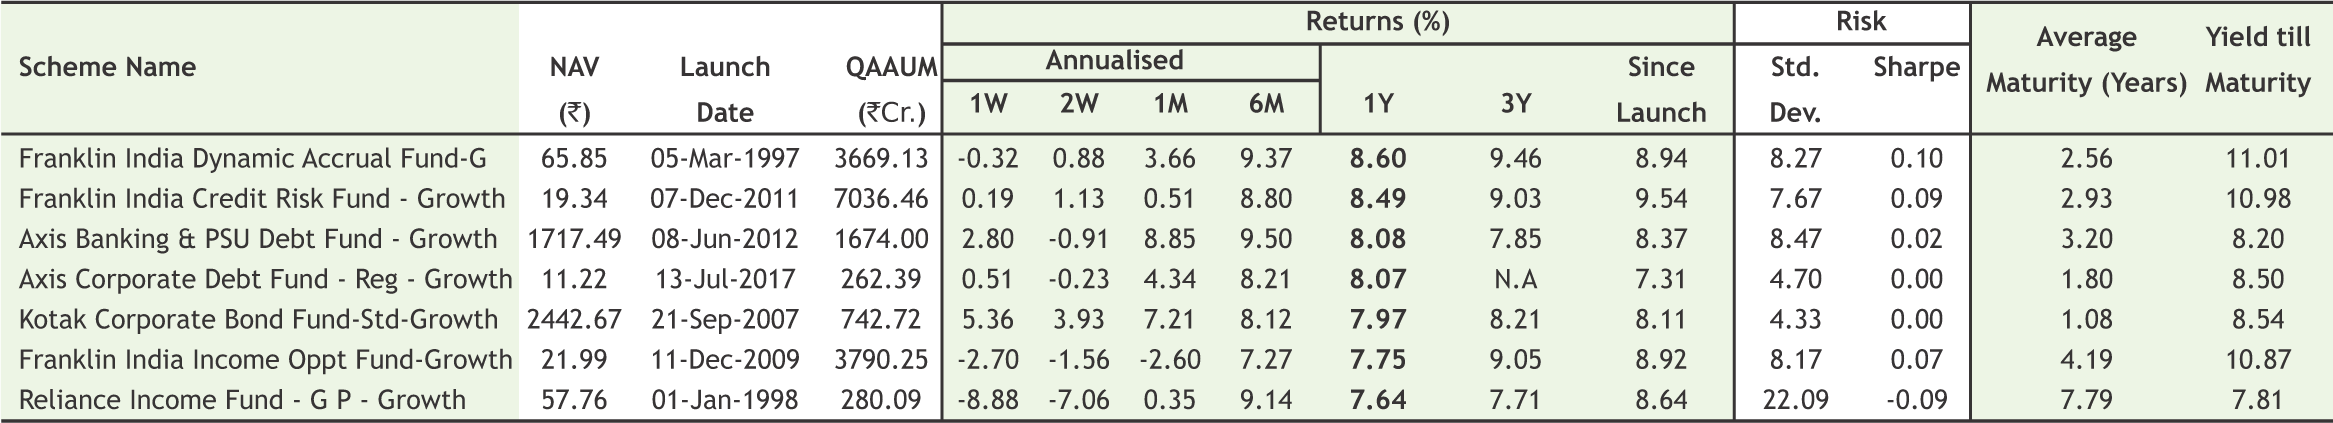
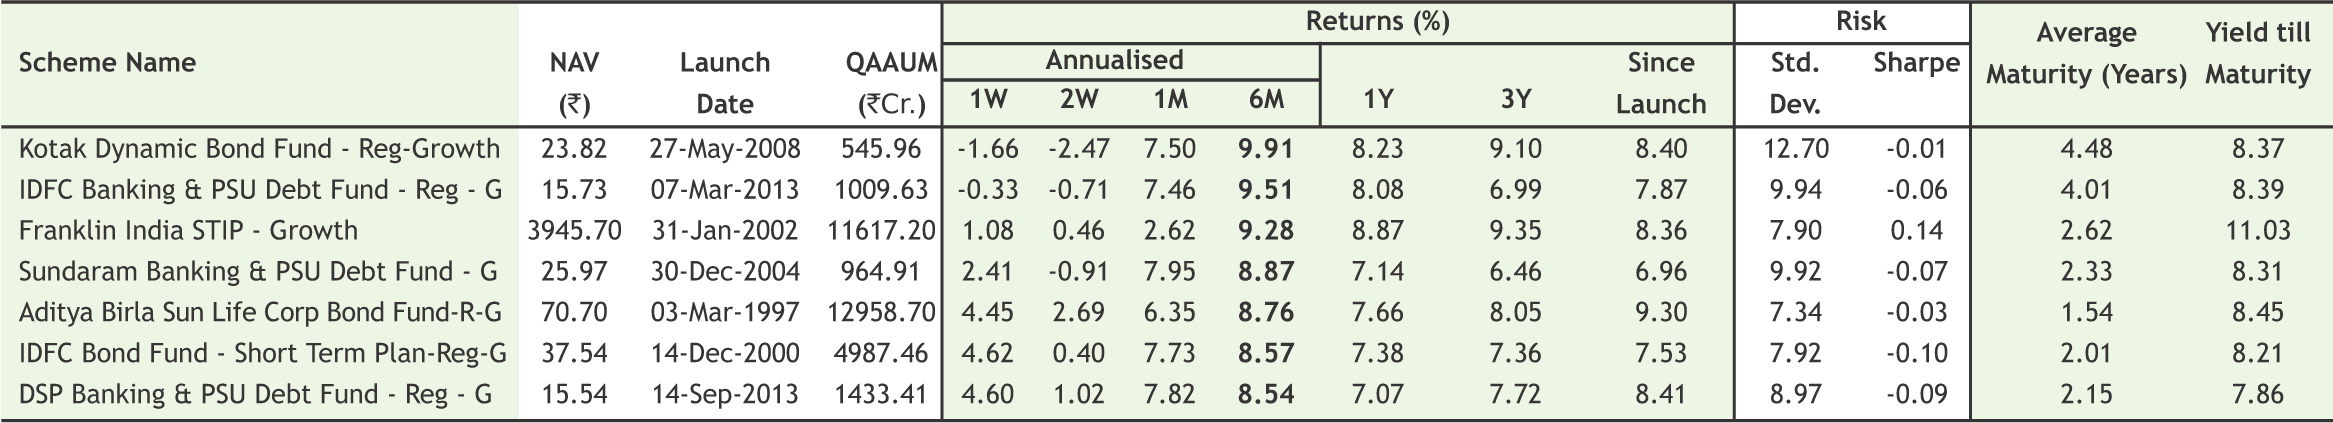
Note:Indicative corpus are including Growth & Dividend option . The above mentioned data is on the basis of 08/08/2019 Beta, Sharpe and Standard Deviation are calculated on the basis of period: 1 year, frequency: Weekly Friday, RF: 7%
*Mutual Fund investments are subject to market risks, read all scheme related documents carefully
17

Cake Cutting Ceremony on the occasion of tie up with Kia Motors held on Wednesday, 27th February, 2019 at SMC Insurance, Pratap Nagar Branch, New Delhi.

. Glimpse of Fun activities being organized on Saturday, 16th February, 2019 at SMC Insurance, Noida Branch.

. Mr. D K Aggarwal (CMD, SMC Investments & Senior VP – PHD Chamber of Commerce) during Call on Meeting with Mr. Vinod Kumar Yadav (IRSEE) (Chairman, Railway Board) held on Monday, 11th February, 2019 at New Delhi.
. Mr. D K Aggarwal (CMD, SMC Investments & Senior VP – PHD Chamber of Commerce) during Call on Meeting with H.E. Ms. Harinder Kaur Sidhu (High Commissioner of Australia to India) held on Friday, 1st February, 2019 at New Delhi.


REGISTERED OFFICES:
11 / 6B, Shanti Chamber, Pusa Road, New Delhi 110005. Tel: 91-11-30111000, Fax: 91-11-25754365
MUMBAI OFFICE:
Lotus Corporate Park, A Wing 401 / 402 , 4th Floor , Graham Firth Steel Compound, Off Western Express Highway, Jay Coach Signal, Goreagon (East) Mumbai - 400063
Tel: 91-22-67341600, Fax: 91-22-67341697
KOLKATA OFFICE:
18, Rabindra Sarani, Poddar Court, Gate No-4,5th Floor, Kolkata-700001 Tel.: 033 6612 7000/033 4058 7000, Fax: 033 6612 7004/033 4058 7004
AHMEDABAD OFFICE :
10/A, 4th Floor, Kalapurnam Building, Near Municipal Market, C G Road, Ahmedabad-380009, Gujarat
Tel : 91-79-26424801 - 05, 40049801 - 03
CHENNAI OFFICE:
Salzburg Square, Flat No.1, III rd Floor, Door No.107, Harrington Road, Chetpet, Chennai - 600031.
Tel: 044-39109100, Fax -044- 39109111
SECUNDERABAD OFFICE:
315, 4th Floor Above CMR Exclusive, BhuvanaTower, S D Road, Secunderabad, Telangana-500003
Tel : 040-30031007/8/9
DUBAI OFFICE:
2404, 1 Lake Plaza Tower, Cluster T, Jumeriah Lake Towers, PO Box 117210, Dubai, UAE
Tel: 97145139780 Fax : 97145139781
Email ID : pankaj@smccomex.com
smcdmcc@gmail.com
Printed and Published on behalf of
Mr. Saurabh Jain @ Publication Address
11/6B, Shanti Chamber, Pusa Road, New Delhi-110005
Website: www.smcindiaonline.com
Investor Grievance : igc@smcindiaonline.com
Printed at: S&S MARKETING
102, Mahavirji Complex LSC-3, Rishabh Vihar, New Delhi - 110092 (India) Ph.: +91-11- 43035012, 43035014, Email: ss@sandsmarketing.in