2020: Issue 727, Week: 16th - 20th March
A Weekly Update from SMC (For private circulation only)
2020: Issue 727, Week: 16th - 20th March
A Weekly Update from SMC (For private circulation only)
 NEY
NEY 

| Equity | 4-7 |
| Derivatives | 8-9 |
| Commodity | 10-13 |
| Currency | 14 |
| IPO | 15 |
| FD Monitor | 16 |
| Mutual Fund | 17-18 |
I
n the week gone by, markets globally turned jittery and went into a tailspin after WHO declared the coronavirus as a pandemic, triggering a major risk aversion and selloff in equities on fears of a global economic recession. US stocks saw worst selling in single session seen since 1987. Markets responded negatively after President Donald Trump said that U.S. is going to ban European travellers for thirty days. European Central Bank didn’t echoed the U.S. Federal Reserve and Bank of England in terms of cutting interest rates but announced measures to support bank lending and expanded its asset purchase program by 120 billion euros. Countries across the world are imposing travel restrictions, fuelling fears of a global economic recession. It currently looks as if more risk aversion is on the cards in the global economy. The ferocity of the sell-off, which was witnessed in the market, has triggered massive global carry trade cuts, which may be an overhang on the markets.
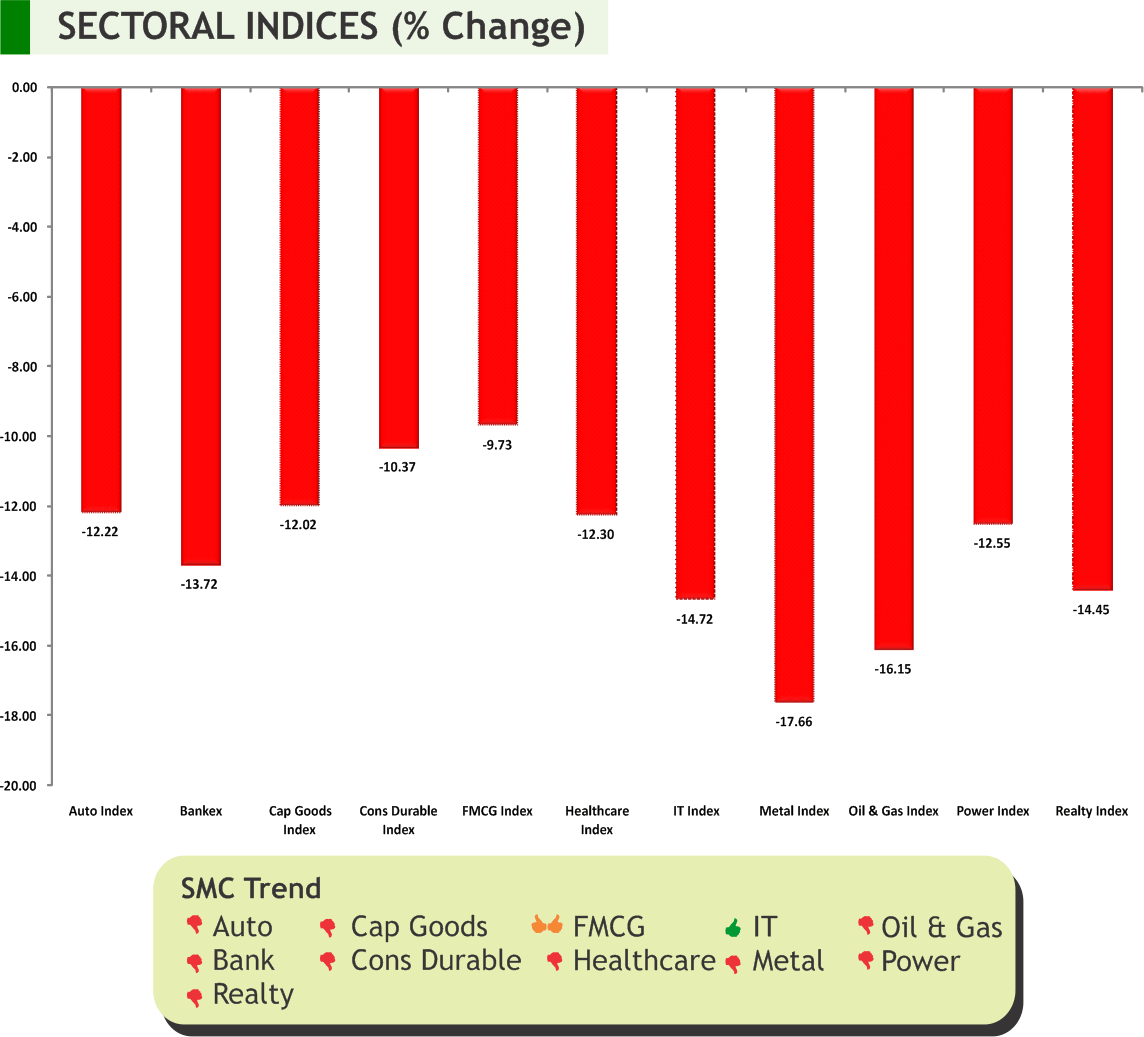
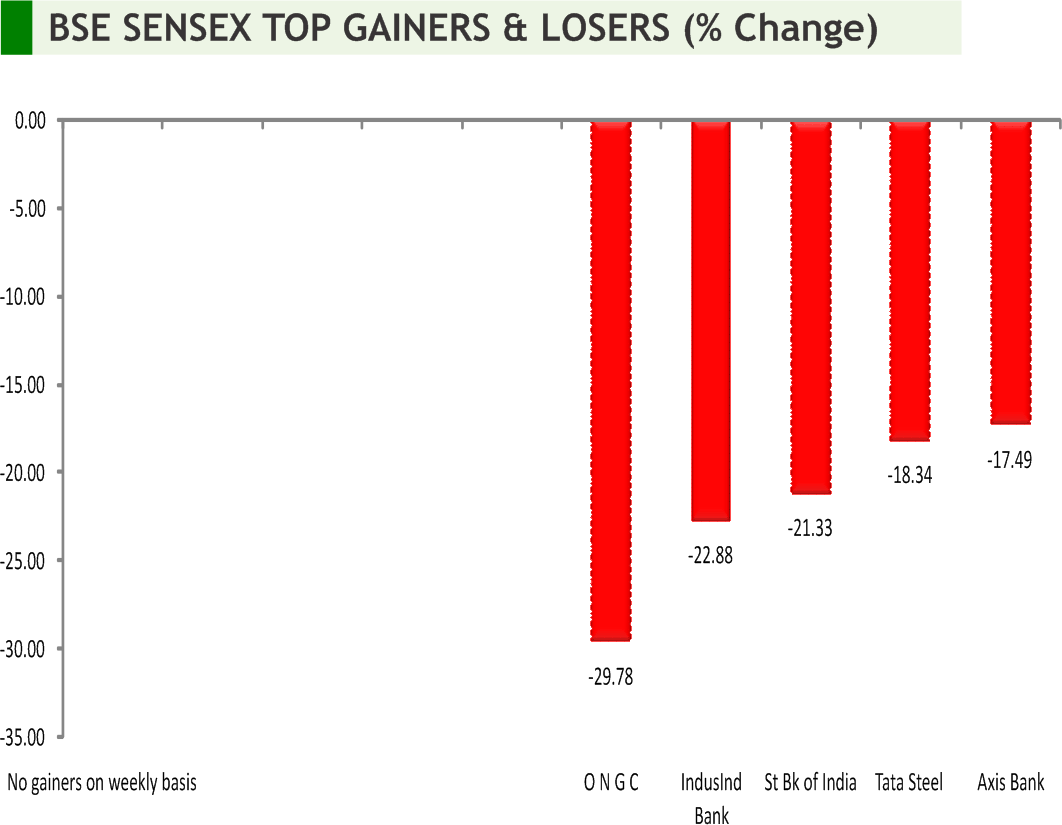
Back at home, domestic market too witnessed huge selloff as the coronavirus pandemic wreaked havoc on global markets. Domestic market hit the lower circuit for the first time in 12 years after 2008 crisis. A selloff across sectors along with panic selling in the broader markets hurt investor sentiment. On Friday, with Nifty hitting circuit breaker, trading on the index was halted for forty-five minutes. Besides a selloff in global equities, massive plunge in international oil prices and depreciating rupee added to the volatility. On the data front, Industrial Production (IIP) rose 2% y-oy in January, against a revised 0.1% in December 2019. In another development, UBS has sharply cut its 2020-21 GDP growth forecast for India to 5.1 percent on fears around the coronavirus outbreak and also weak credit growth domestically. Going forward, there is an expectation that apart from the coronavirus-related measures, the weak credit impulse domestically could constrain growth for some time.
Back at home, bloodshed was seen in financial market and this shook the entire world. To note, due to carnage, global market witnessed a free fall since Wall Street's "Black Monday" crash of 1987. Commodities too were not immune to this rather it gave early indication of this mayhem. Fed took drastic action on Thursday as the stock market meltdown accelerated, pledging to inject as much as $1.5 trillion into U.S. market, nevertheless travel ban by US injected selling pressure. Going forward, Euro-Zone ZEW Survey, German ZEW Survey Expectations, Retail Sales Advance, FOMC Rate Decision, FOMC Rate Decision and Powell Holds Post-FOMC Meeting Press Conference¸ CPI of Canada, BOJ 10-Yr Yield Target and CPI of Japan¸ GDP of Newzeland, Unemployment Rate of Australia, etc are a few high importance data schedule this week.

SMC Global Securities Ltd. (hereinafter referred to as “SMC”) is a registered Member of National Stock Exchange of India Limited, Bombay Stock Exchange Limited and its associate is member of MCX stock Exchange Limited. It is also registered as a Depository Participant with CDSL and NSDL. Its associates merchant banker and Portfolio Manager are registered with SEBI and NBFC registered with RBI. It also has registration with AMFI as a Mutual Fund Distributor.
SMC is a SEBI registered Research Analyst having registration number INH100001849. SMC or its associates has not been debarred/ suspended by SEBI or any other regulatory authority for accessing /dealing in securities market.
SMC or its associates including its relatives/analyst do not hold any financial interest/beneficial ownership of more than 1% in the company covered by Analyst. SMC or its associates and relatives does not have any material conflict of interest. SMC or its associates/analyst has not received any compensation from the company covered by Analyst during the past twelve months. The subject company has not been a client of SMC during the past twelve months. SMC or its associates has not received any compensation or other benefits from the company covered by analyst or third party in connection with the research report. The Analyst has not served as an officer, director or employee of company covered by Analyst and SMC has not been engaged in market making activity of the company covered by Analyst.
The views expressed are based solely on information available publicly available/internal data/ other reliable sources believed to be true.
SMC does not represent/ provide any warranty express or implied to the accuracy, contents or views expressed herein and investors are advised to independently evaluate the market conditions/risks involved before making any investment decision.
DOMESTIC NEWS
Economy
• India’s Current Account Deficit (CAD) narrowed sharply to USD 1.4 billion, or 0.2 per cent of GDP, for the December 2019 quarter. The deficit had stood at 2.7 per cent in the corresponding quarter a year ago and 0.9 per cent in the previous quarter. The sharp contraction in the deficit was mainly due to a lower trade deficit of USD 34.6 billion, and a rise in net services receipts.
• India's industrial output, measured in Index of Industrial Production (IIP), expanded 2 per cent during January, the fastest in six months. The uptick in factory production came on the back of surge in mining and power generation sectors. This was expected as production in eight core sectors grew by 2.2 per cent in January.
• India’s Consumer price inflation moderated to 6.58 percent in February from 7.59 percent in January, the statistics ministry reported. This was below the economists' forecast of 6.8 percent. Nonetheless, inflation accelerated from 2.57 percent in the same period last year.
Telecom
• Bharti Airtel has acquired a strategic stake in Spectacom Global ("Spectacom") under the Airtel Startup Accelerator Program, which focuses on supporting growth of early stage Indian start-ups.
Pharmaceuticals
• Lupin has received certification for International Sustainability Rating System (ISRS), 8th edition, from DNV GL, a global service provider for managing risk and helping customers to safely and responsibly improve their business performance. The certification was received after audits were conducted at four of the company's manufacturing facilities located at Mandideep, Tarapur, Ankleshwar and Dabhasa, in India.
• Biocon, with its partner Mylan, has won a US court ruling that invalidated rival Sanofi’s patent on the insulin Glargine device, removing a key legal hurdle for the biotech major to commercialize Semglee.
Realty/ Construction
• Indian Hume Pipe Company has received Letter of Acceptance for the work of Rs.357.53 crore (including GST) from Madurai City Municipal Corporation, Madurai, Tamil Nadu for providing dedicated water supply to Madurai City Municipal Corporation. The project is to be completed within 30 months followed by 6 months trial run and commissioning. The Agreement will be signed in due course.
INTERNATIONAL NEWS
• Amid the economic fallout from the coronavirus outbreak, the Federal Reserve is taking significant steps to provide liquidity to the financial markets. The New York Fed said that it will offer banks more than $1 trillion worth of additional short-term cash loans as part of an effort to smooth operations in the Treasury and money markets.
• US producer price index for final demand slid by 0.6 percent in February after climbing by 0.5 percent in January. Economists had expected the index to edge down by 0.1 percent.
• US initial jobless claims dipped to 211,000, a decrease of 4,000 from the previous week's revised level of 215,000. Economists had expected jobless claims to inch up to 218,000 from the 216,000 originally reported for the previous week.
• US consumer price index inched up by 0.1 percent in February, matching the uptick seen in January. Economists had expected prices to come in unchanged.
• European Central Bank President Christine Lagarde surprised markets as the bank chose to leave rates unchanged, but there was relief in the form of fresh stimulus measures that included additional EUR 120 billion bond purchases, as the Eurozone is facing a "major shock" from the coronavirus, or Covid-19, outbreak.
| Stocks | *Closing Price | Trend | Date Trend Changed | Rate Trend Changed | SUPPORT | RESISTANCE | Closing S/l |
|---|---|---|---|---|---|---|---|
| S&P BSE SENSEX | 34103 | DOWN | 13.03.20 | 34103 | - | 37000 | 38300 |
| NIFTY50 | 9955 | DOWN | 13.03.20 | 9955 | - | 10800 | 11200 |
| NIFTY IT | 13665 | DOWN | 13.03.20 | 13665 | - | 14800 | 15400 |
| NIFTY BANK | 25347 | DOWN | 13.03.20 | 25347 | - | 28000 | 29000 |
| ACC | 1179 | DOWN | 14.02.20 | 1440 | - | 1260 | 1280 |
| BHARTIAIRTEL | 492 | DOWN | 13.03.20 | 492 | - | 510 | 520 |
| BPCL | 376 | DOWN | 28.02.20 | 426 | - | 420 | 430 |
| CIPLA | 426 | DOWN | 20.02.20 | 436 | - | 440 | 450 |
| SBIN | 242 | DOWN | 28.02.20 | 303 | - | 270 | 285 |
| HINDALCO | 127 | DOWN | 31.01.20 | 189 | - | 145 | 155 |
| ICICI BANK | 447 | DOWN | 28.02.20 | 497 | - | 470 | 485 | INFOSYS | 642 | DOWN | 13.03.20 | 642 | - | 690 | 720 |
| ITC | 162 | DOWN | 31.05.19 | 279 | 175 | 180 | |
| L&T | 1051 | DOWN | 15.11.19 | 1378 | 1120 | 1160 | |
| MARUTI | 5839 | DOWN | 31.01.20 | 6913 | - | 6300 | 6450 |
| NTPC | 98 | DOWN | 16.08.19 | 118 | 105 | 108 | |
| ONGC | 66 | DOWN | 06.12.19 | 127 | 80 | 84 | |
| RELIANCE | 1105 | DOWN | 31.01.20 | 1412 | - | 1180 | 1210 |
| TATASTEEL | 327 | DOWN | 31.01.20 | 439 | - | 360 | 370 |
Closing as on 13-03-2020
NOTES:
1) These levels should not be confused with the daily trend sheet, which is sent every morning by e-mail in the name of "Morning Mantra ".
2) Sometimes you will find the stop loss to be too far but if we change the stop loss once, we will find more strength coming into the stock. At the moment, the stop loss will be far as we are seeing the graphs on weekly basis and taking a long-term view and not a short-term view.
| Meeting Date | Company name | Purpose |
|---|---|---|
| 16-Mar-20 | Oil & Natural Gas Corp. | Dividend |
| 16-Mar-20 | Indraprastha Gas | Dividend |
| 16-Mar-20 | GHCL | Dividend |
| 17-Mar-20 | Adani Enterprises | Dividend |
| 17-Mar-20 | Sun Pharma. Industries | Buyback |
| 17-Mar-20 | RBL Bank | Dividend |
| 17-Mar-20 | Muthoot Finance | Dividend/Fund Raising |
| 17-Mar-20 | Kotak Mahindra Bank | Dividend |
| 18-Mar-20 | Dixon Technologies (India) | Dividend |
| 18-Mar-20 | NLC India | Fund Raising |
| 18-Mar-20 | Piramal Enterprises | Dividend |
| 19-Mar-20 | NTPC | Dividend |
| 16-Mar-20 | Marico | Interim Dividend - Rs.0.75Per Share |
| 16-Mar-20 | Havells India | Interim Dividend - Rs 4 Per Share |
| 16-Mar-20 | Adani Ports and Special Economic Zone | Interim Dividend - Rs 3.20 Per Share |
| 16-Mar-20 | Power Grid Corp. of India | Interim Dividend - Rs 5.96 Per Share |
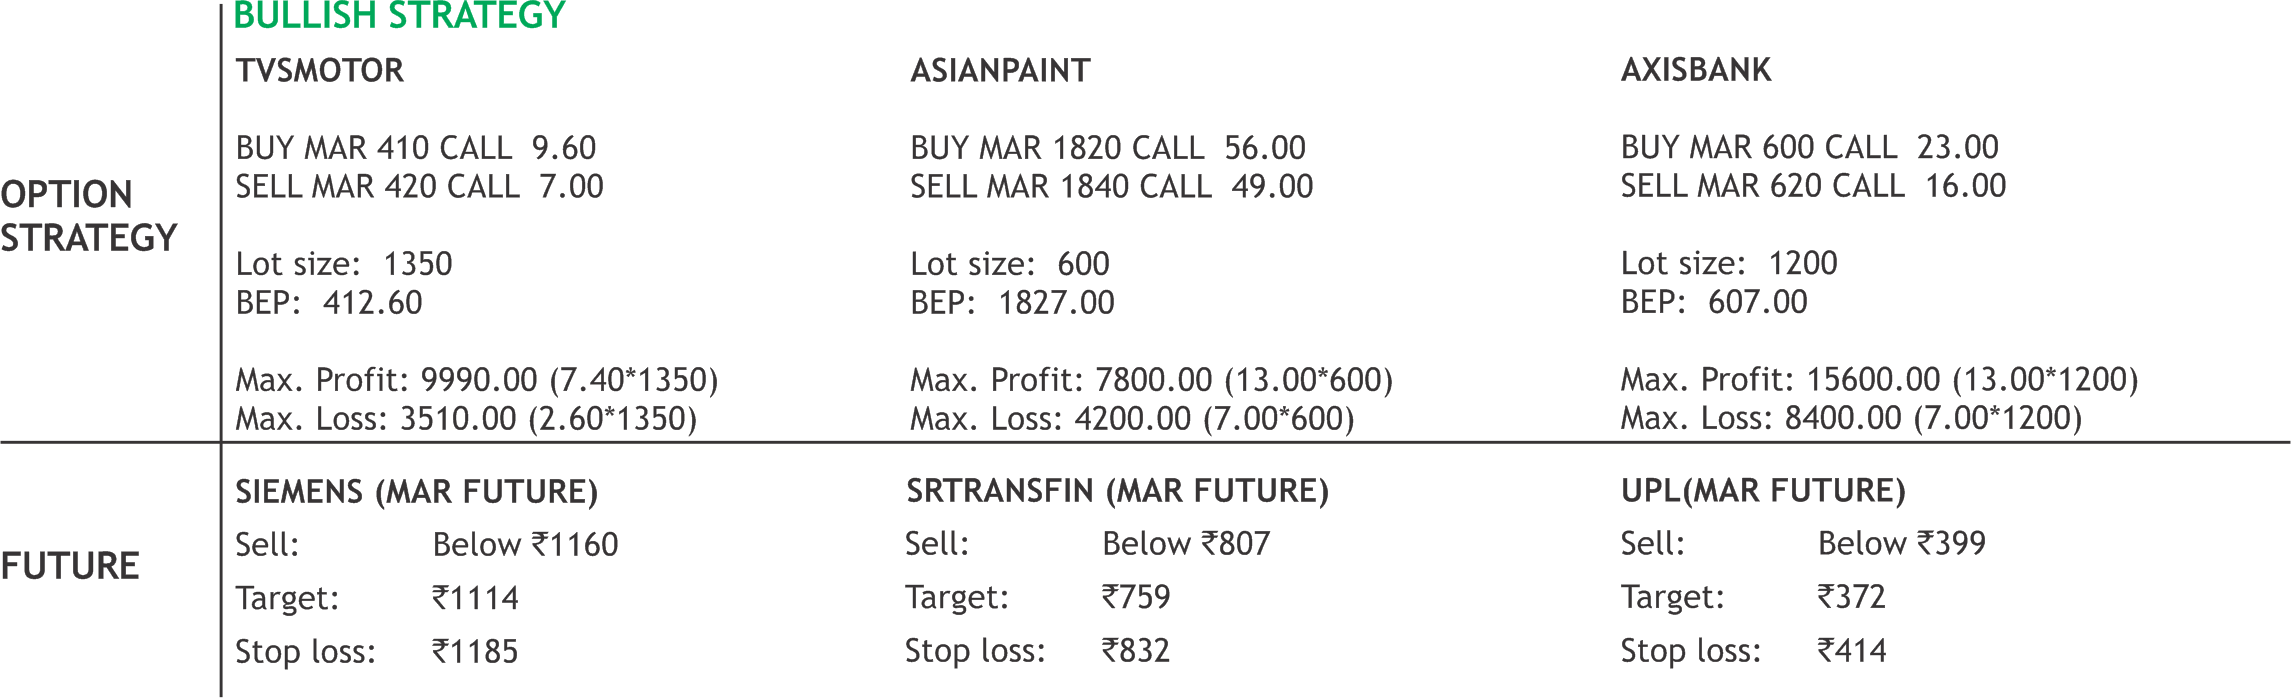
| 17-Mar-20 | TVS Motor Company | Interim Dividend - Rs.1.40Per Share |
| 18-Mar-20 | Torrent Pharmaceuticals | Interim Dividend- Rs.32.00 Per Share |
| 19-Mar-20 | Amara Raja Batteries | Interim Dividend - Rs 5 Per Share |
| 19-Mar-20 | Coal India | Interim Dividend - Rs.12.00Per Share |
| 19-Mar-20 | Ashok Leyland | Interim Dividend - Rs.0.50Per Share |
| 19-Mar-20 | Cipla | Interim Dividend – Rs.4.00 Per Share |
| 19-Mar-20 | Tata Consultancy Services | Interim Dividend - Rs 12 Per Share |
| 23-Mar-20 | Oil & Natural Gas Corp | Interim Dividend |
| 23-Mar-20 | Indraprastha Gas | Interim Dividend |
| 23-Mar-20 | Muthoot Finance | Interim Dividend |
| 24-Mar-20 | Piramal Enterprises | Interim Dividend |
| 26-Mar-20 | Sun TV Network | Interim Dividend - Rs.12.50 Per Share |
| 27-Mar-20 | 27-Mar-20 | Dividend - Rs 14 Per Share |
4


5
HINDUSTAN UNILEVER LIMITED
CMP: 2059.35
Target Price: 2335
Upside: 13%
| Face Value (Rs.) | 1.00 |
| 52 Week High/Low | 2307.20/1649.70 |
| M.Cap (Rs. in Cr.) | 445812.44 |
| EPS (Rs.) | 31.92 |
| P/E Ratio (times) | 64.52 |
| P/B Ratio (times) | 56.83 |
| Dividend Yield (%) | 1.07 |
| Stock Exchange | BSE |
Investment Rationale
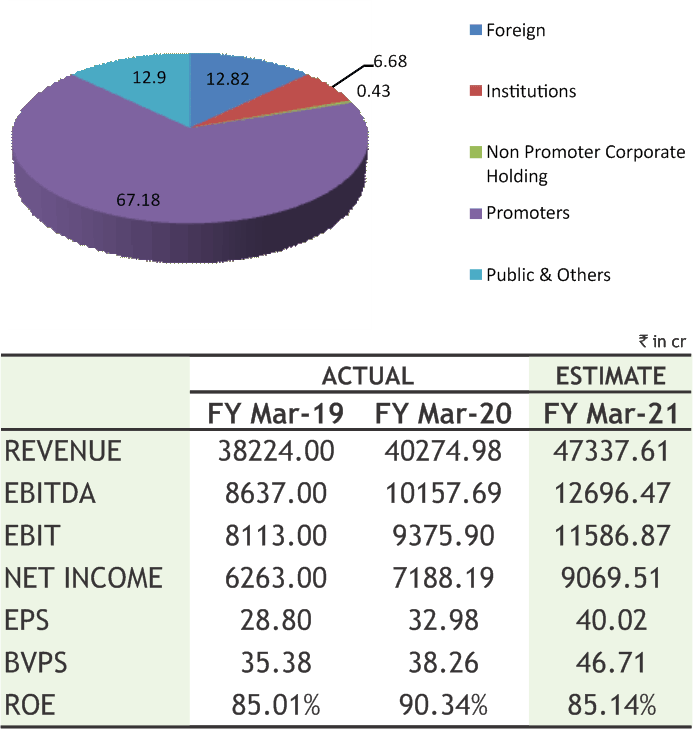
• Hindustan Unilever Limited (HUL) is engaged in fastmoving consumer goods business comprising home, beauty and personal care, foods and refreshment.
• The company has reported that domestic consumer growth was at 4% with underlying volume growth at 5%. Margin expansion was driven by the company's saving agenda and leverage in other expenses. EBITDA stood at Rs 2445 crore in Q3 December 2019, rising 19% YoY.
• Its Home Care segment has continued its trajectory of good performance with double digit topline growth. Beauty & Personal Care segment was impacted by a higher than expected slowdown to market growth along with delayed winter season.
• Food & refreshment segment has delivered robust growth across categories. Beverages saw a broad based growth in the quarter. Coffee and tea both did well. December being a non seasonal quarter for ice-cream portfolio, the company has focused on expanding distribution reach and building innovation pipeline for the coming season. On the development front, it has also introduced Hellmann’s (Mayonnaise) brand in Kolkata during the quarter from its Unilever stable.
• GSK Consumer’s merger would raise its presence in foods (malted foods) category and could aid 5-7% accretion to earnings upon successful integration of the merger. Health Foods, which is a Rs. 7,700cr category in India has just 14% rural penetration, the company with vast distribution reach (3x direct distribution reach over GSK Consumer) has huge growth potential in this category.
• It has registered 3% growth in consolidated sales to Rs 10103 crore for the quarter ended Dec 2019 and 12.95% jump in consolidated net profit to Rs 1631 crore in Q3 December 2019 over Q3 December
December 2018.
2018, supported by improvement in margins and volume growth. Consolidated profit before tax surged 15.49% to Rs 2259 crore in Q3 December 2019 as against Rs 1956 crore reported in Q3 December 2018. Total income rose 2.97% to Rs 10208 crore year-on-year (YoY).
Risk
• Macro-economic risks such as growth slowdown
• Uncertainty in demand
Valuation
The company has delivered a resilient performance which is reflective of the strength of its brands, consistency in strategy and execution prowess. It has continued focus on innovation and market development has helped sustain underlying volume growth at a steady 5%. It has also delivered a healthy margin improvement. According to the management of the company, it will continue to invest behind brands and continue to manage business with agility by leveraging its data and tech capabilities. Thus, it is expected that the stock will see a price target of Rs.2335 in 8 to 10 months time frame on a target P/E of 58.34x and FY21 EPS of Rs.40.02.
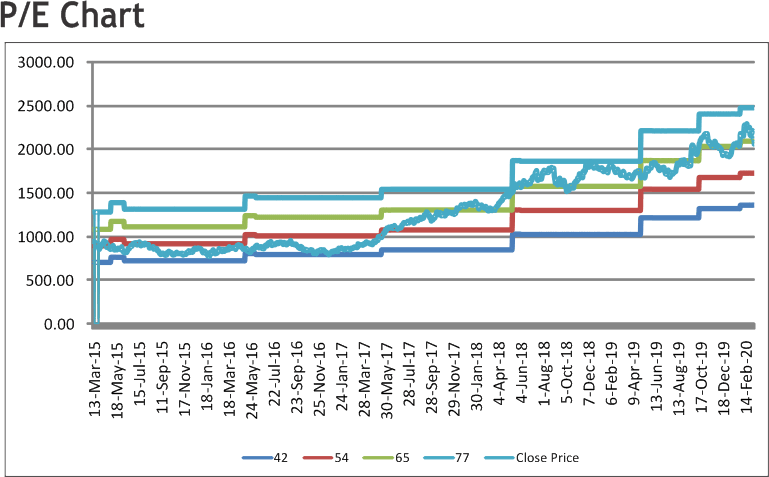
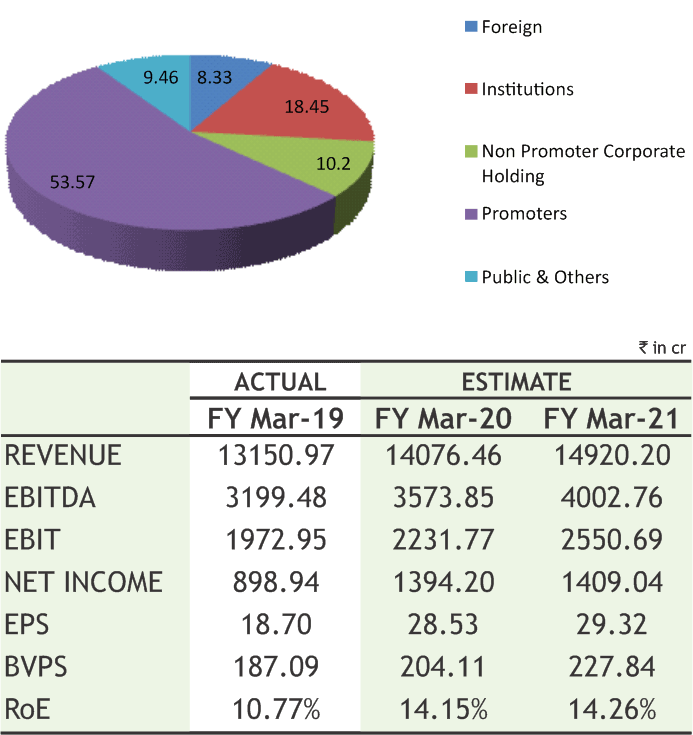
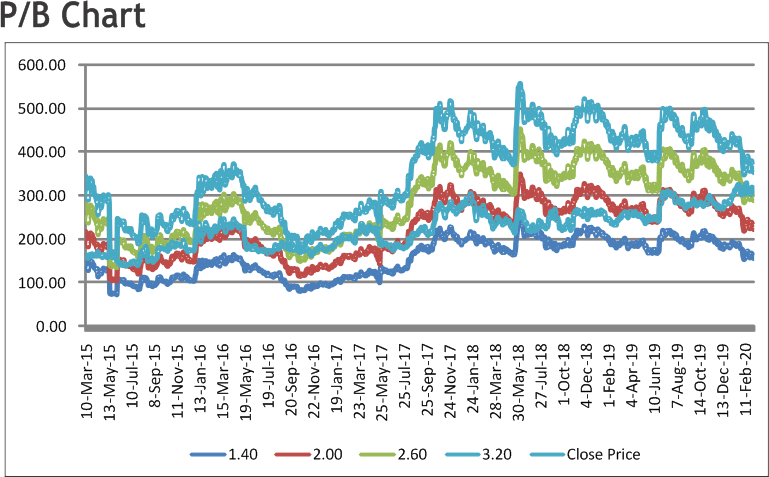
TORRENT POWER LIMITED
CMP: 290.00
Target Price: 346
Upside:19%
| Face Value (Rs.) | 10.00 |
| 52 Week High/Low | 332.50/235.15 |
| M.Cap (Rs. in Cr.) | 13933.08 |
| EPS (Rs.) | 30.65 |
| P/E Ratio (times) | 9.46 |
| P/B Ratio (times) | 1.44 |
| Dividend Yield (%) | 1.72 |
| Stock Exchange | BSE |
Investment Rationale
• The Company has an aggregate installed generation capacity of 3,879 MW comprising of 2,730 MW of gas-based capacity, 362 MW of coalbased capacity and 787 MW of renewable capacity. It has an additional 841 MW of renewable projects under construction and on completion of the said projects; the aggregate renewable capacity would be 1,452 MW and the aggregate total capacity would be over 4,540 MW.
• The Company distributes nearly 16.68 billion units to over 3.32 million customers in the cities of Ahmedabad, Gandhinagar, Surat and Dahej SEZ in Gujarat, Bhiwandi in Maharashtra and Agra in Utar Pradesh.
• It has further strengthened its leadership position in Distribution business and has been a) awarded the Distribution license for Dholera SIR area in Gujarat and b) selected as the Distribution Franchisee by MSEDCL for the Shil, Mumbra and Kalwa area in Thane District in Maharashtra. The company is widely considered to be the leading power distributor in India and in its licensed areas in Gujarat has the distinction of having the lowest AT&C losses and best reliability indices.
• During Dec quarter, the company has commissioned 176 MWs of wind capacity. Moreover, increase in contribution from gas-based power plants due to operationalisation of long term PPA for 278 MWs capacity from Q2 FY19-20 & higher merchant power sales and improved performance of licensed & franchised distribution businesses has contributed towards the growth during the quarter.
• Its consolidated net profit jumped 77% to Rs 419.39 crore in Q3 December 2019 as compared to Rs 236.96 crore posted in Q3 December 2018 driven by Increase in contribution from merchant power sales during the quarter; Higher profits from Renewables business; Improved performance of
licensed and franchised distribution businesses on the back of reduction in T&D losses, higher regulated ROE in licensed distribution business & favourable resolution of a regulatory dispute.
Risk
• Risk of regulatory interventions
• Macro-economic risks such as growth slowdown & uncertainty in demand
Valuation
The company is reducing its debt equity ratio with a focus on improvement of efficiency. Moreover, improvement in T&D, focus on green power project and commissioning of renewable power plants would give good strength to the company. Government’s policy push like emphasis on clean coal technologies, replacing old plants with new super critical plants, policy on automatic transfer of coal linkage, stricter environmental norms and emphasis on digitalization will go a long way in reenergizing the coal based power generation sector. Thus, it is expected that the stock will see a price target of Rs.346 in 8 to 10 months time frame on a target P/Bv of 1.52x and FY21 BVPS of Rs.227.84.
Source: Company Website Reuters Capitaline
Above calls are recommended with a time horizon of 8 to 10 months.
6
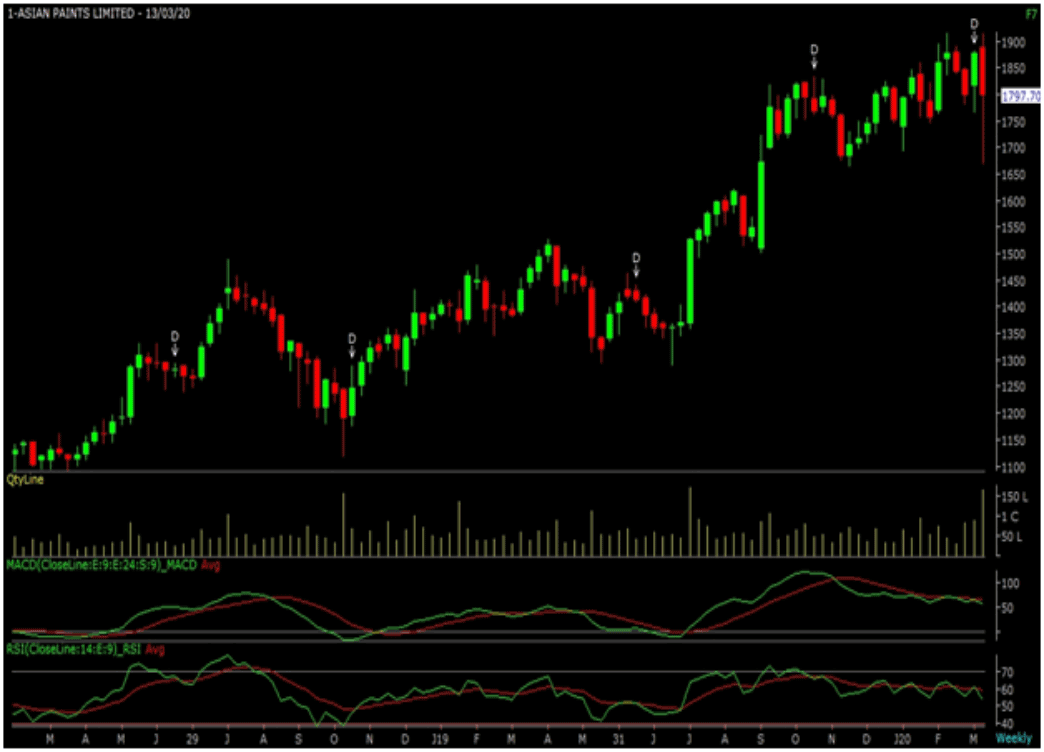
The stock closed at Rs 1797.70 on 13th March, 2020. It made a 52-week low at Rs 1291.25 on 09th July 2019 and a 52-week high of Rs. 1916.70 on 12th February, 2020. The 200 days Exponential Moving Average (DEMA) of the stock on the daily chart is currently at Rs 1688.43
As we can see on charts that stock is trading in higher highs and higher lows on weekly charts which is bullish in nature. Last week, stock has witnessed huge selling pressure from all time high, and found support around 1700 levels which is earlier support levels and has started moving higher so follow up buying can anticipate from current levels. Therefore, one can buy in the range of 1760-1775 levels for the upside target of 1900-1930 levels with SL below 1700.
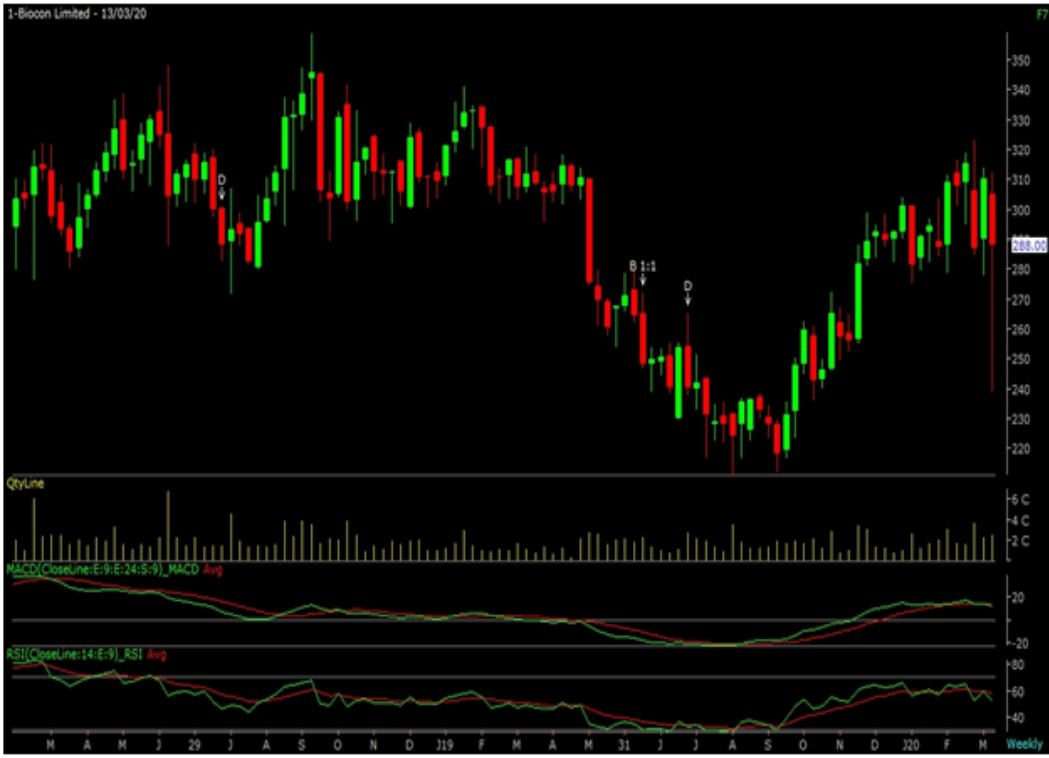
The stock closed at Rs 288.00 on 13th March 2020. It made a 52-week low of Rs 211.05 on 20th August 2019 and a 52-week high of Rs. 323.50 on 24th February, 2020. The 200 days Exponential Moving Average (DEMA) of the stock on the daily chart is currently at Rs 278.91
Short term and medium term bias are looking positive for the stock as it is trading in rising channel on weekly charts. Apart from this, it is also forming an “Inverted Head and Shoulder” pattern, which is considered to be bullish. Due to correction in broader indices, stock witnessed huge selling but recovered sharply from lower levels along with decent buying interest so buying momentum can continue for coming days. Therefore, one can buy in the range of 278-283 levels for the upside target of 315-325 levels with SL below 250.
Disclaimer : The analyst and its affiliates companies make no representation or warranty in relation to the accuracy, completeness or reliability of the information contained in its research. The analysis contained in the analyst research is based on numerous assumptions. Different assumptions could result in materially different results.
The analyst not any of its affiliated companies not any of their, members, directors, employees or agents accepts any liability for any loss or damage arising out of the use of all or any part of the analysis research.
SOURCE: CAPITAL LINE
Charts by Spider Software India Ltd
Above calls are recommended with a time horizon of 1-2 months
7
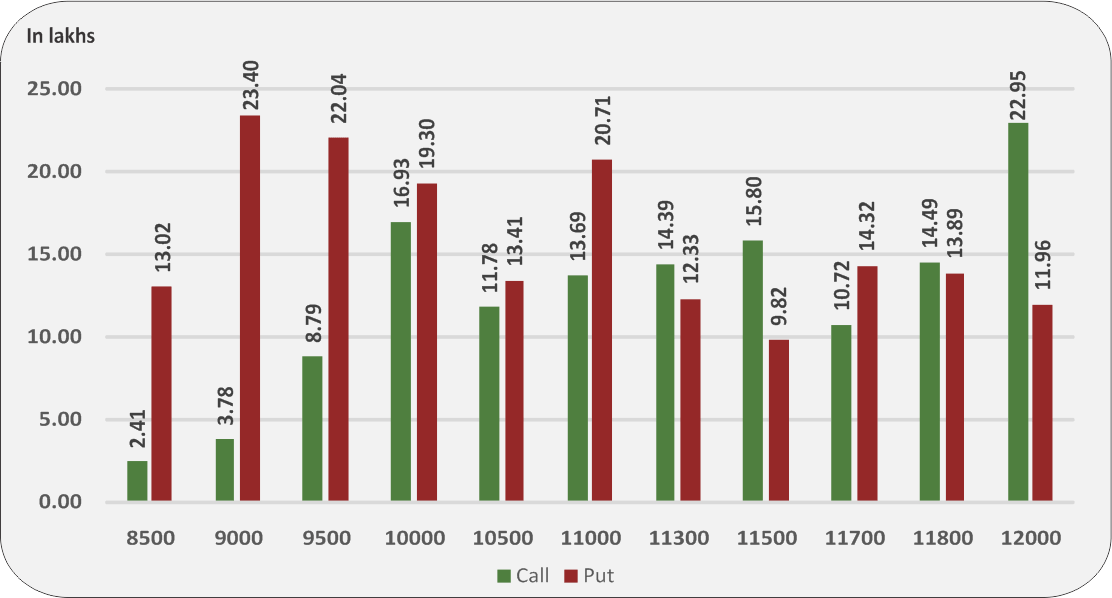
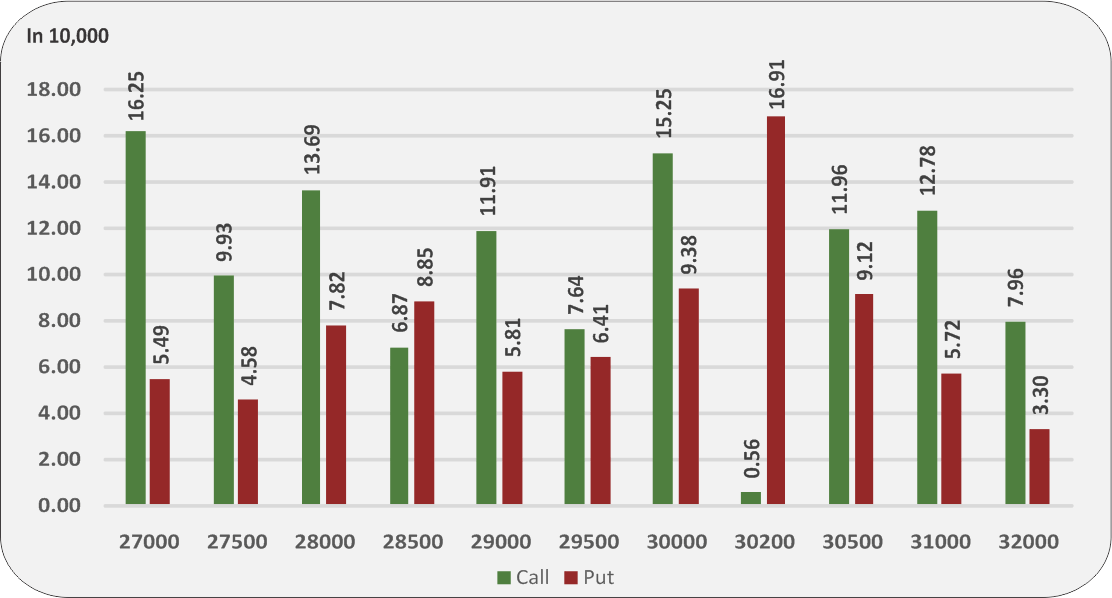
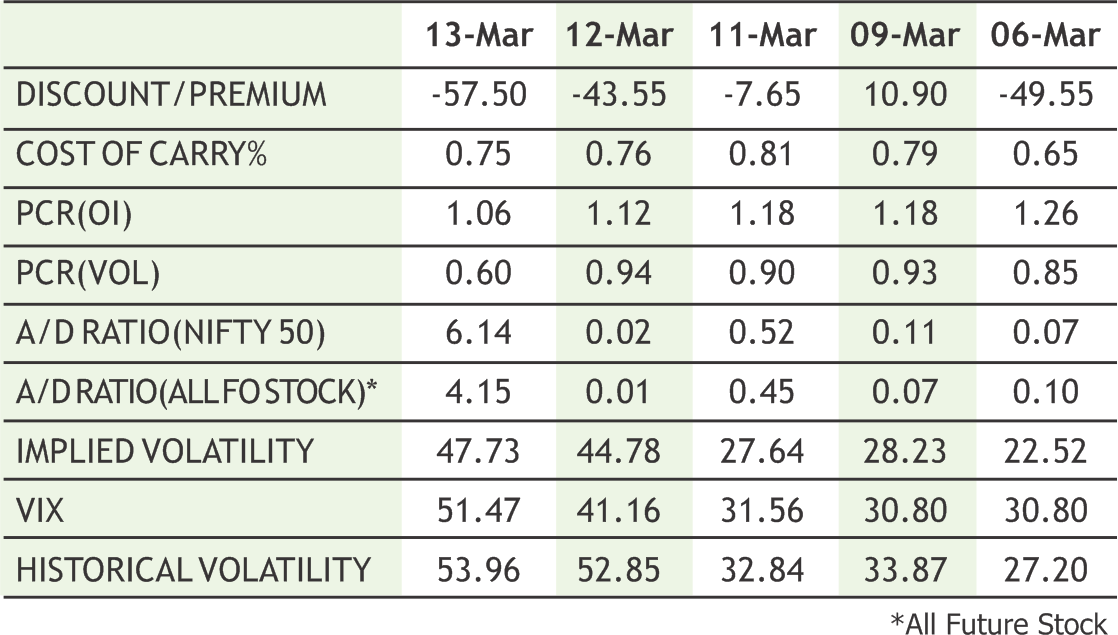
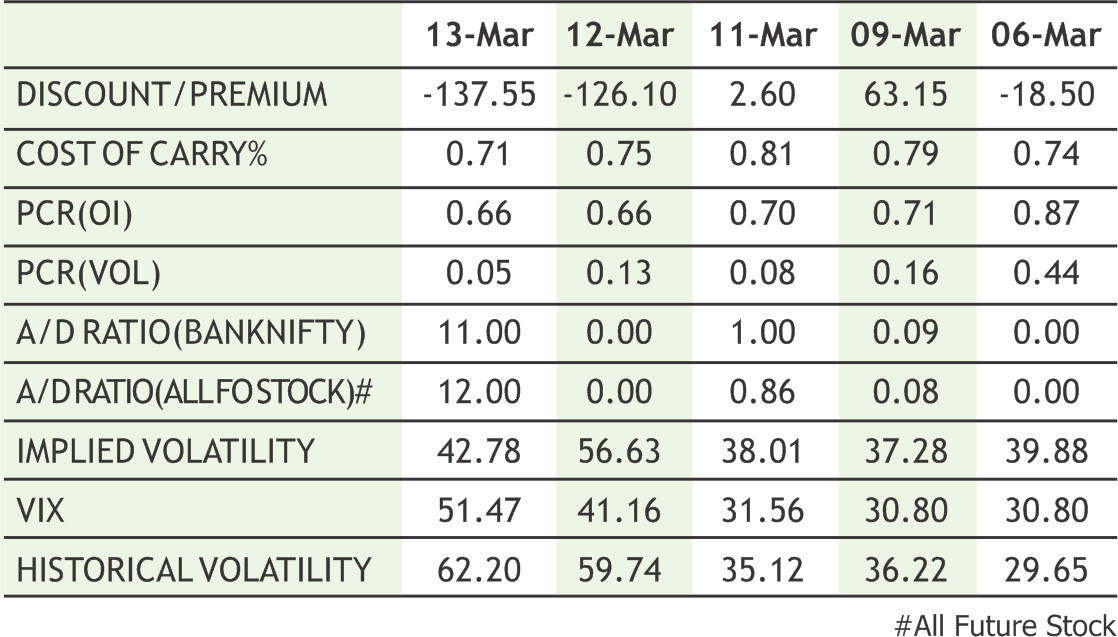
Taking cues from weak global markets, Indian markets hammered down badly in the week gone by with Nifty and bank nifty hitting their lower circuit for the first time after 2008 due to concerns on account of corona virus. However on the other hand both the indices also witnessed their record intraday recovery as well with Nifty once again reclaiming 9950 levels after testing lows of 8530.Despite sharp recovery from lower levels Nifty and bank nifty ended the week with loss of more than 9%. India VIX also rose to the highest level since 2008 global financial crisis as fear gripped markets worldwide after COVID-19 was declared a ‘pandemic’. In coming week it is expected that volatility is likely to grip the Indian markets and once again we may witness huge swings into the index. From technical front, both the indices however closed well below their 200 days exponential moving averages and likely to remain under pressure as oscillators are suggesting limited upside into the prices. The Implied Volatility (IV) of calls closed at 47.73% while that for put options closed at 52.50%. The Nifty VIX for the week closed at 51.47% and is expected to remain volatile. PCR OI for the week closed at 1.06

8
|
|


|
|
**The highest call open interest acts as resistance and highest put open interest acts as support.
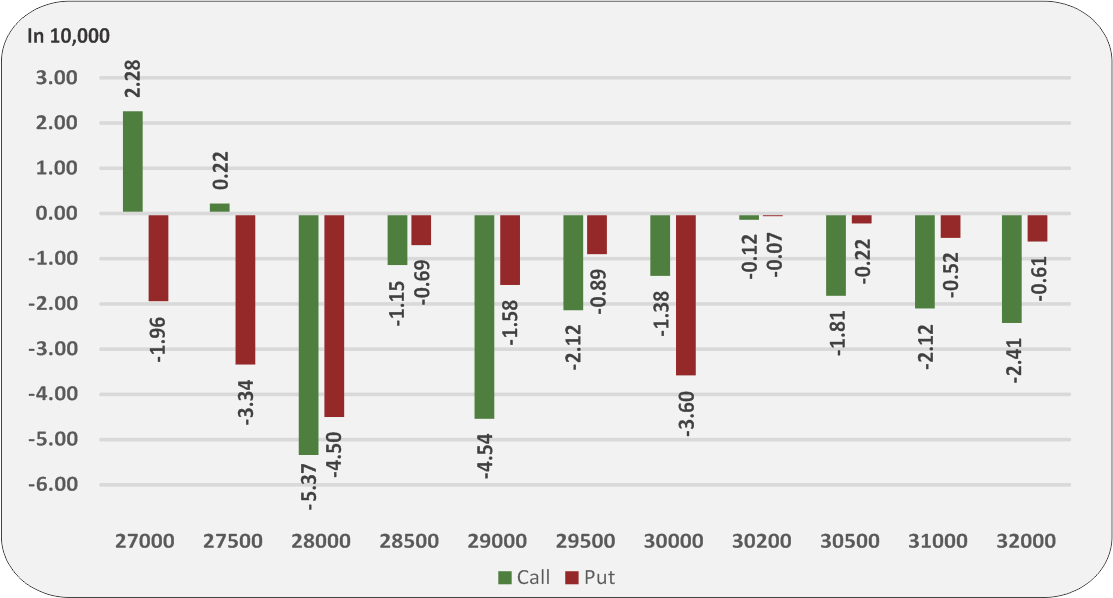
# Price rise with rise in open interest suggests long buildup | Price fall with rise in open interest suggests short buildup
# Price fall with fall in open interest suggests long unwinding | Price rise with fall in open interest suggests short covering
9
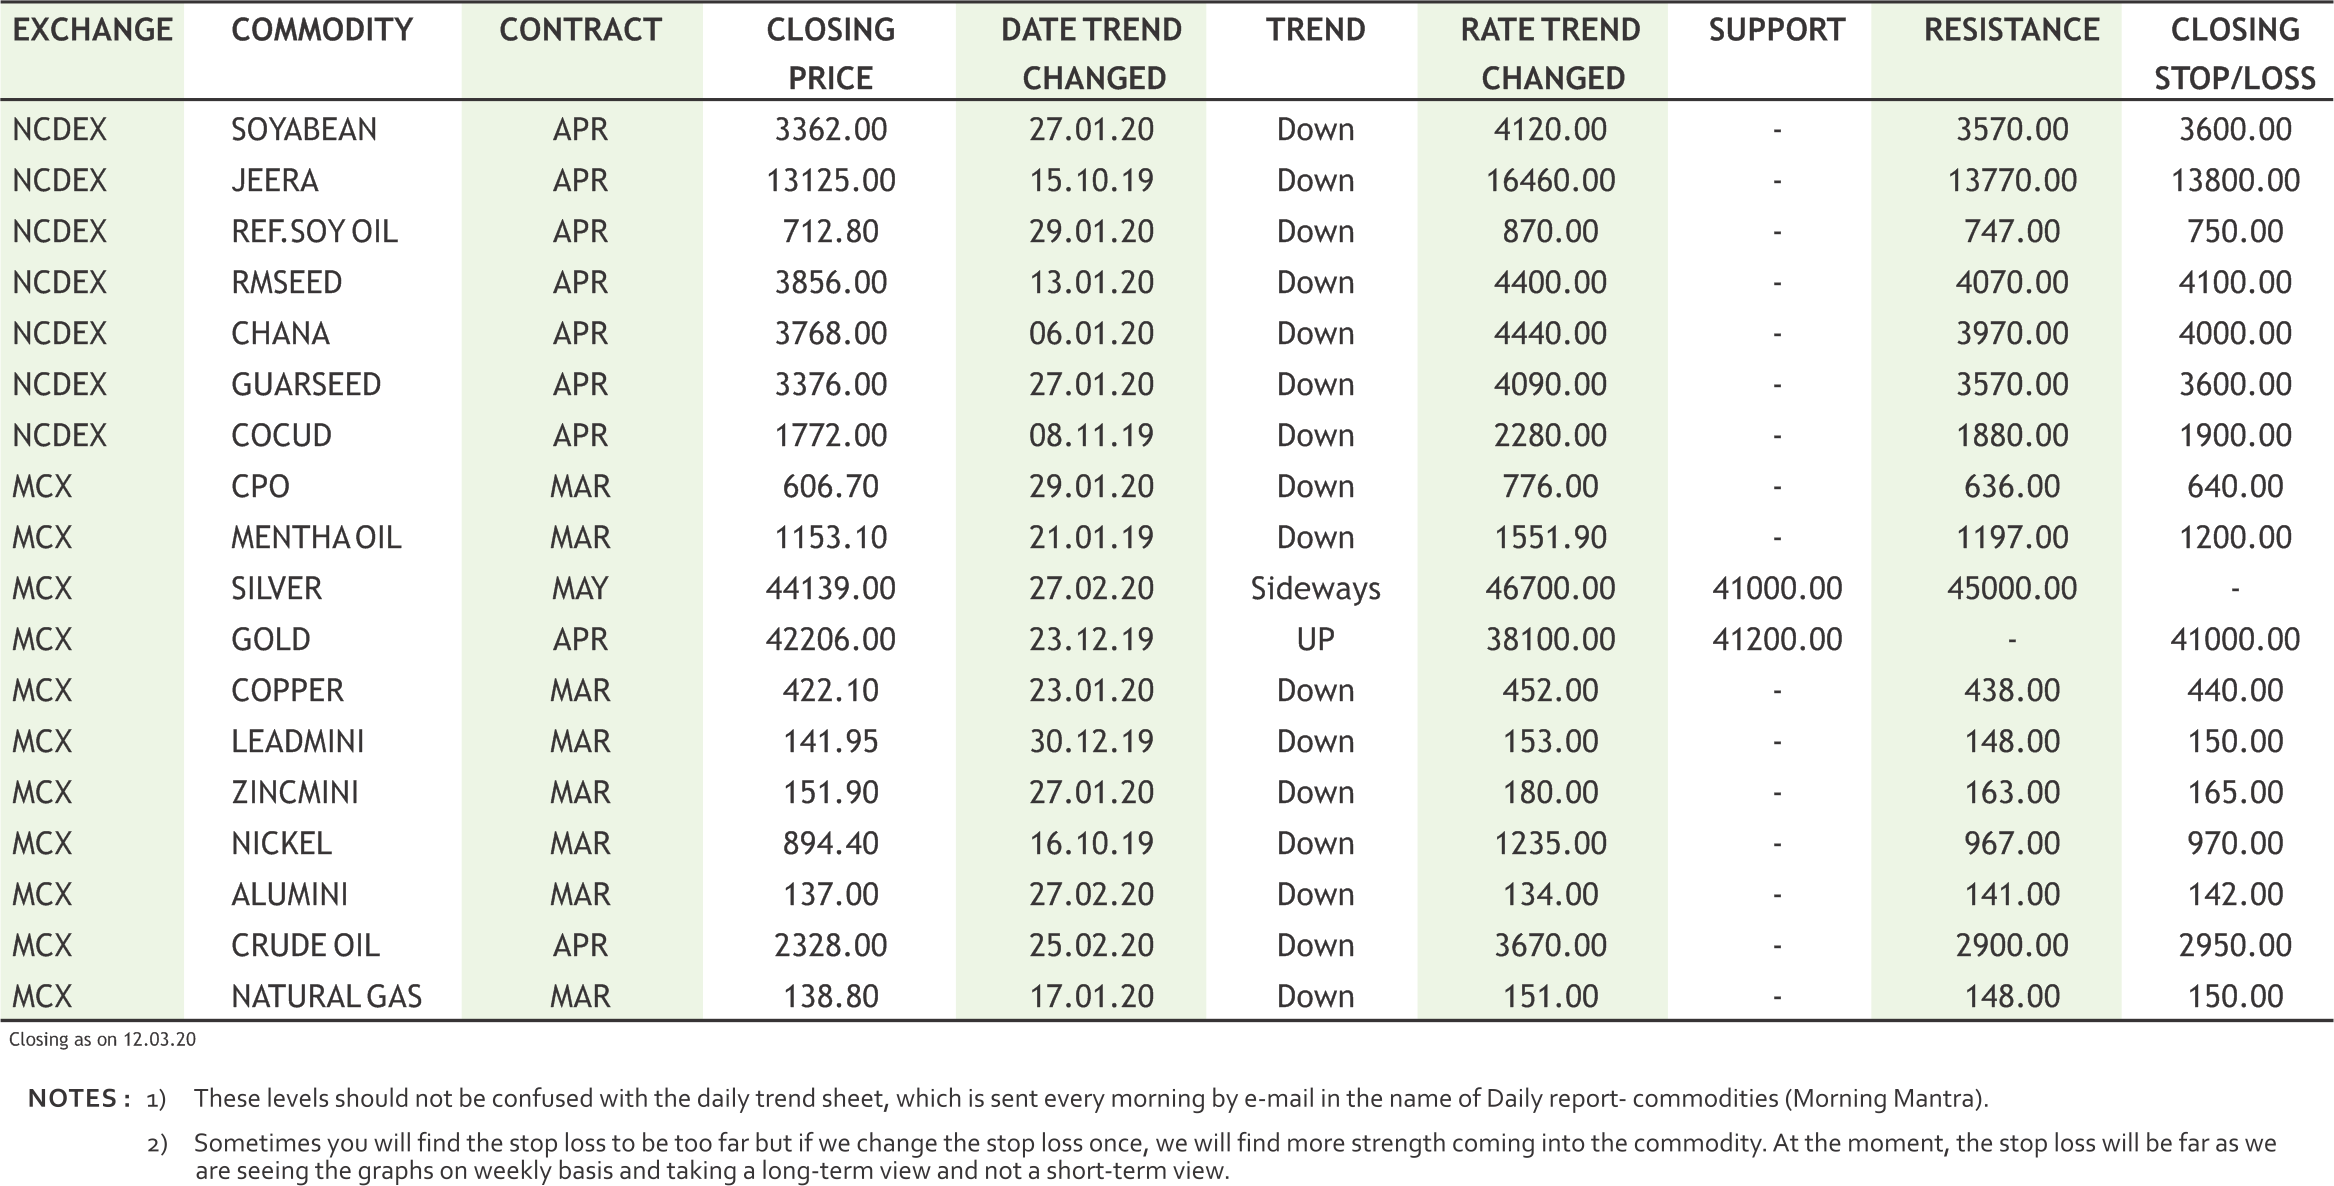
The overall trend of turmeric futures (April) is down & it shall continue till 5300 owing to expectations of higher output. Production is seen rising to a three-year high of 585,000 tn in 2019-20 (Jul-Jun) from 552,500 tn last year, according to trade estimates. The arrivals pressure is increasing due to a rise in incoming of new crops. About 2,100 bags of new turmeric and 1,400 bags of old turmeric are being brought for sale & the traders are also quoting lower prices. At the Erode Turmeric Merchants Salesyard, new finger turmeric was sold at ₹5,514-7,111 a quintal and root variety at ₹4,819-6,139.Jeera futures (April) may witness a consolidation in the range of 13000-13500 & the upside may remain capped. The sentiments are bearish due to weak demand from domestic stockists amid expectations of a rise in output. Production may rise 29% to 535,500 tn in 2019-20 (Oct-Sep) because of higher acreage in Rajasthan and Gujarat, the two largest producers, according to a survey by the Federation of Indian Spice Stakeholders. Coriander futures (April) is expected to trade with a downside bias in the range of 5400-6000 levels. The market participants on the spot are holding a bearish view as higher output is expected. The output is likely to rise 55% to 383,060 tn in 2019-20 (Oct-Sep) because of sufficient availability of water and conducive weather conditions. Cardamom futures (April) may plunge towards 2275-2200 levels. The market participants are citing that due the end of the current fiscal the sellers are disposing their accumulated stock. The stockists are anticipating a further reduction in prices and this is also a reason for the surge in arrivals.
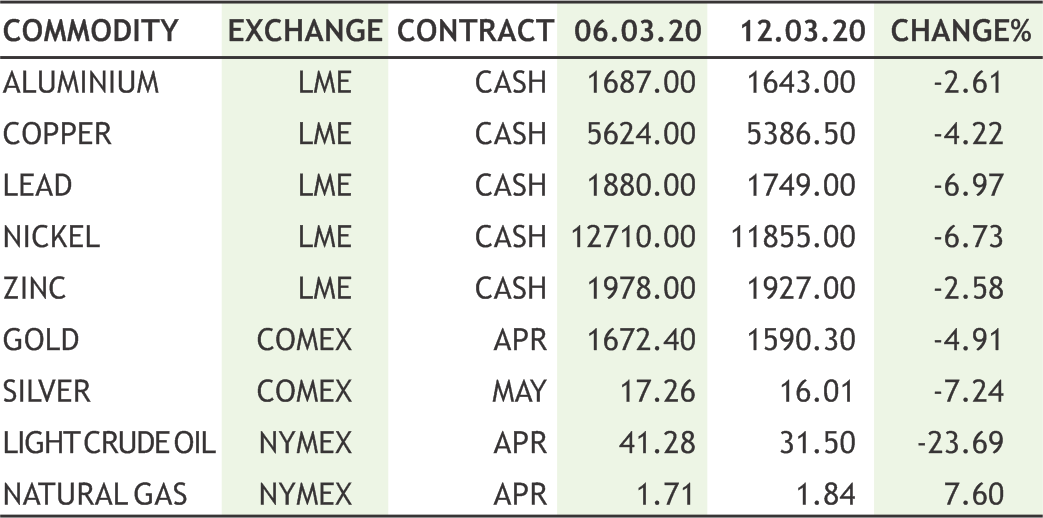
In Bullion counter, yellow metal may remain on weaker side as gold is likely to move towards 41000 while taking resistance near 43200 and silver can test 41500 while facing resistance near 45000. Gold prices posted their biggest weekly drop in nearly seven years, as a rout in global equities forced investors to cover margin calls. Gold sliver ratio hovered above 101 as silver underperformed by wide margin. The gold silver ratio spiked up dramatically in recent weeks following a hasty Fed decision to lower interest rates in light of the spreading coronavirus. President Trump has vowed to introduce measures aimed at staving off recession in the U.S., including a 0% payroll tax rate proposal. The Federal Reserve moved to stem a market meltdown with offers of $1.5 trillion in short-term loans that could point to more aggressive action from the central bank in coming days to stimulate the economy. Gold traders will be watching closely to see whether still more central banks follow the Federal Reserve in cutting interest rates because of the coronavirus. Japan announced a second package of measures worth about $4 billion in spending to cope with the fallout to the economy of the outbreak, focusing on support for small and mid-sized firms. The euro zone economy grew at a snail's pace in the fourth quarter, figures confirmed, as investments and consumer and government spending just offset the impact of a sharp rise in imports. Bank of England slashed interest rates by 50bps as an emergency rate cut just like Fed did in the past.
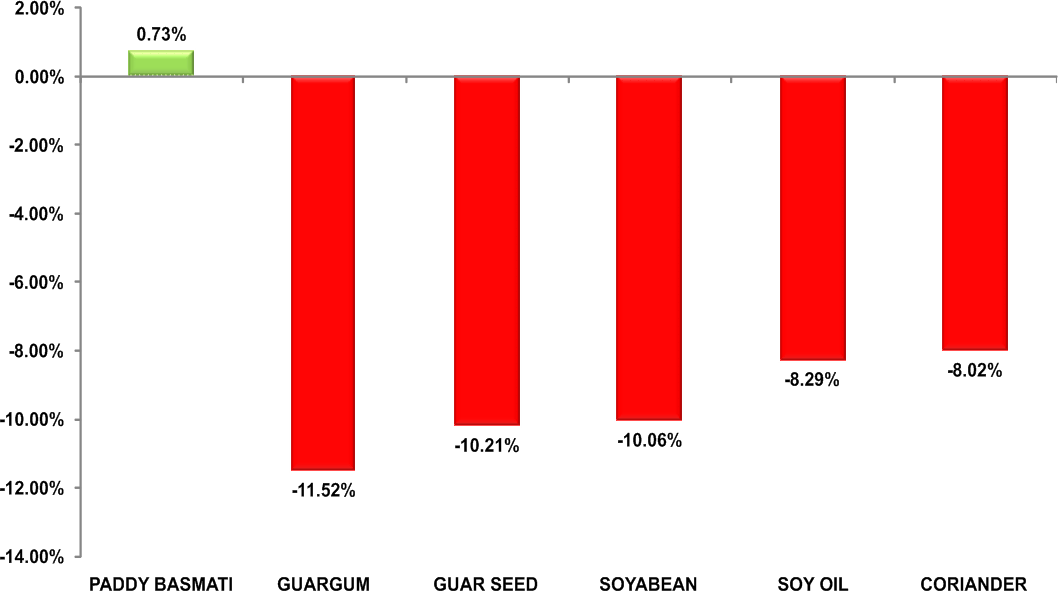
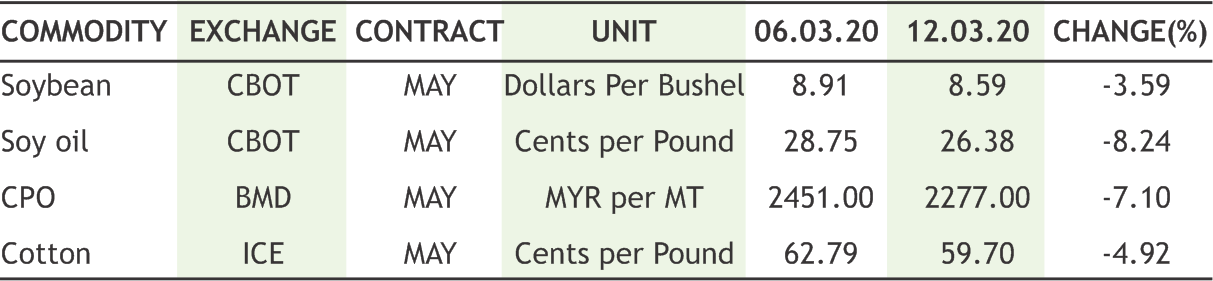
Soybean futures (April) may go down further towards 3200-3100 levels tracking negative sentiments prevailing on CBOT & sell off in overseas market. Moreover, the spread of coronavirus has also hit soymeal exports from India. The selling may intensify in mustard futures (April) owing to increase in the pace of harvesting mustard, and this factor may drag the counter to 3750-3700 levels. Moreover, it is reported that NAFED is offloading old mustard stocks and higher fresh supplies are likely to keep the contracts bearish on the bourse in the coming days. Looking at the panic in the global markets due to outbreak of COVID-19 & market participants increasing their bearish positions in edible oils, soy oil futures (April) may continue to slide to 710-690. With social distancing, food service industry consumption for vegetable oils will be negatively affected. Global recession will also reduce consumption when people eat out less. The possibilities are higher that CPO futures (April) may revisit its previous low of 580 & may even test 570 levels. In the international market on Bursa Malaysia Derivatives, palm oil has retraced by 15% from its high owing to worsening panic over the coronavirus pandemic drove heavy selling across assets.The rising concerns sparked by the virus outbreak outweighed a drop in February stockpiles and a pickup in exports ahead of the Muslim holy month of Ramadan. Markets are worried that the pandemic will suppress palm oil consumption and crude oil prices. Some edible oils and biodiesel buyers have been waiting for a floor on palm oil prices over the past few weeks, but the volatility in crude oil has recently impacted demand for the second half the year.
Crude oil prices may continue to remain under selling pressure as worries about demand for fuel being sapped by the global coronavirus outbreak. Recently prices hovers at four years low amid weak global demand and an escalation in the price war between Russia and Saudi Arabia. Crude oil may further dip towards 2100 while taking resistance near 2800. A flood of lowpriced oil into the market from Saudi Arabia and the United Arab Emirates is intensifying the pressure on prices after the collapse agreement with Russia recently. President Trump’s announcement recently that will ban all flights from Europe just added to travel restrictions across the globe and to reduce further the demand for oil. The situation in transportation and travelling is getting nasty around the world as more and more countries are closing the borders and airlines are cancelling flights across the globe. OPEC and IEA have slashed the demand expectations, with demand growth expected to be flat or negative for the rest of the year. Meanwhile growing tensions in Middle East can cap the downside. The Pentagon confirmed that the US had struck five Iran-backed militia weapons stores in Iraq, a day after a rocket attack killed two American personnel and a British soldier. Natural gas can remain on volatile path as it can move in range of 130-150. The weather is expected to be warmer than normal on the east coast of the US for the next 2-weeks and much colder than normal throughout most of the west coast. Meanwhile stocks were 796 Bcf higher than last year at this time, with most of the change in the east coast on the Midwest.
Cotton futures (March) may continue to hold on to the support near 18000 levels, while the upside may get extended towards 18500-18700 levels. The global cotton outlook remains bleak; Indian cotton has good prospects in Vietnam, Turkey and Far Eastern Countries. The domestic cotton prices have not fallen as sharply as ICE Futures because there are other markets available to India that can be explored.The coronavirus outbreak will not have much impact on exports of cotton, Cotton Association of India (CAI) has said projecting the overall shipments of the commodity for this season at 42 lakh bales. The pick-up in demand from other markets like Bangladesh will keep the exports at the same level as last year. In the international market, ICE cotton futures (May) may trade sideways in the range of 57-62 cents per pound. On the global front, the mills are on the sidelines despite the emergence of some positive signs on the economic front. The U.S net sales of cotton hitting a fresh marketing year high is showing that business of the natural fibre is started showing improvement but the bulk buyers are still adopting wait-and-see mood. Mentha oil futures (March) is expected to trade sideways to down in the range of 1140-1200 levels. The sentiments are weak due to expectations of higher acreage this season amid weak demand from domestic stockists and the pharmaceutical industry. Seasonal demand for the spice oil is declining after the winter season. Chana futures (April) is likely to trade in a broader range of 3600-3850 levels. NAFED's stock liquidation in selected states, along with availability of new domestic crop may continue to pressurize the prices.
Base metal counter may remain on weaker path amid fast spreading coronavirus deepened worries about a global recession and spread turmoil across financial markets. But short covering at lower levels cannot be denied. Copper may test 410 levels while facing resistance near 430. Copper output at Codelco, the world's top copper miner, plunged 6.8% in January from a year earlier while production at BHP. AX Escondida, the world's largest copper mine, rose 10%. Copper smelting declined during February in China and Europe as the coronavirus outbreak worsened, according to an index based on satellite surveillance of copper plants. China's unwrought copper imports rose 7.2% year-on-year in the first two months of 2020, customs data showed recently as a restocking drive before Lunar New Year offset the impact of the coronavirus. Meanwhile, lead may remain in red as it can test 138 while taking resistance near 147 levels. Zinc may remain on weak bias as it can test 147 levels while facing resistance near 160. LME zinc has the largest net speculative short position on the exchange at 34% of open interest, the highest since November 2015. Automakers in China are calling on the government to help after industry-wide sales plunged 79% in February to mark their biggest ever monthly decline, with demand declined by the coronavirus outbreak. Nickel prices can slip lower towards 860 while taking resistance near 935. LME inventories of nickel climbed to 236,106 tonnes, the highest since September 2018, having more than tripled since early December last year. Aluminium prices can dip towards 134 while taking resistance near 140.
10
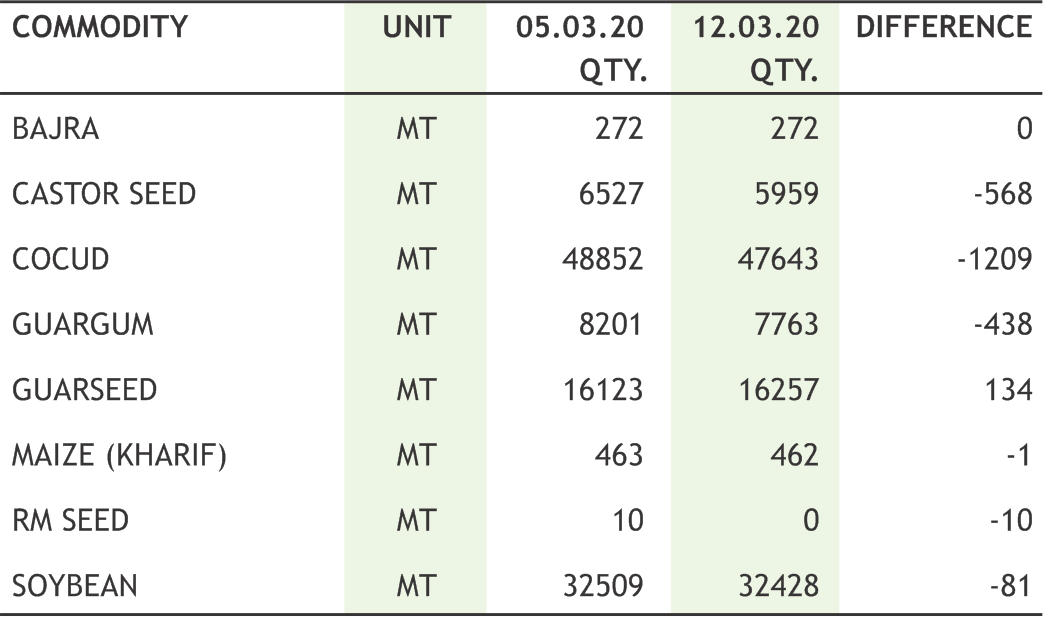
|

CRUDE MCX (APR) contract closed at Rs. 2321.00 on 12th Mar’2020. The contract made its high of Rs. 4186.00 on 21st Jan’2020 and a low of Rs. 2241.00 on 09th Mar’2020. The 18-day Exponential Moving Average of the commodity is currently at Rs. 3116.00. On the daily chart, the commodity has Relative Strength Index (14-day) value of 24.028.
One can buy near Rs. 2400 for a target of Rs. 2900 with the stop loss of Rs. 2150.
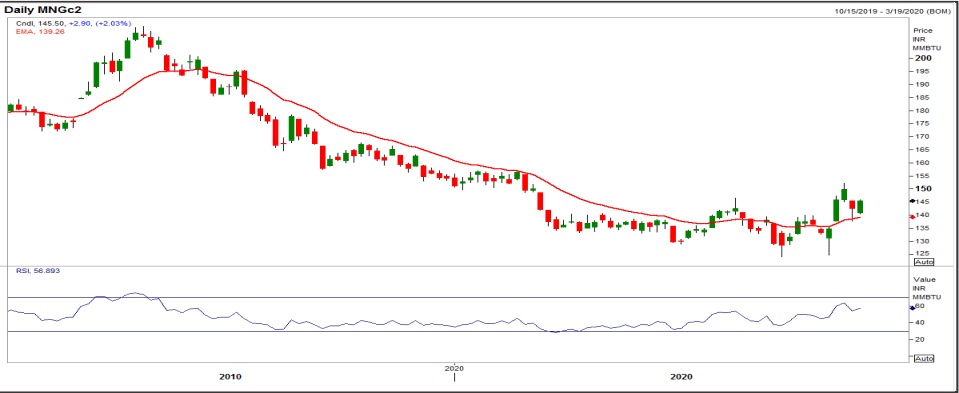
NATURAL GAS MCX (MAR) contract closed at Rs. 133.00 on 12th Mar’2020. The contract made its high of Rs. 158.70 on 27th Dec’19 and a low of Rs. 119.60 on 28th Feb’2020. The 18-day Exponential Moving Average of the commodity is currently at Rs. 136.40. On the daily chart, the commodity has Relative Strength Index (14-day) value of 55.901.
One can buy above Rs. 135 for a target of Rs. 165 with the stop loss of Rs. 120.
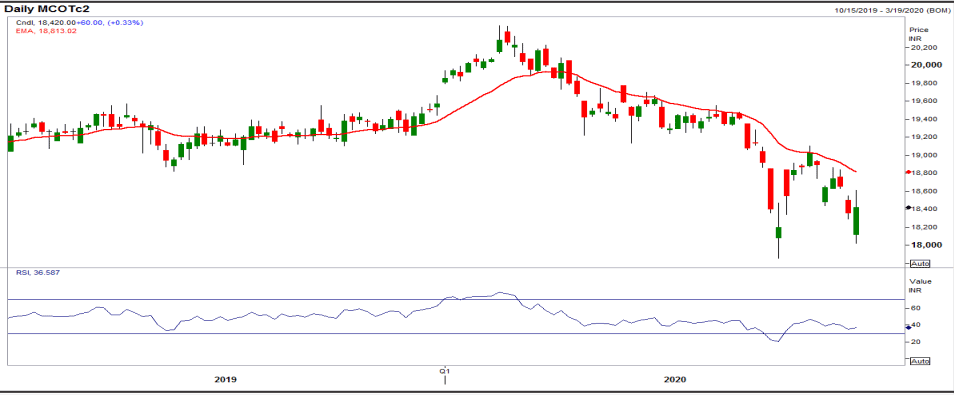
COTTON MCX (MAR) contract was closed at Rs. 18020.00 on 12th Mar’2020. The contract made its high of Rs. 20650.00 on 13th Jan’2020 and a low of Rs. 17760.00 on 13th Mar’2020. The 18-day Exponential Moving Average of the commodity is currently at Rs. 18653. On the daily chart, the commodity has Relative Strength Index (14-day) value of 31.898.
One can buy near Rs. 18000 for a target of Rs. 18600 with the stop loss of Rs 17700.
11
Ÿ Sebi could soon introduce the concept of "one commodity one exchange" to increase liquidity and deepen participation of the commodity segments of stock exchanges.
Ÿ Indian sugar mills have so far contracted to export 3.5 million tonnes of sugar the in 2019/20 marketing year, mainly to Iran, Malaysia, Somalia and Sri Lanka.
Ÿ NAFED has been buying Chana in Andhra Pradesh and Karnataka under Price Support Scheme (PSS) during the 2020 Rabi season.
Ÿ The coronavirus outbreak will not have much impact on exports of cotton, Cotton Association of India (CAI) has said projecting the overall shipments of the commodity for this season at 42 lakh bales.
Ÿ Malaysia's total palm oil stocks fell 4.2% to 1.68 million tonnes in February from 1.76 million tonnes in January. - Malaysian Palm Oil Board
Ÿ WHO has described the new coronavirus as a pandemic, adding that Italy and Iran were now on the frontline of the disease and other countries would soon join them.
Ÿ The European Union will impose duties on imports of Chinese steel road wheels for the next five years after concluding that they are sold at unfairly low prices.
Ÿ CME Group Inc. will close its trading floor as exchanges alter their operations to control the spread of the coronavirus.
Ÿ Global aluminium producers have increased their offers to Japanese buyers for the second quarter by as much as 27% from the current quarter.
The horror show in financial market, which we haven’t seen in decades, completely shook the entire world. We saw global market carnage and equities gave the worst performance since Wall Street's "Black Monday" crash of 1987. Nothing worked in front of the free fall of market, whether it is stimulus or rate cut by Fed or many Central banks. Commodities signaled this mayhem ahead of equities and worked as leading indicator. Fed took drastic action on Thursday as the stock market meltdown accelerated, pledging to inject as much as $1.5 trillion into U.S. market, nevertheless travel ban by US injected selling pressure. Dollar index stood tall as investors scrambled for the world's most liquid currency amid deepening panic about the coronavirus while the euro nursed losses after ECB disappointed by not cutting rates. Here in India, rupee hit the low above 74.5 on historic fall in equity market, which saw a free fall of more than 20% in NIfty. Bullion counter lost the tag of safe haven buying for the time being and noticed massive fall. Gold prices plunged more than $60 per ounce on Thursday as investors cashed out their long positions in a scramble to cover margins and losses on Wall Street amid the U.S. ban on most incoming European travelers. Silver too performed weak on bearish base metals and gold. In energy counter, crude saw massive fall of more than 30%, it was the deepest fall since 1991, when crude fell by 32% after airstrike by US on Kuwait. Crude made a low of $27.34 in NYMEX and Rs 2151 on MCX. Natural gas tried to maintain some upside on value buying from the lows. Oil fell a third day as the horror show for crude investors continued on Friday amid panic about evaporating demand from the coronavirus pandemic, with Brent set for its biggest weekly loss since 1991 and U.S. crude heading for its worst week since 2008. WTI is set to drop 25% last week, the most since the week of Dec. 19, 2008, when it fell 27% at the height of the Global Financial Crisis. As travel bans, cancelled events and other economic disruptions hit the base metals hard and they remained traded in weak territory. Additionally, a flood of cheap supply coming onto the market from Saudi Arabia and the United Arab Emirates compounded pressure on prices. The Gulf Arab producers are raising production as they go on the offensive in an oil price war with Russia. Agri commodities were not immune to this fall and most of them nosedived for the same reason. Oil seeds and edible oil prices dragged down on weak international market whereas limited export of spices kept the spices counter in lower trading zone. Guar saw many lower circuits on free fall in crude prices.
|

|
12
|
|
The ongoing spread of the new coronavirus has become one of the biggest threats to the global economy and financial markets. The virus, first detected in the Chinese city of Wuhan last December, has infected more than 110,000 people in at least 110 countries and territories globally, according to the World Health Organization. Of those infected, more than 4,000 people have died, according to WHO data.
Fears of the coronavirus impact on the global economy have rocked markets worldwide, plunging stock prices and bond yields. China, the mainland so far, has locked down cities, restricted movements of millions and suspended business operations — moves that will slow down the world’s second-largest economy and drag down the global economy along the way. Fear surrounding the impact on the global economy has hurt investor sentiment and brought down stock prices in major markets.
Downgrades in economic forecasts
The outbreak has led major institutions and banks to cut their forecasts for the global economy. In a March report, the OECD downgraded its 2020 growth forecasts for almost all economies. According to the report, China’s gross domestic product growth is expected to grow by 4.9% this year, slower than the earlier forecast of 5.7%. Meanwhile, the global economy is expected to grow by 2.4% in 2020 — down from the 2.9% projected earlier.
Slowdown in manufacturing & Services activity
The manufacturing sector in China has been hit hard by the virus outbreak. Factories in China are taking longer than expected to resume operations. The outbreak has also hit the country’s services industry as reduced consumer spending hurt retail stores, restaurants and aviation. This has hurt countries with close economic links to China, many of which are Asia Pacific economies such as Vietnam, Singapore and South Korea. It means that global manufacturing activity could remain subdued for longer. The services sector and factory manufacturing in the U.S., the world’s largest consumer market, also contracted in February, as customers held back from placing orders amid global economic uncertainty and the corona virus outbreak.
Oil prices plunging
A reduction in global economic activity has lowered the demand for oil, taking oil prices to multi-year lows. The recent disagreement on production cuts between OPEC and its allies caused the latest plunge in oil prices. The benchmark brent prices declined more than 50% this year so for.
Safe haven in Gold
Gold prices is benefitting most on increasing bets of an interest rate cut by global central banks to mitigate the economic impact from the fast-spreading corona virus outbreak. Gold prices in comex climbed more than 7.5% this year till date. The Fed had already slashed its benchmark interest rate in an emergency move last week. Markets are also pricing in a rate cut by the Bank of England on 26 March. The rate cut led to Treasury yields plunging, which is historically good for the price of gold. The 10-year yield fell its historic low of around 0.3% and the yellow metal could soon test $1,700 an ounce.
13
|
| 12th March | RBI announced a 6-month US dollar sell/buy swaps to provide liquidity to the foreign exchange market. |
| 12th March | ECB surprises markets by not cutting rates, but announces stimulus to fight coronavirus impact |
| 12th March | FOMC has said it would continue to offer $500bn of three-month loans and $500bn one-month loans on a weekly basis until April 13, on top of its ongoing programme of $175bn in overnight loans and $45bn in two-week loans twice per week. |
| 13th March | PBOC Pumps $79 Billion to Banks for Virus-Weakened Economy |
| 13th March | Indian rupee hits record low of Rs 74.50 per US dollar amid coronavirus scare |
| 13th March | BOJ said it would buy 200 billion yen ($1.90 billion) of Japanese government bonds. The central bank also said it would inject an additional 1.5 trillion yen in two-week lending. |
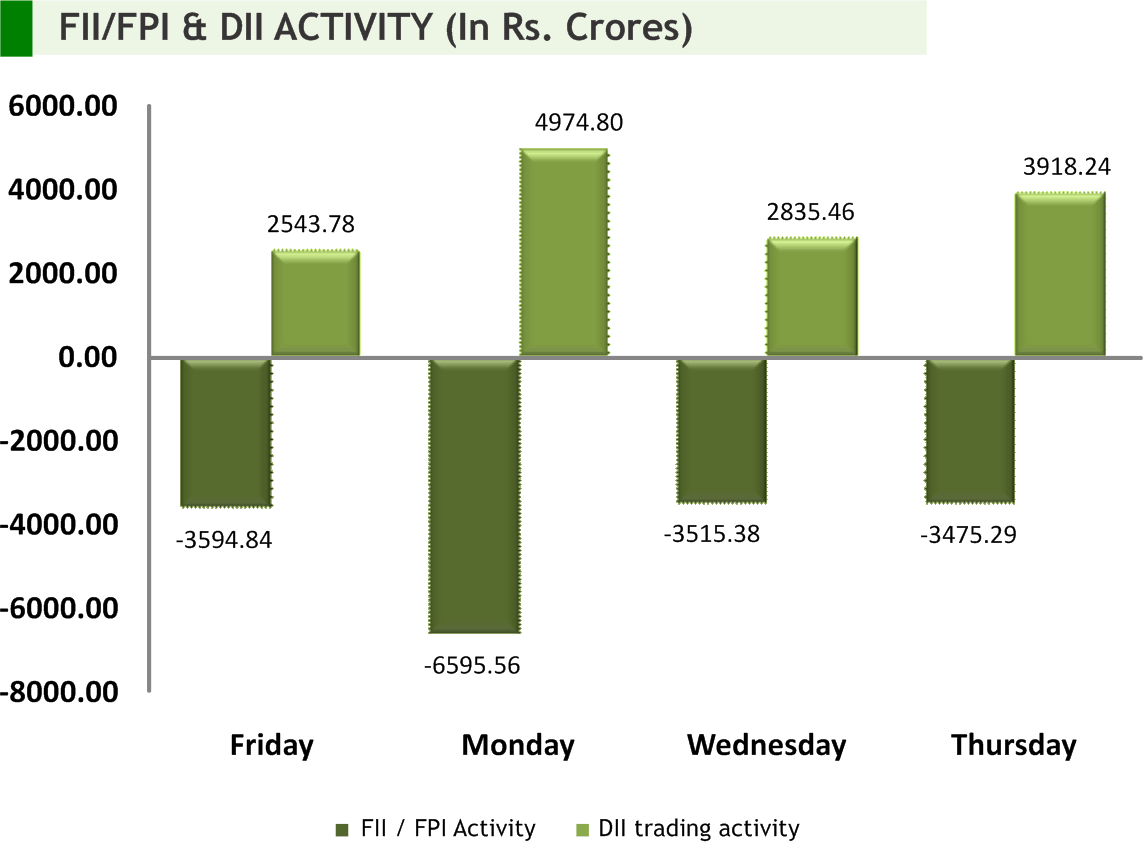
No matter what central bankers do to ease the flow of money at the time of outbreak, it's a great uncertainty that vividly chop the markets. Fear has escalated at a level where the emerging markets outflows now doubled to the tune of $41.7 bn as on March the 11 than GFC.Unfortunately run-on on the domestic currency which fell the weakest closing since October 2018 has triggered FIIs to reverse the flow in domestic debt market. Ideally lower the value of currency, lower the yield in bond investment for FIIs.Overnight Fed tried to ease the fall in global equities after announcing that they offer up at least $500bn in three-month loans, beginning immediately, with another $500bn of three-month loans on Friday in repo market although liquidity injection won't help much via repo when the stress is much wider in US corporate bond markets notably in high yield vertical. Additionally euro remains subdued after ECB has launched a package of measures to shield the eurozone from the economic havoc created by coronavirus, further loosening its already ultra-easy monetary policy with a planned €120bn of bond purchases and more cheap loans to banks. We are penciling-in the same streak of negative sentiment to continue unless any major breakthrough in virus containment or lower transmission rate surface to calm the markets.

|
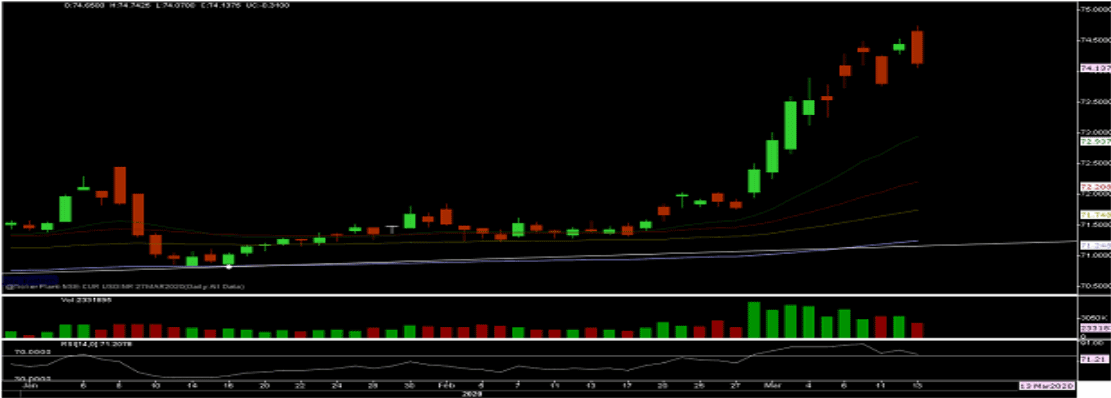
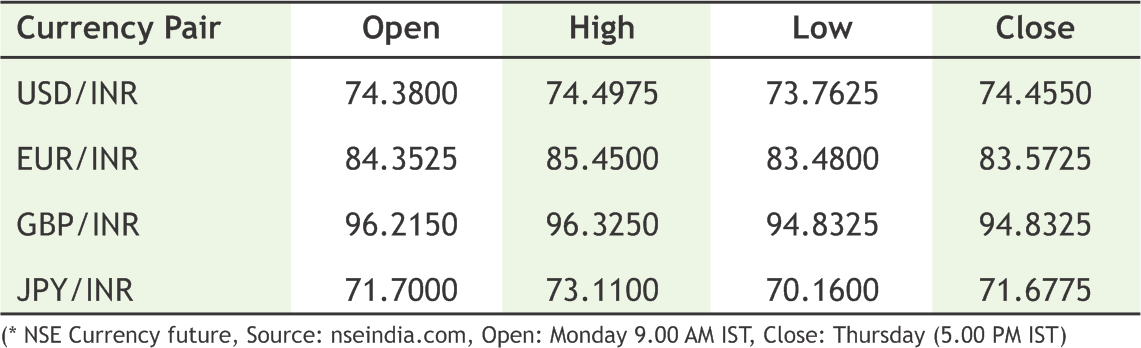
USD/INR (MAR) contract closed at 74.4475 on 12-Mar-2020. The contract made its high of 74.4975 on 09-Mar-2020 and a low of 73.7625 on 11-Mar-2020 (Weekly Basis). The 21-day Exponential Moving Average of the USD/INR is currently at 72.93
On the daily chart, the USD/INR has Relative Strength Index (14-day) value of 71.16. One can buy @ 73.80-73.90 for the target of 74.80 with the stop loss of

EUR/INR (MAR) contract closed 83.5725 on 12-Mar-2020. The contract made its high of 85.4500 on 09-Mar-2020 and a low of 83.4800 on 11-Mar-2020 (Weekly Basis). The 21-day Exponential Moving Average of the EUR/INR is currently at 81.07
On the daily chart, EUR/INR has Relative Strength Index (14-day) value of 65.53. One can buy at 82.50 for a target of 83.75 with the stop loss of 82.00.

GBP/INR (MAR) contract closed at 94.8325 on 12-Mar-2020. The contract made its high of 96.3250 on 12-Mar-2020 and a low of 94.8325 on 11-Mar-2020 (Weekly Basis). The 21-day Exponential Moving Average of the GBP/INR is currently at 94.03
On the daily chart, GBP/INR has Relative Strength Index (14-day) value of 47.26. One can buy at 93 for a target of 95 with the stop loss of 92.40.

JPY/INR (MAR) contract closed at 71.6775 on 12-Mar-2020. The contract made its high of 73.1100 on 09-Mar-2020 and a low of 70.1600 on 11-Mar-2020 (Weekly Basis). The 21-day Exponential Moving Average of the JPY/INR is currently at 68
On the daily chart, JPY/INR has Relative Strength Index (14-day) value of 60.6. One can buy at 69.5 for a target of 71.75 with the stop loss of 69.
14
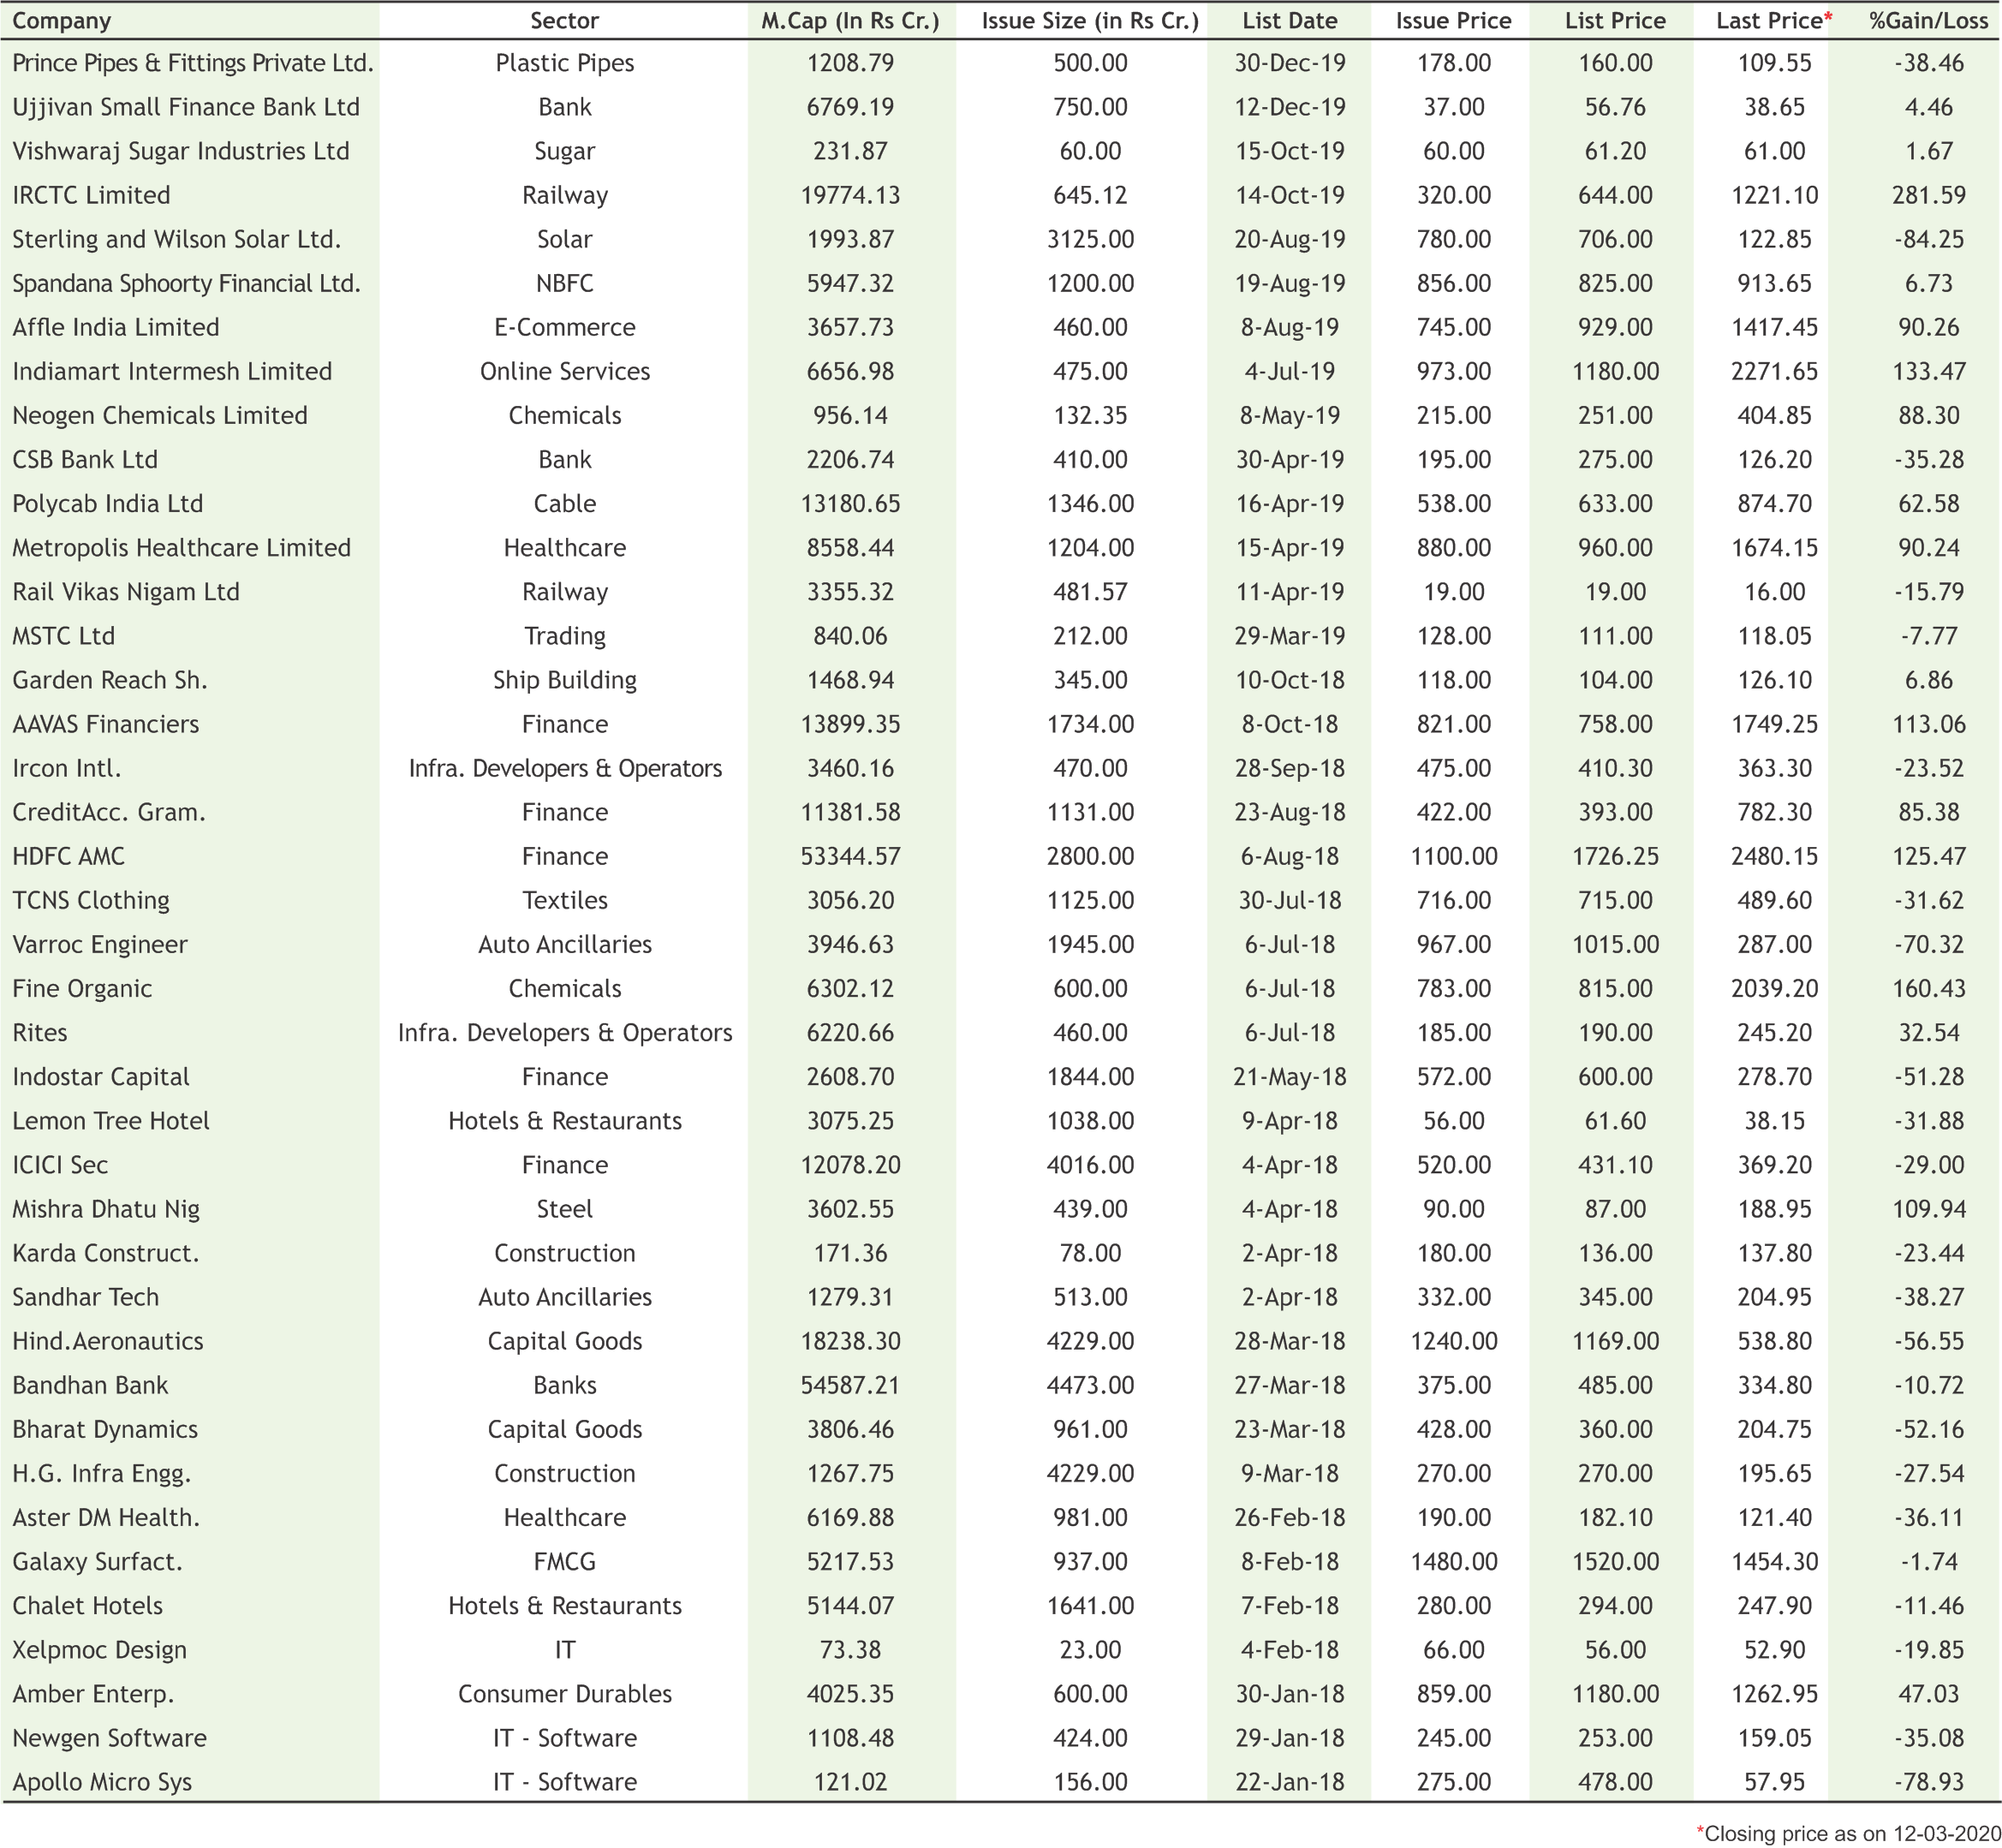
Rossari Biotech postpones IPO as coronavirus rattles market sentiment
Specialty chemicals manufacturing company Rossari Biotech, which had dared earlier in the day to launch its initial public offering (IPO) on March 18, has decided to postpone the plan given the turmoil in equity markets triggered by the novel coronavirus outbreak. The company on March 12 has also withdrawn its red herring prospectus available on the National Stock Exchange, after cancelling a press conference planned before opening the IPO. Rossari Biotech provides customised solutions to specific industrial and production requirements of customers primarily in the FMCG, apparel, poultry and animal feed industries through diversified product portfolio comprising home, personal care and performance chemicals; textile specialty chemicals; and animal health and nutrition products. The public issue comprises a fresh issue of Rs 50 crore and an offer for sale of up to 52.5 lakh equity shares each by promoters Edward Menezes and Sunil Chari. The issue was supposed to close on March 20. Edward Menezes and Sunil Chari hold 42.10 percent and 42.05 percent stake respectively in the company as of now. The firm proposed to use net fresh issue proceeds for repaying loans and funding working capital requirements. It will not receive any proceeds from the offer for sale. Axis Capital and ICICI Securities are the book running lead managers to the issue.
|
15

|
* Interest Rate may be revised by company from time to time. Please confirm Interest rates before submitting the application.
* For Application of Rs.50 Lac & above, Contact to Head Office.
* Email us at fd@smcindiaonline.com

16
Inflows to equity mutual funds touch 11-month high of Rs 10,730 cr in Feb
Inflows into equity mutual funds surged to Rs 10,730 crore in February, the highest level in 11 months, even as the broader market witnessed heavy volatility amid concerns over the impact of coronavirus. Overall, the mutual fund industry witnessed a net outflow of Rs 1,985 crore across all segments, mainly owing to withdrawal from the liquid or money market category. In comparison, an inflow of Rs 1.2 lakh crore was seen in January. Net inflows into equity and equity-linked schemes rose from Rs 7,547 crore in January to Rs 10,760 crore in February, data by the Association of Mutual Funds in India showed on Wednesday. This is the highest since March 2019, when equity schemes attracted an inflow to the tune of Rs 11,756 crore. The inflow is well spread between the category of funds such as large-cap, mid-cap, small-cap and multi-cap, among others. Large-cap, mid-cap and small-cap funds saw inflows of Rs 1,607 crore, Rs 1,451 crore and Rs 1,498 crore, respectively during the month under review. Besides, gold ETFs saw the highest inflows of Rs 1,483 crore in February amid a selloff in the equity markets. This was in comparison to Rs 202 crore inflow seen in the safehaven instrument.
Inflows into gold ETF hit all-time high of Rs 1,483 crore in Feb
Gold exchange-traded funds witnessed an all-time high net inflow of Rs 1,483 crore in February, as slowdown in global economy amid the coronavirus outbreak led investors to opt for the instrument as a safe haven. This also marks the fourth consecutive monthly net inflow in gold ETFs. The latest inflow comes amid a sell-off in broader market and sharp plunge in international crude oil prices. According to the latest data available with the Association of Mutual Funds in India (Amfi), a net sum of Rs 1,483 crore was pumped in into gold-linked ETFs in February as compared with the 7-year high of Rs 202 crore in the preceding month. Prior to that, the safe-haven asset saw an infusion of Rs 27 crore in December and Rs 7.68 crore in November. However, it had
AMFI Feb data: Liquid funds hit the most
Liquid funds saw record outflows in February at Rs 43,825 crore as against inflows of Rs 59,682 crore in January, data from the Association of Mutual Funds in India (AMFI) showed. Within the debt category, credit risk funds continued to witness outflows. However, outflows have halved at Rs 637 crore compared to the month-ago period.
Sundaram Mutual Fund announced the appointment of Independent Director
Sundaram Mutual Fund announced the appointment of R Raghuttama Rao as an Independent Director on the board of Sundaram AMC consequent to the completion of the present term of office of Pratip Chaudhuri in Feb 2020.
17
|
|
|
|
|
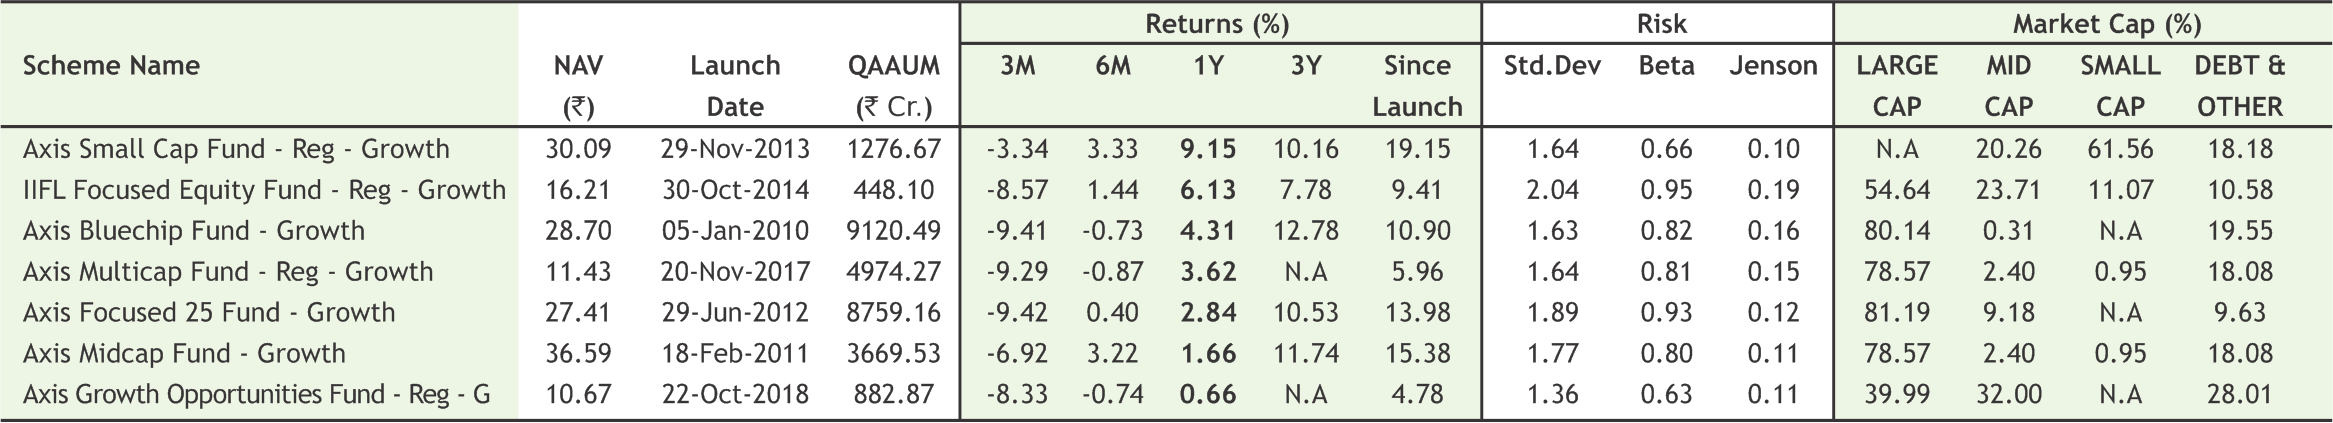
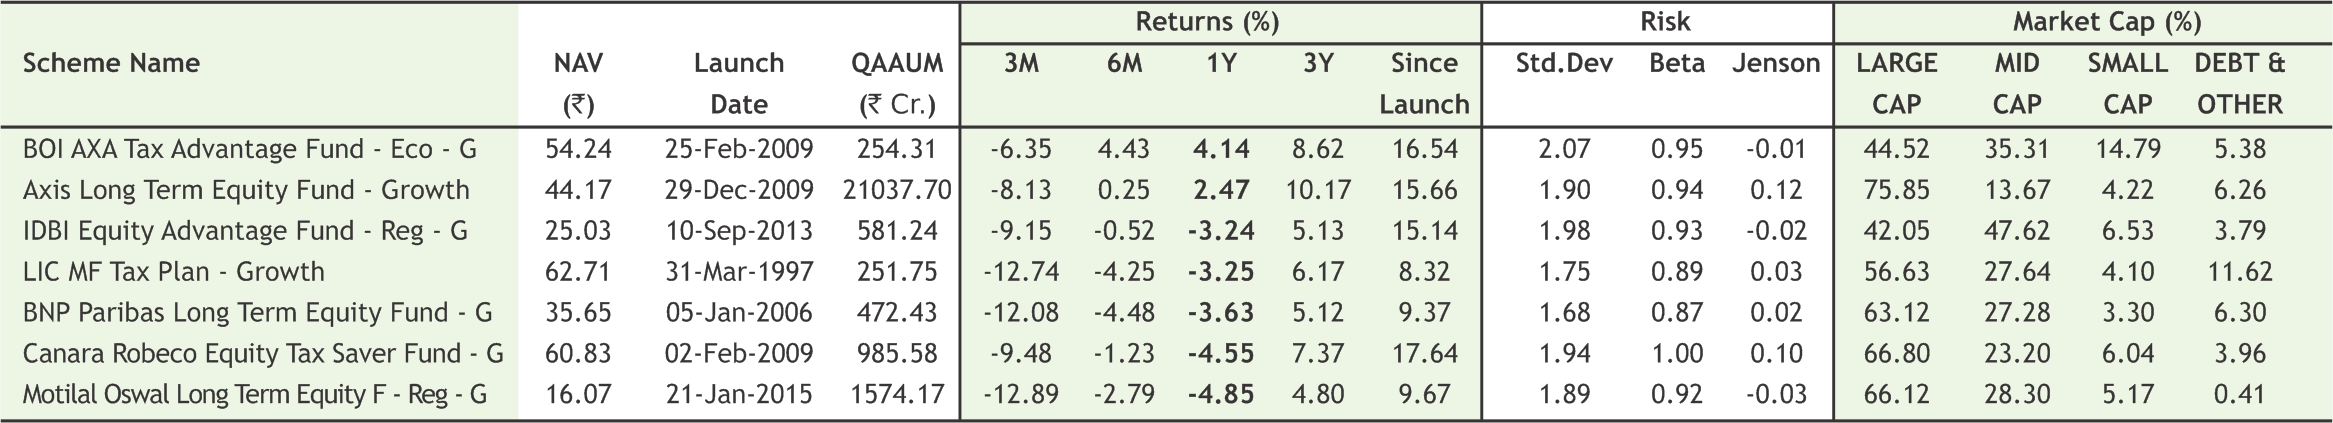
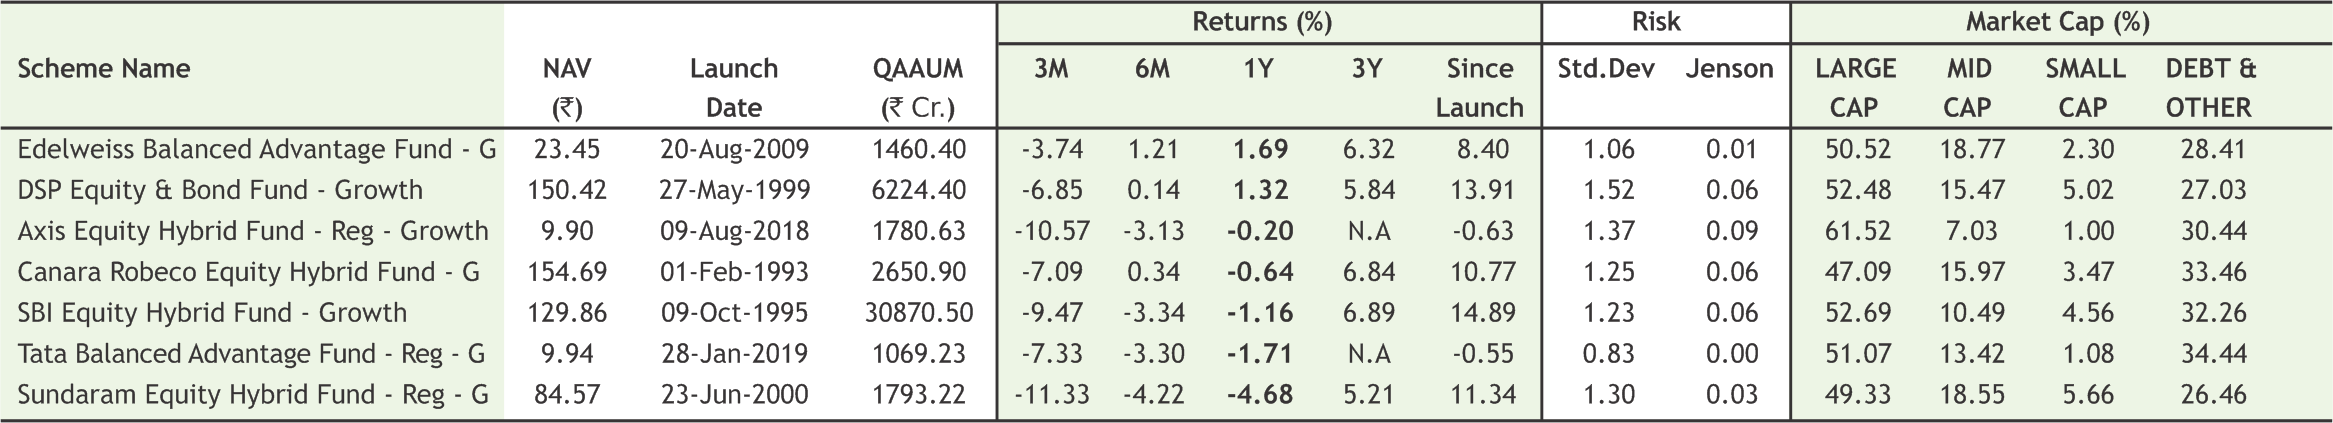
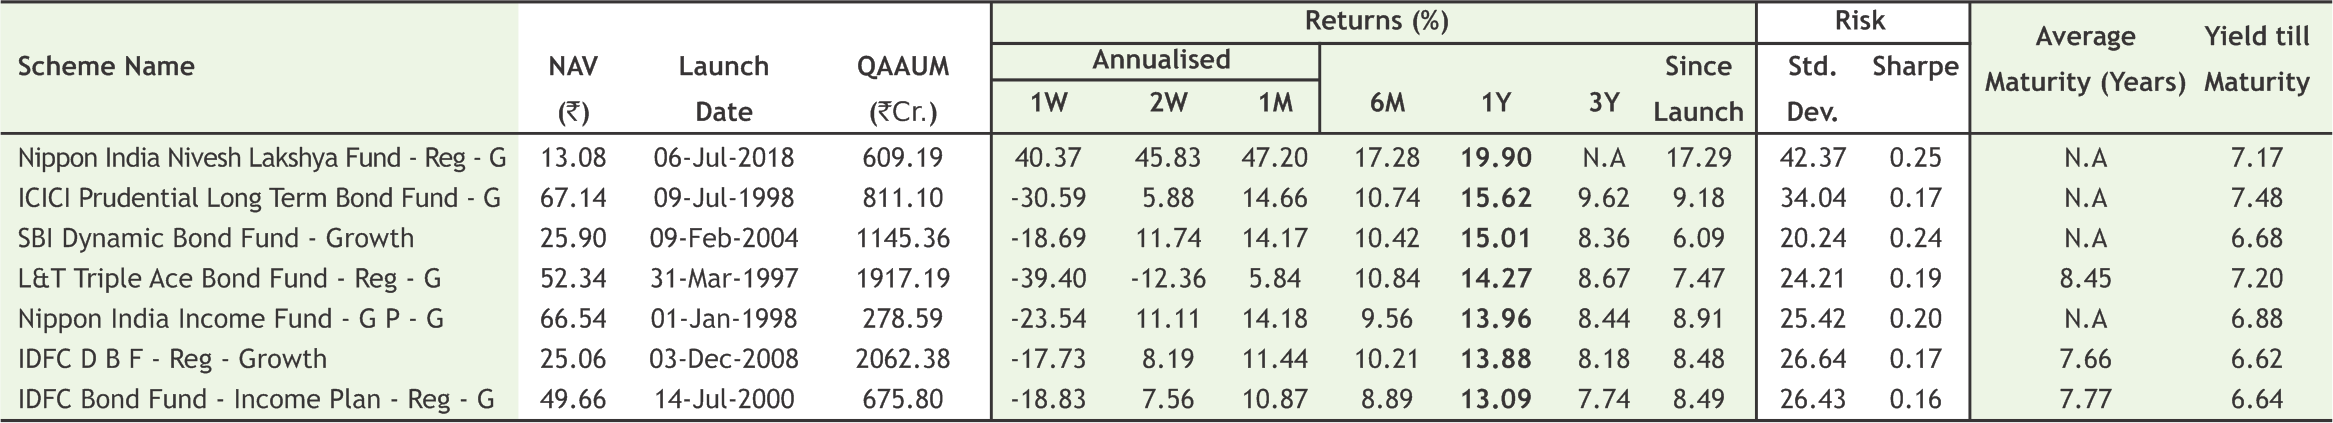
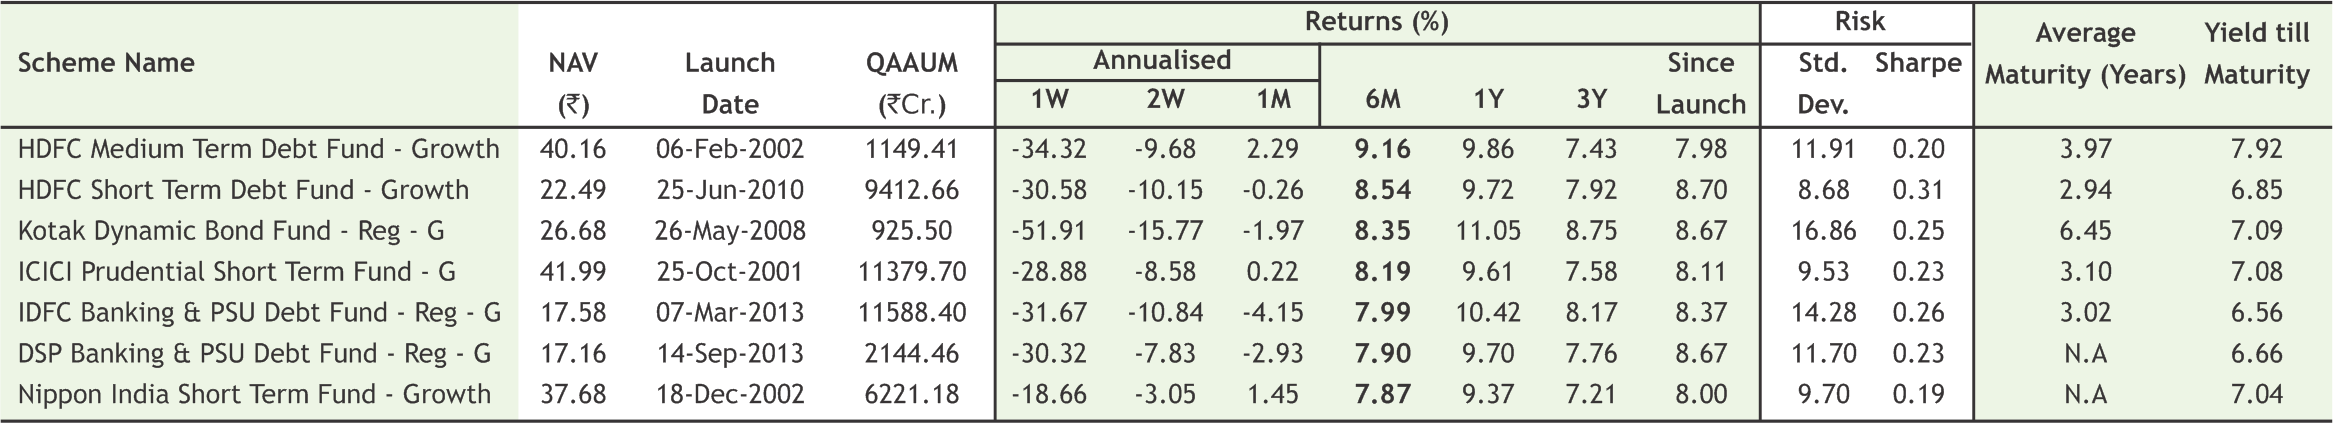
Note:Indicative corpus are including Growth & Dividend option . The above mentioned data is on the basis of 08/08/2019 Beta, Sharpe and Standard Deviation are calculated on the basis of period: 1 year, frequency: Weekly Friday, RF: 7%
*Mutual Fund investments are subject to market risks, read all scheme related documents carefully
18
Key Directors and employees during the Havan conducted at the inauguration of SMC Finance’s new office at Pusa Road, New Delhi.
Dr. D K Aggarwal (CMD, SMC Investments & President, PHDCCI) during the "Budget Viewing Session 2020-21" on 1st February 2020 held at PHD House, New Delhi
www.smcindiaonline.com


![]() Customized Plans
Customized Plans
![]() Comprehensive Investment Solutions
Comprehensive Investment Solutions
![]() Long-term Focus
Long-term Focus
![]() Independent & Objective Advise
Independent & Objective Advise
![]() Financial Planning
Financial Planning

Call Toll-Free 180011 0909
Visit www.smcindiaonline.com
REGISTERED OFFICES:
11 / 6B, Shanti Chamber, Pusa Road, New Delhi 110005. Tel: 91-11-30111000, Fax: 91-11-25754365
MUMBAI OFFICE:
Lotus Corporate Park, A Wing 401 / 402 , 4th Floor , Graham Firth Steel Compound, Off Western Express Highway, Jay Coach Signal, Goreagon (East) Mumbai - 400063
Tel: 91-22-67341600, Fax: 91-22-67341697
KOLKATA OFFICE:
18, Rabindra Sarani, Poddar Court, Gate No-4,5th Floor, Kolkata-700001 Tel.: 033 6612 7000/033 4058 7000, Fax: 033 6612 7004/033 4058 7004
AHMEDABAD OFFICE :
10/A, 4th Floor, Kalapurnam Building, Near Municipal Market, C G Road, Ahmedabad-380009, Gujarat
Tel : 91-79-26424801 - 05, 40049801 - 03
CHENNAI OFFICE:
Salzburg Square, Flat No.1, III rd Floor, Door No.107, Harrington Road, Chetpet, Chennai - 600031.
Tel: 044-39109100, Fax -044- 39109111
SECUNDERABAD OFFICE:
315, 4th Floor Above CMR Exclusive, BhuvanaTower, S D Road, Secunderabad, Telangana-500003
Tel : 040-30031007/8/9
DUBAI OFFICE:
2404, 1 Lake Plaza Tower, Cluster T, Jumeriah Lake Towers, PO Box 117210, Dubai, UAE
Tel: 97145139780 Fax : 97145139781
Email ID : pankaj@smccomex.com
smcdmcc@gmail.com
Printed and Published on behalf of
Mr. Saurabh Jain @ Publication Address
11/6B, Shanti Chamber, Pusa Road, New Delhi-110005
Website: www.smcindiaonline.com
Investor Grievance : igc@smcindiaonline.com
Printed at: S&S MARKETING
102, Mahavirji Complex LSC-3, Rishabh Vihar, New Delhi - 110092 (India) Ph.: +91-11- 43035012, 43035014, Email: ss@sandsmarketing.in