2019: Issue 710, Week: 18th - 22nd November
A Weekly Update from SMC (For private circulation only)
WISE M NEY
NEY


2019: Issue 710, Week: 18th - 22nd November
A Weekly Update from SMC (For private circulation only)
NEY


| Equity | 4-7 |
| Derivatives | 8-9 |
| Commodity | 10-13 |
| Currency | 14 |
| IPO | 15 |
| FD Monitor | 16 |
| Mutual Fund | 17-18 |
I
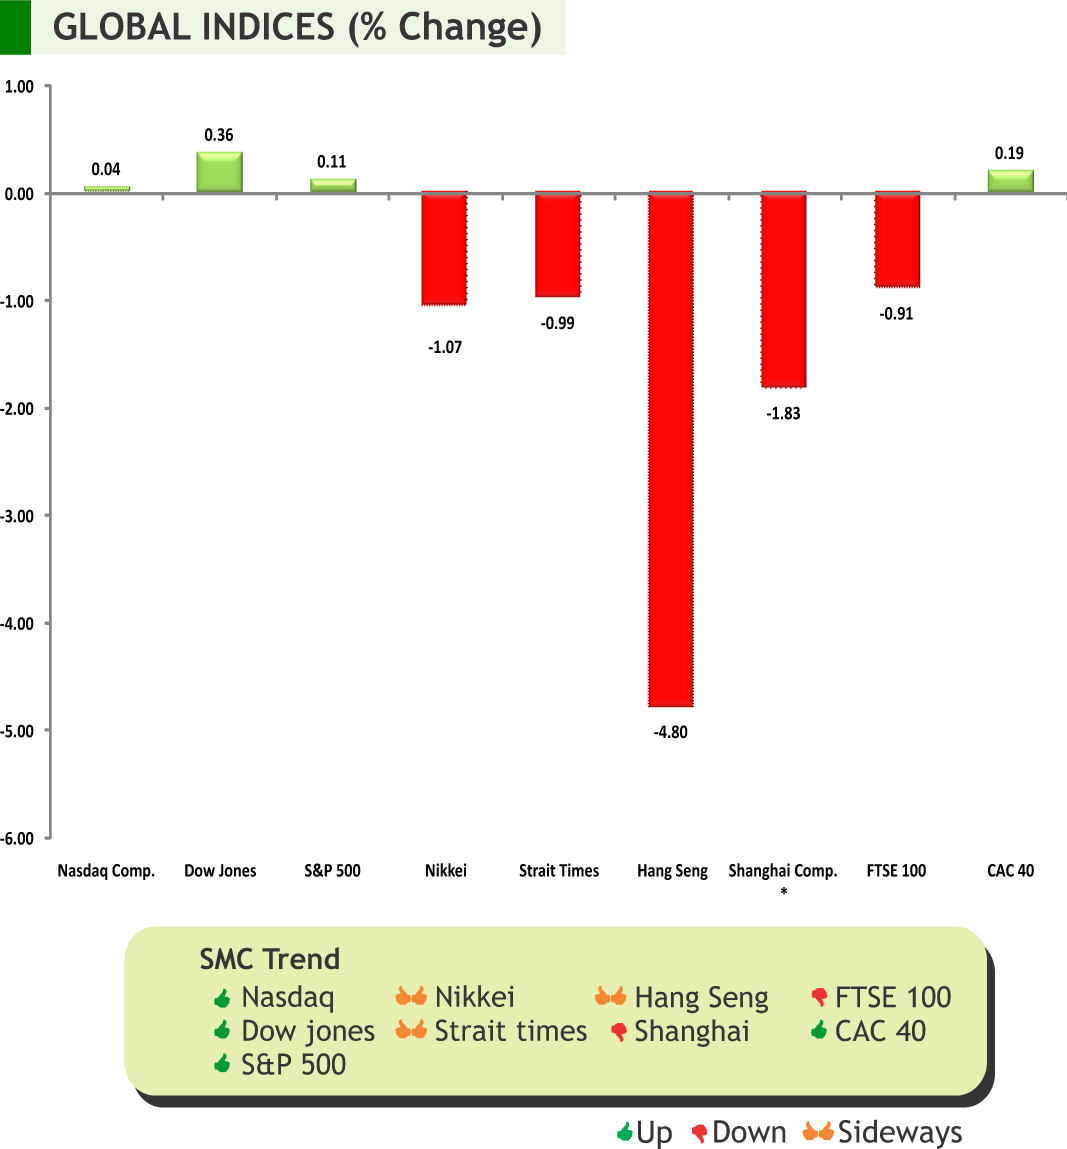
n the week gone by, worries about violent anti-government protests in Hong Kong I and weak data from China and Germany, which reinforced concerns about the global economy, soured investor sentiment. Meanwhile, US and China are inching towards a trade deal and this is a positive sign for the market. Earlier US President Trump has threatened more China tariffs, if talks aimed at ending a trade war fail to produce an interim agreement. On the data front, China's industrial production growth slowed sharply in October, rising 4.7 per cent year-on-year while retail sales also slowed to fall short of expectations and investment growth hit a record low. Japan’s economy grew at the slowest pace in a year in the third quarter as the U.S.- China trade war and soft global demand knocked exports, keeping policymakers under pressure to ramp up fiscal and monetary stimulus to bolster a fragile recovery.
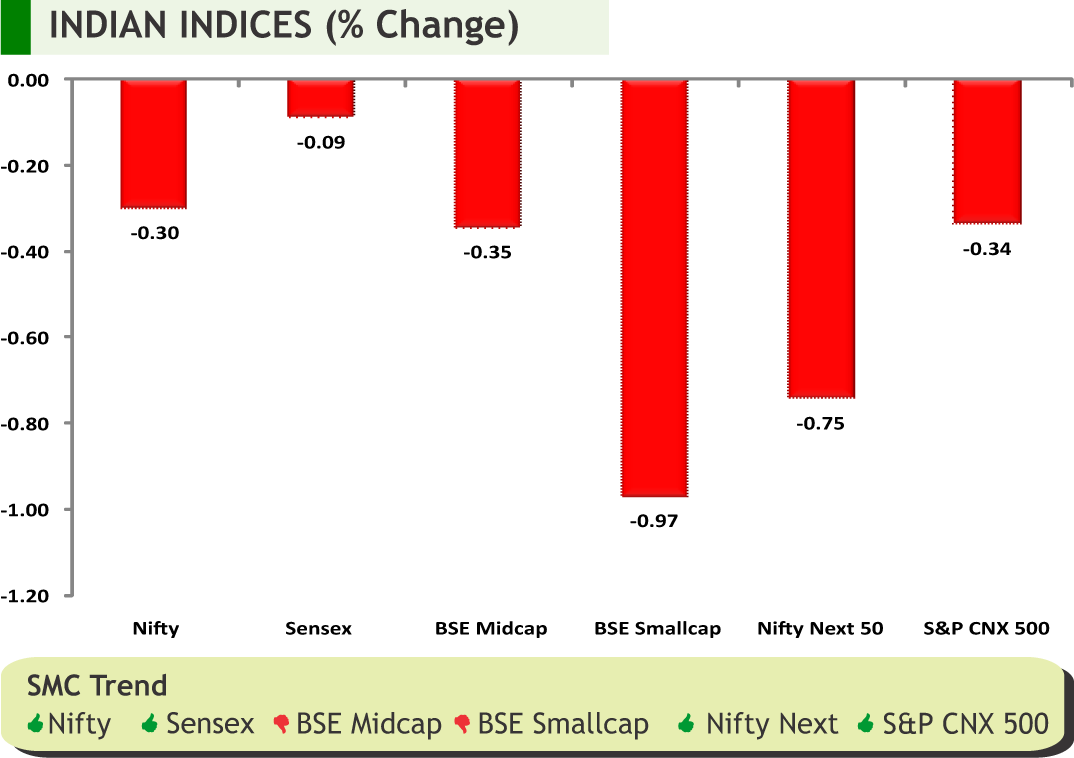
Back at home, Indian market witnessed a volatile trade on the back of weak macroeconomic data from home as well as poor cues from Asian peers. Meanwhile, Industrial production contracted 4.3 percent in September, mainly due to poor performance in the manufacturing sector. Driven by higher food prices, India's retail inflation surged to 4.62 percent in October, exceeding the central bank’s mediumterm target for the first time. While CPI inflation is highest since June 2018, Core WPI inflation has slipped to lowest level in the new series. Core inflation (headline inflation excluding food and fuel) slipped to 3.5% in October. The rupee remained weak as poor macro data and lingering worries over US-China trade war weighed on sentiment. Going forward domestic markets are likely to stay wobbly following weak sentiments while global peers will remain cautious. Now all eyes are on GDP data for the September quarter which will be released by the end of the month. However, Moody's slashed India's economic growth forecast to 5.6% for 2019. Besides, markets are expected to take cues from rupee movement, foreign fun inflow and outflow, any development in US china trade deal among others.
On the commodity markets front, it was an average week for commodities where we saw limited move in the prices. CRB saw marginal gain; closed near 190. Bullion counter may witness lower level buying amid safe haven demand due to growing skepticism regarding US China trade deal. Gold can recover towards 38600 levels while taking support near 37700 levels while silver can test 45500 levels while taking support near 43500 levels. Crude oil prices may trade in a range as lower than estimated surplus by OPEC nations and hope of trade deal between US and China is supporting the prices but larger than expected buildup of inventories is capping the upside. Base metal counter may trade sideways path as weak manufacturing and investment data from China fuelled concerns about Chinese economy. Building Permits, FOMC Meeting Minutes, Philadelphia Fed Manufacturing Index, Existing Home Sales of US, PBoC Interest Rate, ECB Publishes Account of Monetary Policy Meeting, German GDP and Manufacturing PMI etc are few important triggers for commodities.

SMC Global Securities Ltd. (hereinafter referred to as “SMC”) is a registered Member of National Stock Exchange of India Limited, Bombay Stock Exchange Limited and its associate is member of MCX stock Exchange Limited. It is also registered as a Depository Participant with CDSL and NSDL. Its associates merchant banker and Portfolio Manager are registered with SEBI and NBFC registered with RBI. It also has registration with AMFI as a Mutual Fund Distributor.
SMC is a SEBI registered Research Analyst having registration number INH100001849. SMC or its associates has not been debarred/ suspended by SEBI or any other regulatory authority for accessing /dealing in securities market.
SMC or its associates including its relatives/analyst do not hold any financial interest/beneficial ownership of more than 1% in the company covered by Analyst. SMC or its associates and relatives does not have any material conflict of interest. SMC or its associates/analyst has not received any compensation from the company covered by Analyst during the past twelve months. The subject company has not been a client of SMC during the past twelve months. SMC or its associates has not received any compensation or other benefits from the company covered by analyst or third party in connection with the research report. The Analyst has not served as an officer, director or employee of company covered by Analyst and SMC has not been engaged in market making activity of the company covered by Analyst.
The views expressed are based solely on information available publicly available/internal data/ other reliable sources believed to be true.
SMC does not represent/ provide any warranty express or implied to the accuracy, contents or views expressed herein and investors are advised to independently evaluate the market conditions/risks involved before making any investment decision.
DOMESTIC NEWS
Economy
• India's wholesale price index rose 0.16 percent year-on-year in October, after a 0.33 percent increase in September. Economists had expected a 0.24 percent fall. The buildup inflation was 1.92 percent in October compared to 4.90 percent in the corresponding period of the previous year.
• India's consumer prices index rose 4.62 percent year-on-year in October following a 3.99 percent increase in September. Economists had forecast 4.25 percent inflation. In October last year, inflation was 3.38 percent.
• India's Industrial output decreased 4.3 percent year-on-year in September, following a revised 1.4 percent drop in August. Economists had forecast a moderate growth of 1.9 percent.
Pharmaceuticals
• Dr Reddys Laboratories announced the entry into the nutrition segment with the launch of its diabetes nutrition drink ‘Celevida' in India. It's a first-of-its-kind under Dr. Reddy's nutrition portfolio and clinically proven to help manage blood glucose levels among Indian patients.
• Aurobindo Pharma has received 14 observations from the US health regulator for its Hyderabad-based plant. The company believes that none of the observations are related to data integrity issues and, it will respond to the USFDA within the stipulated timeline.
Realty
• Ahluwalia Contracts (India) has won an order worth of Rs. 365 crore for Construction of Sant Nirankari Mandal (Regd.) Hospital at Dheerpur Scheme Phase-1, New Delhi and another order worth Rs.171.66 crore for Construction / Development of Commercial Project for Nephronia Ecospaces at Pune.
Information Technology
• Tata Consultancy Services announced an expansion of its long-term partnership with Phoenix Group, Europe's largest life and pensions consolidator, to drive the growth and transformation of the Standard Life business and meet the future needs of its customers, workplace clients and their advisers.
• Wipro has entered into an agreement with Telecom Infra Project (TIP) to drive its 5G adoption.
Bank
• HDFC Bank plans to reach 200 branches across Northeast India. The bank has around 136 branches in eight states of the region. Across Northeast India HDFC Bank will have branch network of 200 branches.
Capital Goods
• KEC International has bagged orders worth Rs 2,255 crore across various business verticals in the domestic market. The RPG Group firm has secured three projects each from Power Grid Corporation, Tamil Nadu Transmission Corporation and Karnataka Power Transmission Corporation with an aggregate value of Rs 885 crore in its transmission and distribution business.
Gems & Jewellery
• The gems and jewellery exports continued to be affected following geopolitical tensions as the overall shipments in October declined by 5.49 per cent to Rs 24,583.19 crore compared to the same month last year. The exports stood at Rs 26,010.87 crore in October 2018, according to data given by the Gems and Jewellery Export Promotion Council (GJEPC).
INTERNATIONAL NEWS
• US producer price index for final demand climbed by 0.4 percent in October after falling by 0.3 percent in September. Economists had expected producer prices to rise by 0.3 percent.
• US initial jobless claims climbed to 225,000, an increase of 14,000 from the previous week's unrevised level of 211,000. Economists had expected jobless claims to inch up to 215,000.
• US consumer price index climbed by 0.4 percent in October after coming in unchanged in September. Economists had expected consumer prices to rise by 0.3 percent.
• US wholesale inventories slid by 0.4 percent in September after inching up by a downwardly revised 0.1 percent in August. Economists had expected inventories to dip by 0.3 percent compared to the 0.2 percent uptick originally reported for the previous month.
• US labor productivity dipped by 0.3 percent in the third quarter after spiking by an upwardly revised 2.5 percent in the second quarter.
• UK retail sales decreased 0.1 percent monthly in October after a 0.2 percent decline in the previous month. Economists had expected a 0.2 percent increase.
• Japan's Industrial production rose 1.7 percent month-on-month in September. According to the initial estimate, production had increased 1.4 percent. On a monthly basis, shipments gained 1.5 percent in September instead of 1.3 percent initially estimated.
• Japan's Gross domestic product grew an annualized 0.2 percent quarterly following a revised 1.8 percent expansion in the second quarter. Economists had forecast 0.8 percent growth.
| Stocks | *Closing Price | Trend | Date Trend Changed | Rate Trend Changed | SUPPORT | RESISTANCE | Closing S/l |
|---|---|---|---|---|---|---|---|
| S&P BSE SENSEX | 40357 | UP | 08.02.19 | 36546 | 36300 | 35300 | |
| NIFTY50 | 11895 | UP | 08.02.19 | 10944 | 10900 | 10600 | |
| NIFTY IT* | 15311 | UP | 21.07.17 | 10712 | 15200 | 14800 | |
| NIFTY BANK | 31017 | UP | 30.11.18 | 26863 | 27700 | 27000 | |
| ACC | 1486 | DOWN | 04.10.19 | 1488 | 1540 | 1565 | |
| BHARTIAIRTEL | 393 | UP | 15.03.19 | 338 | 370 | 360 | |
| BPCL | 513 | UP | 30.08.19 | 355 | 470 | 450 | |
| CIPLA | 472 | UP | 25.10.19 | 460 | 440 | 430 | |
| SBIN | 318 | UP | 01.11.19 | 314 | 285 | 275 | |
| HINDALCO | 205 | UP | 07.11.19 | 205 | 195 | 192 | |
| ICICI BANK | 479 | UP | 20.09.19 | 418 | 450 | 440 | INFOSYS | 720 | DOWN | 25.10.19 | 637 | 690 | 720 |
| ITC* | 266 | DOWN | 31.05.19 | 279 | - | 270 | |
| L&T | 1435 | UP | 20.09.19 | 1412 | 1430 | 1410 | |
| MARUTI | 7287 | UP | 13.09.19 | 6450 | 7100 | 6900 | |
| NTPC | 120 | DOWN | 16.08.19 | 118 | 126 | 130 | |
| ONGC | 142 | UP | 20.09.19 | 134 | 134 | 130 | |
| RELIANCE | 1459 | UP | 16.08.19 | 1278 | 1370 | 1340 | |
| TATASTEEL | 403 | UP | 01.11.19 | 396 | 375 | 365 | |
*ITC has breached the resistance of 260
Closing as on 07-11-2019
NOTES:
1) These levels should not be confused with the daily trend sheet, which is sent every morning by e-mail in the name of "Morning Mantra ".
2) Sometimes you will find the stop loss to be too far but if we change the stop loss once, we will find more strength coming into the stock. At the moment, the stop loss will be far as we are seeing the graphs on weekly basis and taking a long-term view and not a short-term view.
| Meeting Date | Company | Purpose |
|---|---|---|
| 13/11/2019 | Dabur India | 140% Interim Dividend |
| 14/11/2019 | Godrej Consumer | 200% Interim Dividend |
| 18/11/2019 | Exide Inds. | 160% Interim Dividend |
| 18/11/2019 | IndiabullsHous. | 350% Interim Dividend |
| 19/11/2019 | Manappuram Fin. | 27.5% Interim Dividend |
| Ex-Date | Company | Purpose |
|---|---|---|
| 11/11/2019 | Britannia Inds. | Quarterly Results |
| 11/11/2019 | Hindalco Inds. | Quarterly Results |
| 11/11/2019 | Coal India | Quarterly Results |
| 11/11/2019 | NMDC | Quarterly Results |
| 11/11/2019 | Mahanagar Gas | Quarterly Results |
| 11/11/2019 | Adani Ports | Quarterly Results |
| 12/11/2019 | Adani Enterp | Quarterly Results |
| 12/11/2019 | Aurobindo Pharma | Quarterly Results,Interim Dividend |
| 12/11/2019 | Sun TV Network | Quarterly Results,Interim Dividend |
| 13/11/2019 | Bata India | Quarterly Results |
| 13/11/2019 | Natl. Aluminium | Quarterly Results |
| 13/11/2019 | B H E L | Quarterly Results |
| 13/11/2019 | Adani Power | Quarterly Results |
| 13/11/2019 | Cadila Health. | Quarterly Results |
| 13/11/2019 | Muthoot Finance | Quarterly Results |
| 14/11/2019 | BalkrishnaInds | Quarterly Results,Interim Dividend |
| 14/11/2019 | CESC | Quarterly Results |
| 14/11/2019 | Grasim Inds | Quarterly Results |
| 14/11/2019 | Apollo Hospitals | Quarterly Results |
| 14/11/2019 | S A I L | Quarterly Results |
| 14/11/2019 | Union Bank (I) | Quarterly Results |
| 14/11/2019 | O N G C | Quarterly Results |
| 14/11/2019 | Power Fin.Corpn. | Quarterly Results |
| 14/11/2019 | NBCC | Quarterly Results |
| 14/11/2019 | Glenmark Pharma. | Quarterly Results |
4


5
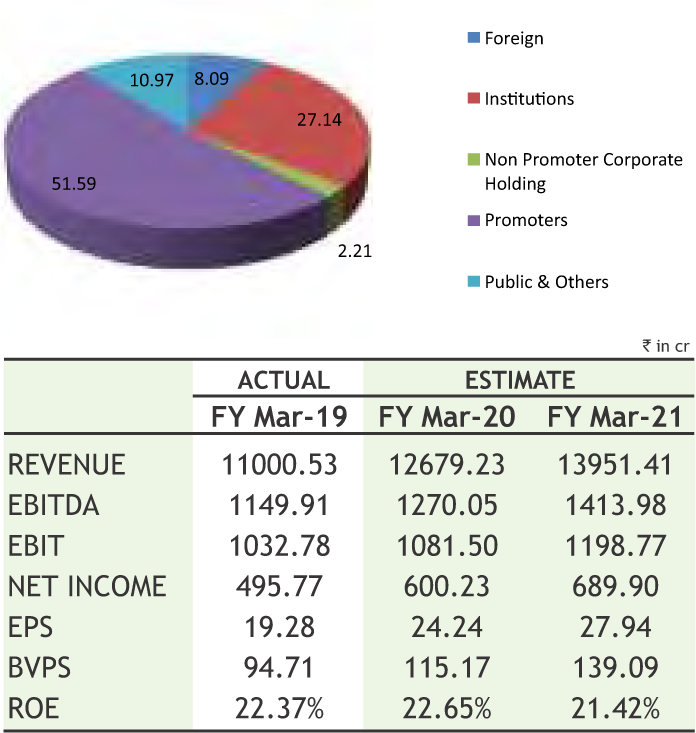
TECH MAHINDRA LIMITED
CMP: 791.30
Target Price: 914
Upside: 20%
| Face Value (Rs.) | 5.00 |
| 52 Week High/Low | 846.00/607.90 |
| M.Cap (Rs. in Cr.) | 73245.31 |
| EPS (Rs.) | 45.11 |
| P/E Ratio (times) | 16.83 |
| P/B Ratio (times) | 3.43 |
| Dividend Yield (%) | 1.88 |
| Stock Exchange | BSE |
Investment Rationale
• Digital revenues in Q2FY20 accelerated to 39% of overall revenues (vs. 30% in Q2FY19) and grew 11.8% QoQ. The company continued to see traction and focus on network services, mobility, artificial intelligence, blockchain and 5G.
• Barring manufacturing, growth was broad based and healthy across sub-segments within the enterprise segment. Weakness in manufacturing was on the back of softness in auto though management commentary suggests improving trajectory from Q3FY20 onwards. For telecom, the management continues to see traction in 5G and expects client spending on building architecture for 5G to gain momentum.
• Deal wins were strong, with the company receiving orders worth $1.49 billion (Rs. 10,000 Cr). This comes on the back of strong deal flows in the previous four quarters. The management commented that it has a “high degree" of confidence on the project pipeline.
• It has acquired 100% stake in Born Group Ltd for an enterprise value of US$95 million (Rs. 665 Cr). The acquisition will enhance Tech Mahindra’s transformation consulting capabilities mainly in retail vertical. The revenue for the acquired entity is US$50 million (Rs. 350 Cr) for CY18. The transaction is expected to close by November.
• The company expects EBIT margins in FY20E to dip 150-200 bps from FY19 levels (15%) mainly on account of a sharp drag in margins in Q1FY20 and large deal transition costs on expected lines.
Risk
• Fading Digital Services Traction
• Margin Erosion from large deals
Valuation
Healthy revenue growth, record deal, steady improvement in enterprise segment and likely uptick in momentum in telecom driven by deal wins would be key triggers for growth. As per the management, Tech Mahindra’s consistent large deal win is a testimony of differentiation in the marketplace. The company is confident of its growth outlook for both communications and enterprise businesses. ‘Digital’ continues to be a strong growth driver, as it helps its customers in their transformation journey. Thus it is expected that the stock may see a price target of Rs.914 in 8-10 months time frame on the targeted PE of 16.56 times its FY21(E) EPS of 55.19.
KEC INTERNATIONAL LIMITED
CMP: 278.00
Target Price: 335
Upside: 21%
| Face Value (Rs.) | 2.00 |
| 52 Week High/Low | 340.50/229.95 |
| M.Cap (Rs. in Cr.) | 7147.06 |
| EPS (Rs.) | 20.96 |
| P/E Ratio (times) | 13.26 |
| P/B Ratio (times) | 2.77 |
| Dividend Yield (%) | 0.97 |
| Stock Exchange | BSE |
Investment Rationale
• KEC International is a global infrastructure engineering, procurement and construction (EPC) major. It has presence in the verticals of power transmission and distribution, railways, civil, solar, smart infra, and cables. Globally, the company has empowered infrastructure development in more than 63 countries.
• The company has robust and well diversified order book and its management is confident of 15-20% growth in revenue for FY2020. The company expects its Railway business revenue to register a growth of 20-25% for FY20 and that of T&D as a whole is expected to register a growth of 15% for FY20.
• Recently, it has secured orders of Rs 885 crore for transmission & distribution projects from Power Grid Corporation, Tamil Nadu Transmission Corporation and Karnataka Power Transmission Corporation. Further, the urban transport business segment has secured an order of Rs 853 crore for the construction of elevated viaduct along with 10 stations of the Delhi Metro Phase IV project, from Delhi Metro Rail Corporation (DMRC). The railways business has secured an order of Rs 517 crore for the construction of roadbeds, major and minor bridges and associated civil works, from Rail Vikas Nigam (RVNL) in India.
• KEC International reported a 42% increase in consolidated profit after tax to Rs 139 crore in Q2 September 2019 as against Rs 98 crore in Q2 September 2018. Revenues increased by 17% to Rs 2809 crore in Q2 September 2019 as against Rs 2408 crore in Q2 September 2018. Railways Q2 revenues cross Rs 500 Crs mark and the company continues to focus on Execution focus continues
• The Railway business continues to be on a high growth trajectory on the back of consistent order inflows. T&D growth will be largely driven by international in FY20 with execution of orders from SAARC/Bangladesh, Brazil and Arica start
picking up during the fiscal. Management expects Brazil would give 35-40% order growth in FY20 and tenders already start coming from Saudi Arabia, West Africa and East Aisa.
Risk
• Increase in escalation cost due to delay in projects
• Political uncertainties and changes in regulations
Valuation
The company is continuously performing well and delivering in all the three parameters of revenue, profitability and order intake. T&D business has delivered a stellar performance, backed by robust execution in SAARC and the Americas. The Railway business continues its growth momentum as it expands portfolio in other segments. The management of the company expects international business to pick up with large order inflow from Jordan, Saudi, Far East (Indonesia, Thailand), etc and international T&D, substations and civil infra will be key drivers for FY20. Moreover, the company has maintained its annual guidance of 20% growth for FY20 revenue. We expect the stock to see a price target of Rs.335 in 8-10 month time frame on a one year average P/E of 12x and FY21 (E) Earnings Per Share of Rs.27.94.
Source: Company Website Reuters Capitaline
Above calls are recommended with a time horizon of 8 to 10 months.
6
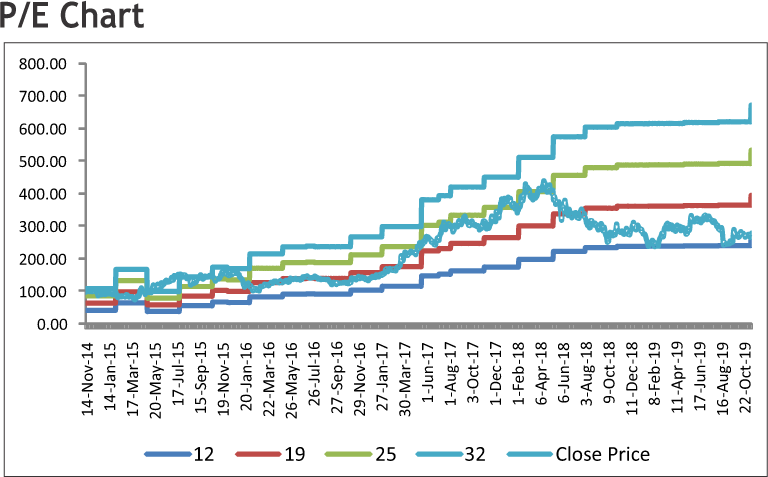
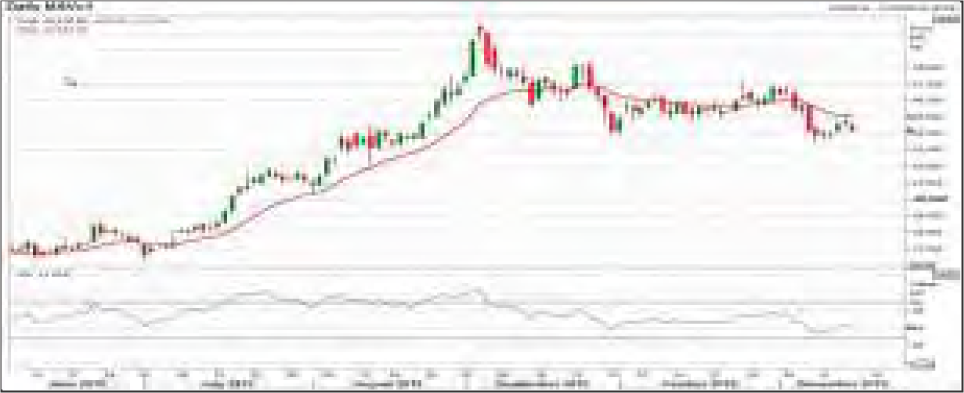
The stock closed at Rs 746.70 on 15th November, 2019. It made a 52-week low of Rs 572.85 on 20th June 2019 and a 52-week high of Rs. 798.10 on 06th February 2019. The 200 days Exponential Moving Average (DEMA) of the stock on the daily chart is currently at Rs 679.70
Stock has given the sharp correction from 800 levels and tested 570 in short span of time. Then after, it has formed a double bottom around 570-580 levels and started moving higher. On broader charts, stock is likely to form a “Cup and Handle” pattern on weekly charts and has given the breakout of same in last week. Apart from this, technical indicators like RSI and MACD are also suggest buying for the stock so one initiate long in the range of 735-740 levels for the upside target of 800-820 levels with SL below 700.

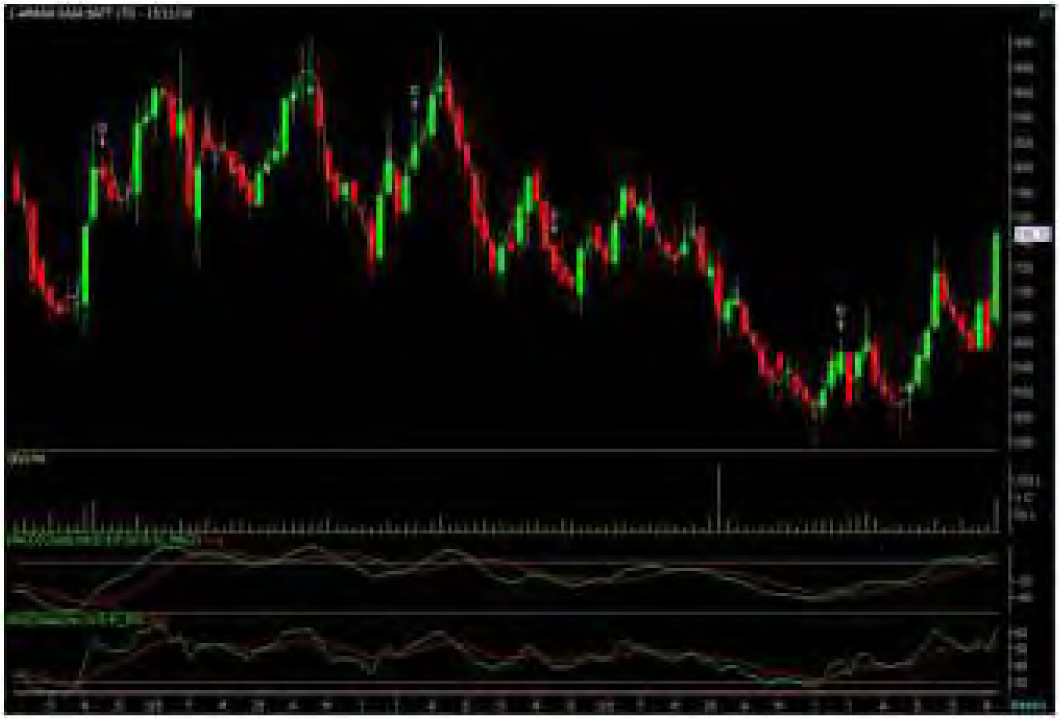
The stock closed at Rs 329.15 on 15th November, 2019. It made a 52-week low at Rs 218.20 on 30th January 2019 and a 52-week high of Rs. 330.90 on 15th November 2019. The 200 days Exponential Moving Average (DEMA) of the stock on the daily chart is currently at Rs 278.42
As we can see on charts that stock is trading in higher highs and higher lows sort of “Rising Wedge” on weekly charts, which is bullish in nature. Moreover, it has given the breakout of pattern by registered gains over 10% in last week and also has managed to close above the same, so buying momentum can continue for coming days. Therefore, one can buy in the range of 320-323 levels for the upside target of 355-360 levels with SL below 300.
Disclaimer : The analyst and its affiliates companies make no representation or warranty in relation to the accuracy, completeness or reliability of the information contained in its research. The analysis contained in the analyst research is based on numerous assumptions. Different assumptions could result in materially different results.
The analyst not any of its affiliated companies not any of their, members, directors, employees or agents accepts any liability for any loss or damage arising out of the use of all or any part of the analysis research.
SOURCE: CAPITAL LINE
Charts by Spider Software India Ltd
Above calls are recommended with a time horizon of 1-2 months
7
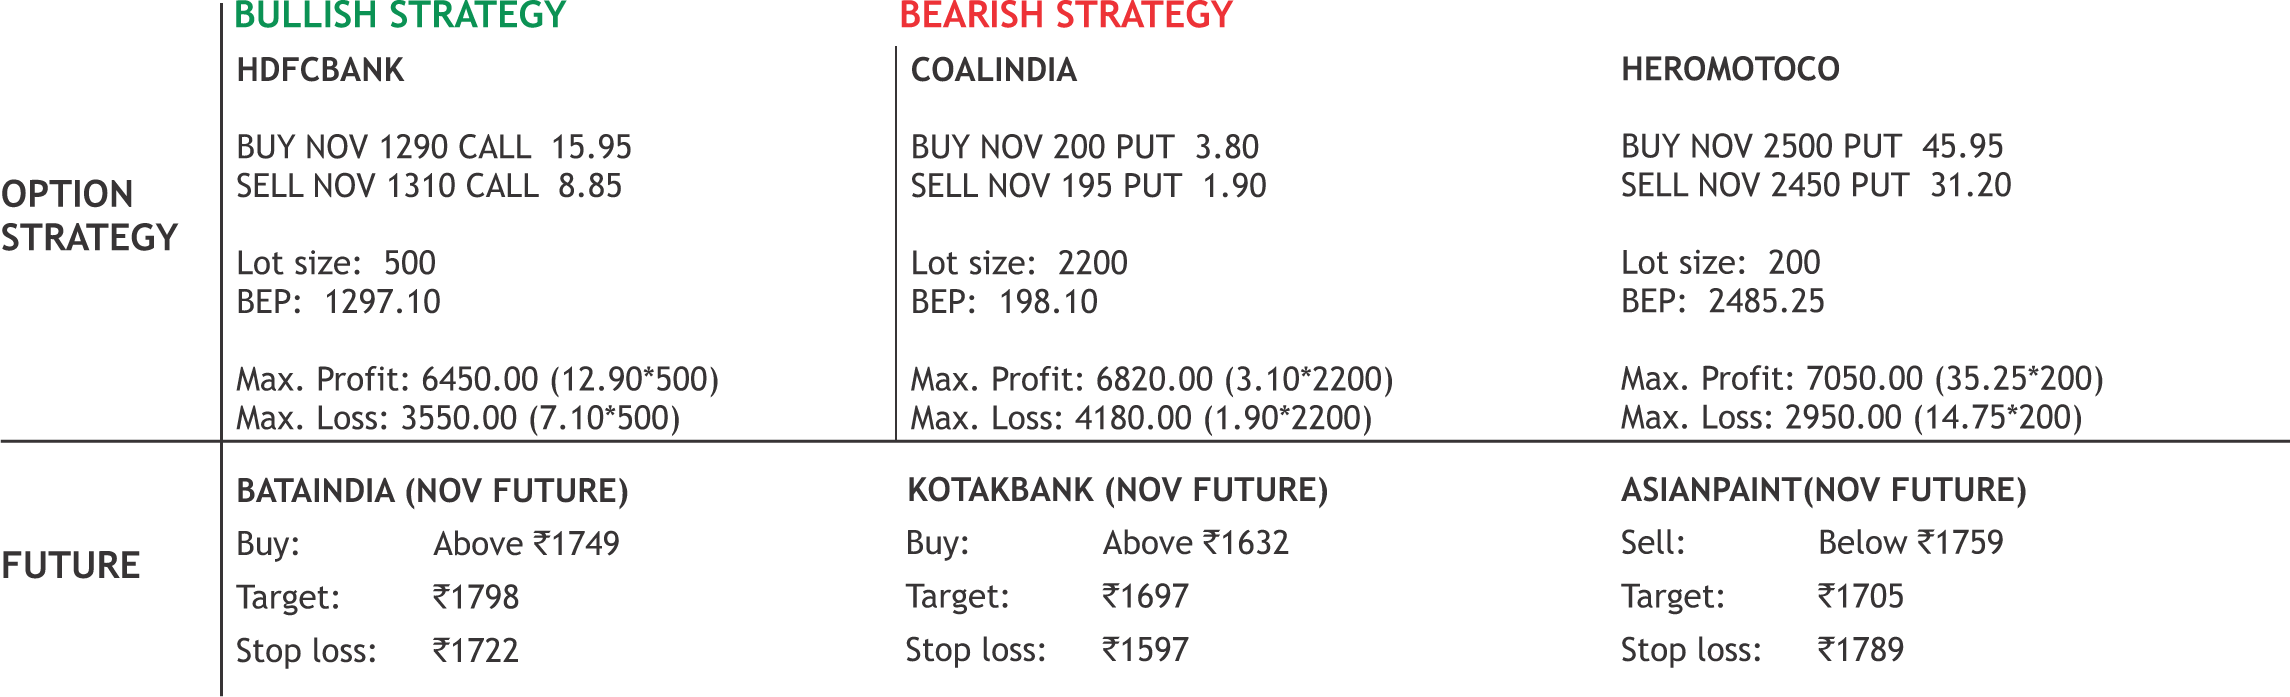
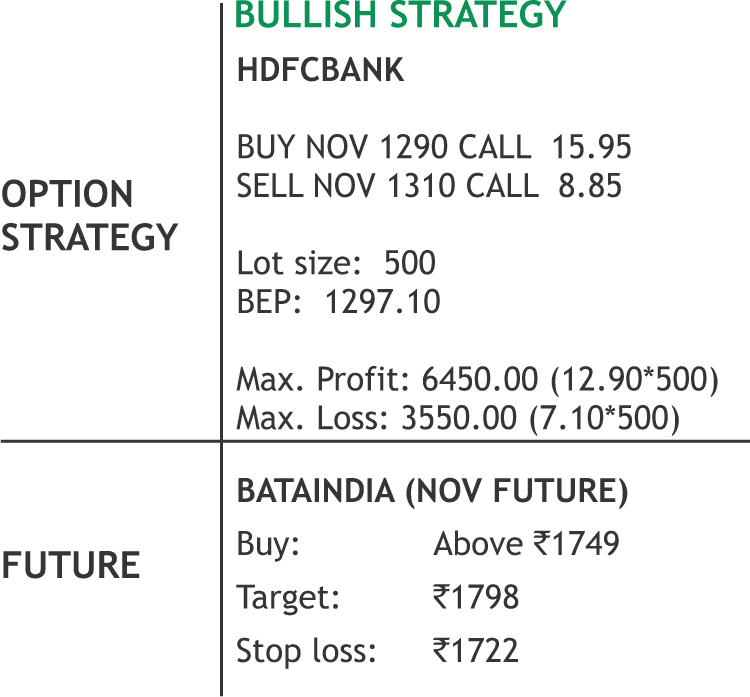
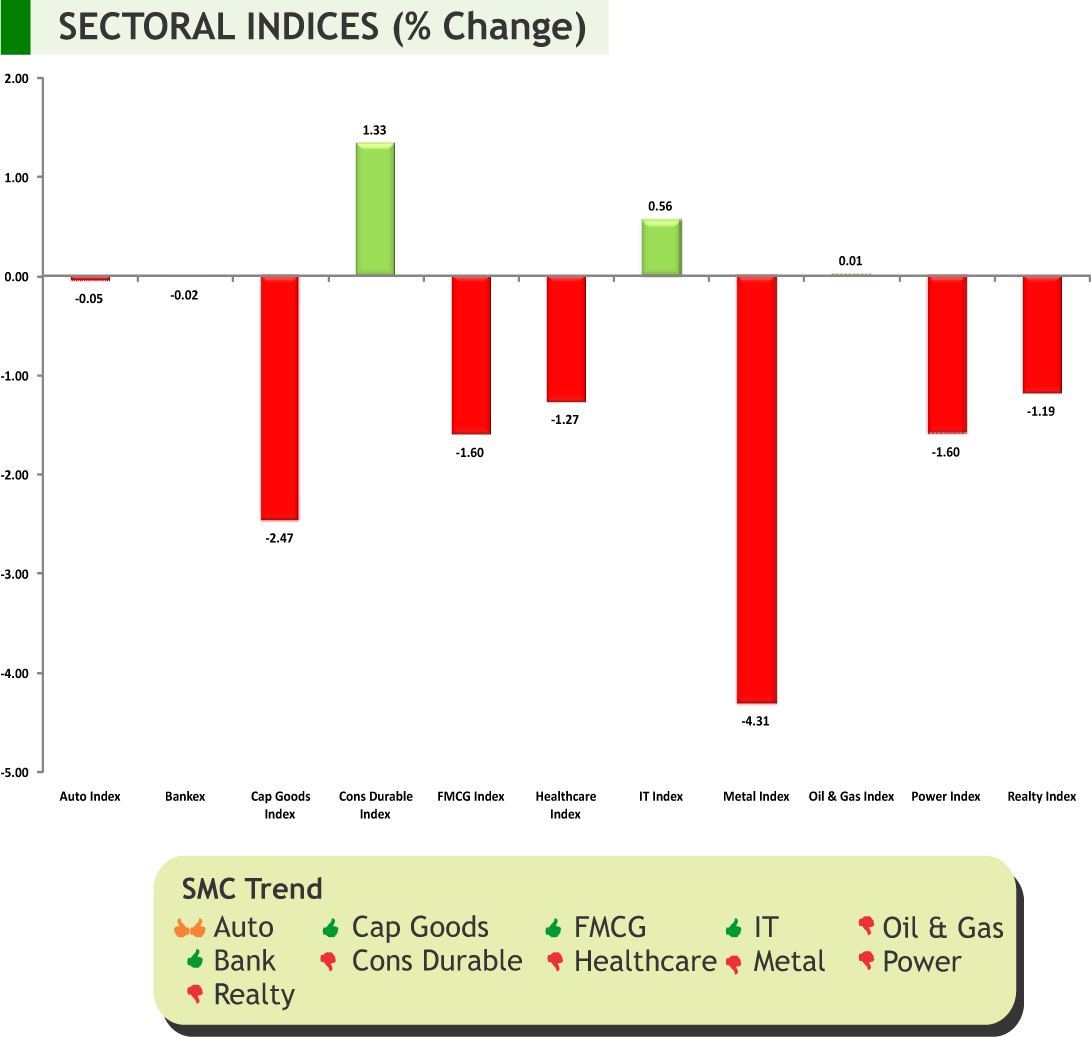
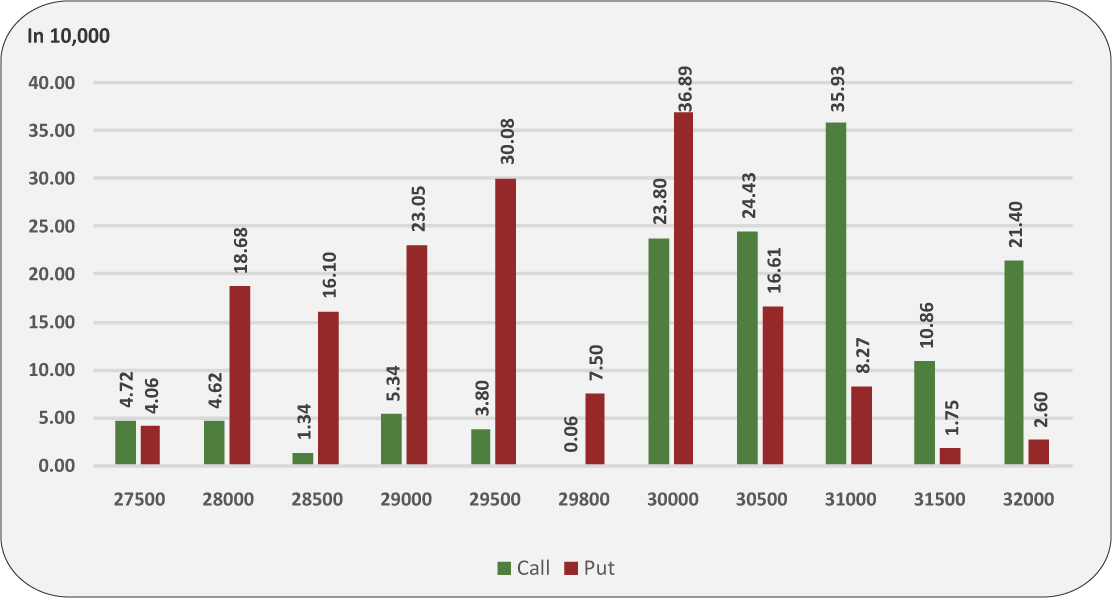
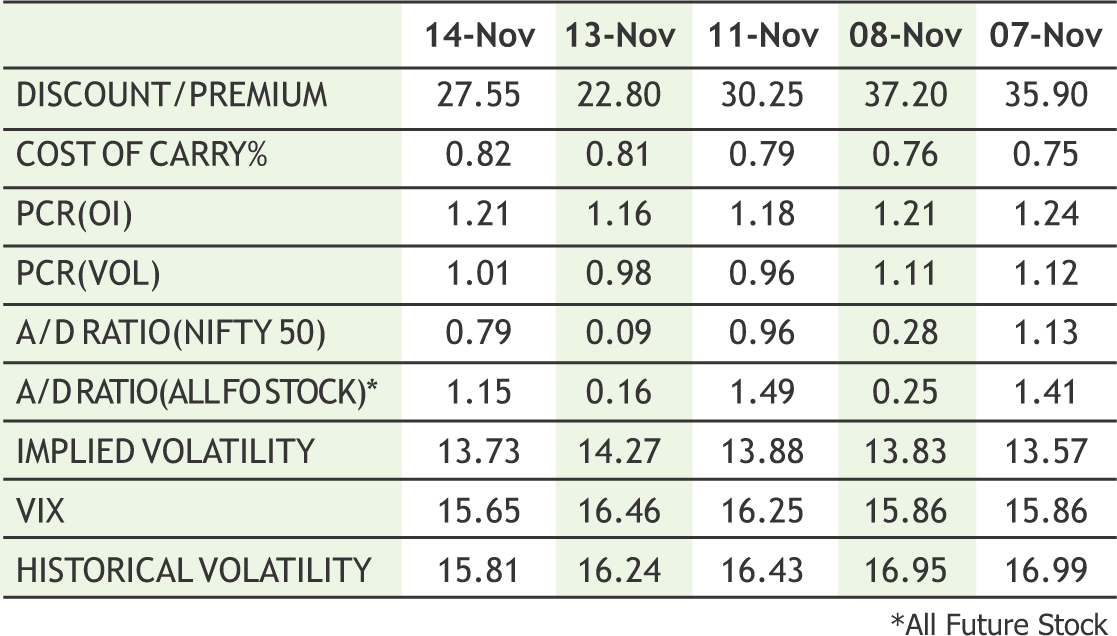
Volatility once again gripped the Indian markets in the week gone by as tug of war between bulls and bears kept the benchmark indices in a specific range. On one hand Nifty index ended the week on quite note, while on the other hand banknifty managed to hold above 31000 mark. From derivative front, call writers remained active in 12000 call strike and created fresh short positions while on downside 11800 strike holds with highest open interest in puts. The Implied Volatility (IV) of calls was up and closed at 13.73% while that for put options closed at 14.15%. The Nifty VIX for the week closed at 15.65% and is expected to remain sideways. PCR OI for the week closed at 1.21, which points towards put writing and is positive for markets. From technical front, both the indices are trading in a rising channel with formation of higher and higher bottom. However, secondary oscillators suggest that consolidation in both the indices at higher levels is likely to continue in coming week as well and we might witness stock specific action rather than any sharp move in index. However, as far Nifty is holding above 11800 mark the short term trend is likely to remain bullish and any decisive move above 12000 levels will add up further buying momentum towards 12100 levels.


8
|
|
|
|
**The highest call open interest acts as resistance and highest put open interest acts as support.
# Price rise with rise in open interest suggests long buildup | Price fall with rise in open interest suggests short buildup
# Price fall with fall in open interest suggests long unwinding | Price rise with fall in open interest suggests short covering
9
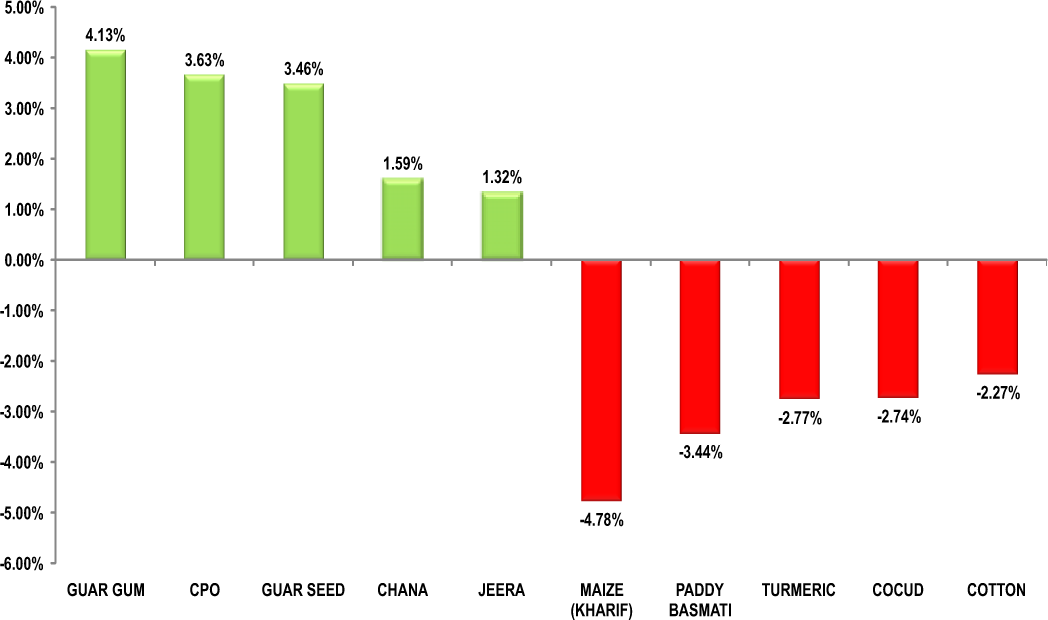
The correction phase of turmeric futures (Dec) would possibly take a pause & find support near 5750 levels. The spot markets are witnessing higher sales amid lower level buying. Turmeric Merchants Association Salesyard, finger turmeric was sold at Rs.5,669-7,101 a quintal and root variety at Rs.5,399- 6,399 at Erode. Finger turmeric was sold at Rs.6,049-7,219 and root variety at Rs.5,269-6,439 at the Regulated Marketing Committee. At the Erode Cooperative Marketing Society, finger turmeric was sold at Rs.6,109-6,989 and root variety at Rs.5,699-6,459. Jeera futures (Dec) may witness short covering towards 16700-16800, taking support near 16200 levels. This season the acreage in Gujarat is lagging due to late sowing. So far, acreage under jeera was at 243 ha in the 2019-20 (Oct-Sep) Rabi season, lower from 1,543 ha last year, according to the Gujarat farm department. Dhaniya futures (Dec) is likely to trade higher towards 7000-7100, giving respect to 6630 levels. At present, the seasonal domestic consumption is higher due to ongoing winter season. According to traders, the price of Eagle and Badami varieties is trading higher at the Ramganj and Baran markets in Rajasthan due to good buying. Cardamom futures (Dec) is expected to trade on a bullish note towards 3000 levels. The sentiments of the market participants at the auctions are strong and positive, and the availability of quality capsules is also receiving assured buyers. The North Indian buyers are participating actively along with subdealers catering to exporters demand. This upcountry demand, coupled with active participation of exporters, is pushing cardamom prices to higher levels at auctions conducted at Bodinayakanur. The average price realised was Rs.2,741.73 per kg, while a maximum price of Rs.3,002 per kg.
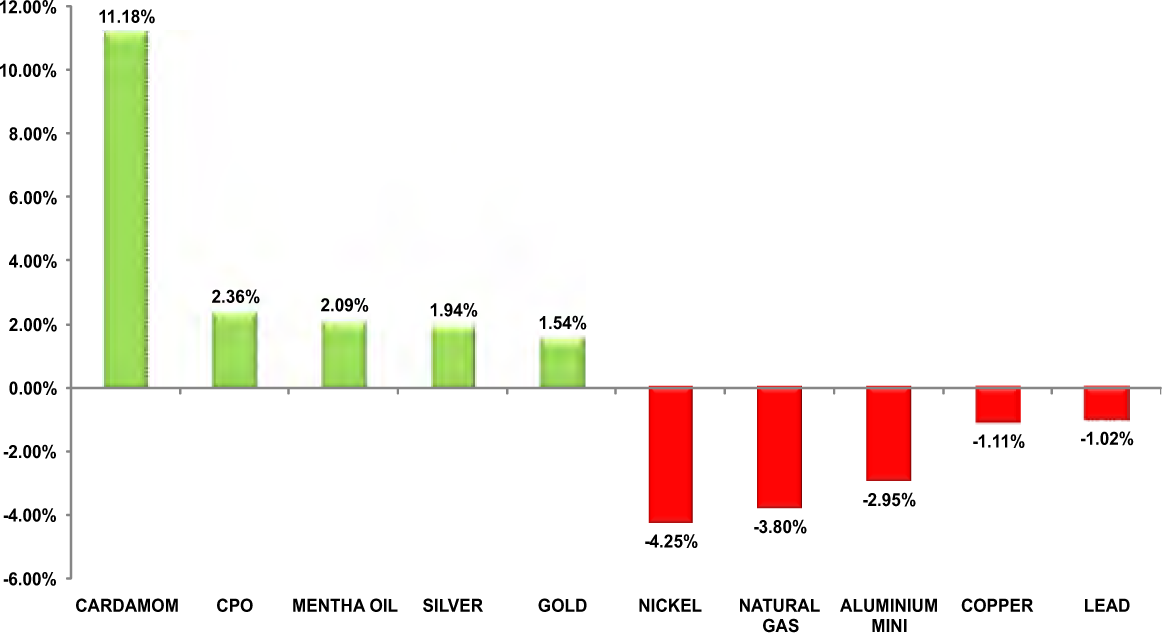
Bullion counter may witness lower level buying amid safe haven demand due to growing skepticism regarding US China trade deal. Global sentiment has been hit in recent weeks by conflicting assessments of progress in talks aimed at ending the two countries' trade spat. Gold prices have gained more than 14% this year on uncertainties over the months-long China-U.S. trade war, which has roiled financial markets and prompted fears of a global economic slowdown. Gold can recover towards 38600 levels while taking support near 37700 levels while silver can test 45500 levels while taking support near 43500 levels. Governor Powell also gave a positive outlook of the economy, but showed concerns of the effects of trade war on the economy. Trump threatened to jack up tariffs on Chinese goods if the countries fail to reach a trade deal, which could raise the price of cellphones, laptops, and toys less than two weeks before Christmas. There were hawkish signals from the U.S. Federal Reserve on further interest rate cuts, citing growth in the U.S. economy, a strong labour market and steady inflation. Meanwhile the political unrest in Hong Kong can also support gold, which is considered an alternative investment during times of geopolitical and financial uncertainty. So far this year, central banks have purchased 547.5 tonnes on a net basis, which is 12% higher year-over-year. Also, gold holdings grew by 258 tonnes in Q3, the highest level of quarterly inflows since Q1 2016, according to the WGC’s Q3 Gold Demand Trends report.
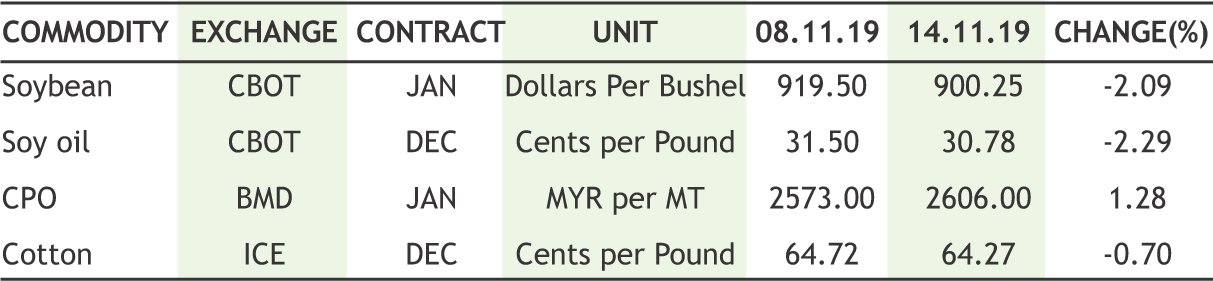
Soybean futures (Dec) is expected to consolidate in the range of 3900-4100 levels with upside getting capped. The increase in arrivals of fresh soybean crop, due to harvesting catching pace, is currently weighing on the sentiments. The new crop has started arriving from Rajasthan and Madhya Pradesh. The demand side is also being projected to be bleak as exports of soyabean meal are likely to drop by 10 lakh tonne in the new season due to low output and non-competitive prices in world market. The outlook of mustard futures (Dec) is bullish as it may trade higher to test 4320-4380 levels. The initial projections show that this season, there may not be drop in overall acreage of mustard but due to late rains in September and October, farmers are waiting for water to dry up from their fields in low-lying areas. This has delayed the sowing a bit and it is expected that farmers will complete mustard planting by mid-November. CPO futures (Nov) is expected to face resistance near 655 levels after posing a bull run for the past two months. The supply side is likely to get heavier after the news that Indian refiners have resumed buying Malaysian palm oil after a gap of nearly a month and contracted around 70,000 tonnes of shipments in December as Kuala Lumpur has been offering a $5 per tonne discount over supplies from rival Indonesia. Soy oil futures (Dec) is expected to trade sideways to up in the range of 792-805 levels. The latest statistic show that soybean oil import is stagnant at around 30.0 lakh tons, (except 2015-16), while demand is expected to increase due to increase consumption in winters.
Crude oil prices may continue to remain on sideways path as lower than estimated surplus by OPEC nations and hope of trade deal between US and China is supporting the prices but larger than expected buildup of inventories is capping the upside. Crude oil may face resistance near 4280 while taking support near 3900 levels. EIA reported build of 2.2Mbpd compared with expectations for a build of 1.65Mbpd Gasoline inventories rose by 1.9Mbpd while distillate saw drawdown of 2.5Mbpd. OPEC slightly revised down its estimates for non-OPEC oil supply growth by 36,000 bpd to 2.17Mbpd. The Organization of the Petroleum Exporting Countries (OPEC) and other producers including Russia grouping known as OPEC+ have been restraining production since January to try support oil prices. OPEC Secretary General Mohammad Barkindo stated that the global economic fundamentals remained strong and hopeful about trade deal between US and China. On the production side, U.S. shale production growth is already slowing in response to lower prices, and Saudi Arabia and its allies in OPEC+ are signalling current output restraints will be extended well into 2020. Natural gas can remain on volatile path on uncertain weather conditions in US. Prices can take support near 175 levels while facing resistance near 205 levels. The weather is expected to become warmer than normal over the next 6-10 and 8-14 days, but over the next 5-days weather over eastern portion of U.S. will remain cooler than normal sustaining gas heating demand. There are no expected disturbances in the Atlantic or Gulf of Mexico as the hurricane season officially ends at the end of November.
Cotton futures (Nov) will most probably find support near 18930 levels. In order to support prices, the Cotton Corporation of India (CCI) has begun procurement of the fibre in Maharashtra at minimum support price (MSP). CCI has so far begun procurement in Punjab, Rajasthan, Haryana and Gujarat, and now in Maharashtra, Telangana and Karnataka. Procurement in Odisha and Andhra Pradesh is yet to commence due to late crop. This season the supply side is heavier as the country is likely to produce 354.5 lakh bales in 2019-20, against the 312 lakh bales reported in 2018-19. The yearly balance-sheet estimates shows that the carryover stock estimated at the end of the season is 46 lakh bales. In the international market, ICE cotton futures is stuck in sideways zone as all eyes are anxiously awaiting an agreement to end the trade ware uncertainty that has slowed business investment around the globe. The latest news have highlighted that the United States and China are getting close to a trade agreement, White House economic adviser Larry Kudlow said, citing what he called very constructive talks with Beijing about ending a 16- month trade war. Chana futures (Dec) is expected to consolidate in the range of 4450-4570 levels. The upside may remain capped as millers are buying only to meet their immediate requirement for crushing. Mentha oil futures (Nov) is likely to rise for the third consecutive week towards 1340 levels, taking support near 1285 levels. Last week, the stocks at the MCX-accredited warehouses have reduced the highest by 77804 kgs in the past six consecutive weeks, which shows that the demand is on the higher side.
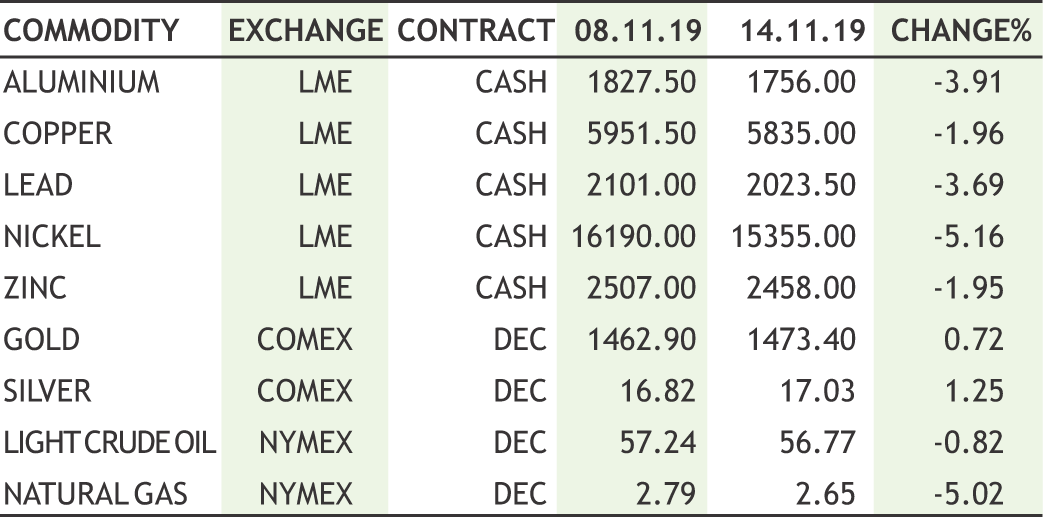
Base metal counter may trade with subdued path as weak manufacturing and investment data from China fuelled concerns about Chinese economy. China and the United States are holding “in-depth” discussions on a first phase trade agreement, and cancelling tariffs is an important condition to reaching a deal. Copper may trade sideways bias and it can take support near 435 levels and resistance near 450 levels. Copper inventories in LME-approved warehouses fell to a five-month low at 224,425 tonnes, while stocks in warehouses tracked by the Shanghai Futures Exchange have declined 44% since March to 148,687 tonnes. Meanwhile, lead may remain sideways as it can move in the range of 151-158 levels. Zinc may witness lower level buying and may test 200 levels while taking support near 185 levels. China’s monthly production of refined zinc hit a fresh record high October, as high margins encouraged smelters to step up operations. Nickel prices can move with weaker path and may dip lower towards 1100 levels while taking resistance near 1170 levels. Nickel prices might be pressurized as Indonesian government allowed nine companies to resume with their exports till the year end after they were halted on late October’19. Aluminium can further dip towards 128 levels while facing resistance near 134 levels. China’s aluminium production in October fell 0.7% from the previous month. China, churned out 2.88 million tonnes of the metal last month. That was slightly down from 2.9 million tonnes in September and down 1.8% from a year earlier. The January-October output for the group of 10 nonferrous metals rose 4.6% YoY at 48.15 million tonnes.
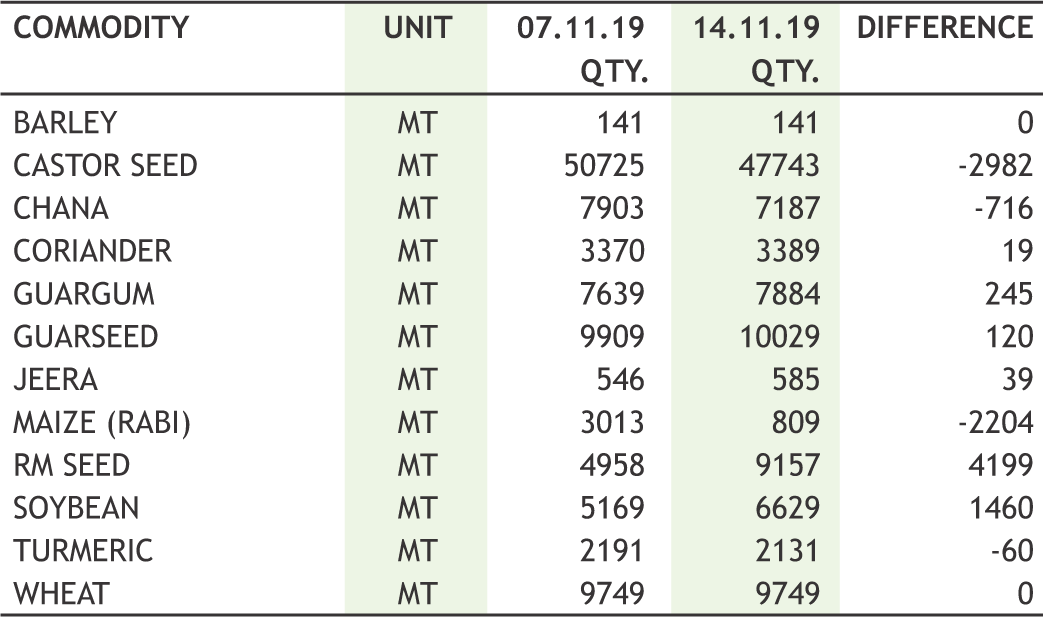
10
|
ZINC MCX (NOV) contract closed at Rs. 193.00 on 14th Nov’19. The contract made its high of Rs. 196.25 on 11th Nov’19 and a low of Rs. 181.25 on 03rd Oct’19. . The 18-day Exponential Moving Average of the commodity is currently at Rs. 191.67. On the daily chart, the commodity has Relative Strength Index (14-day) value of 58.319.
One can buy between Rs. 188-190 for a target of Rs. 200 with the stop loss of Rs. 184.
SILVER MCX (DEC) contract closed at Rs. 44723.00 on 14th Nov’19. The contract made its high of Rs. 51489.00 on 4th Sep’19 and a low of Rs. 38200 on 14th Jun’19. The 18-day Exponential Moving Average of the commodity is currently at Rs. 45020. On the daily chart, the commodity has Relative Strength Index (14-day) value of 40.876.
One can sell near Rs. 45100 for a target of Rs. 42500 with the stop loss of Rs. 46100.

CPO MCX (DEC) contract was closed at Rs. 650.40 on 14th Nov’19. The contract made its high of Rs. 656.40 on 13th Nov’19 and a low of Rs. 544.00 on 10th Oct’19. The 18-day Exponential Moving Average of the commodity is currently at Rs. 618.24. On the daily chart, the commodity has Relative Strength Index (14-day) value of 87.289.
One can sell at Rs. 650 for a target of Rs. 620 with the stop loss of Rs 665.
11
• OPEC expected demand for its oil to fall in 2020 as rivals pumped more despite a smaller surplus of crude in the global market.
• Growth in demand for fuel in India is on course to fall to its lowest in at least six years as the economy slows.
• China world's top steel-making country produced 81.52 million tonnes of crude steel in October, down from both 82.77 million tonnes in September.
• LME would take an extra six months to make its telephone trades compliant with transparency requirements set by European regulators.
• Chile's Codelco, the world's top copper producer, boosted output by 7.5% in September to 145,300 tonnes.
• The SEBI has decided to give more flexibility to exchanges regarding modifying contract specifications for all commodity derivatives contracts. Changes that exchanges can make include margins, launch date, among others.
• The mock trading of NCDEX AGRIDEX index will be held on Saturday, November 16, 2019. It will be made tradable after being approved from the SEBI.
• Import of vegetable oils during Oil Year 2018-19 (Nov.’18 to Oct.’19) i.e. edible oil and non-edible oil is reported at 155.50 lakh tons (15.55 Mn. T) compared to 150.26 lakh tons (15.02 Mn. T) for the same period of last year i.e. up by 3.5%. - Solvent Extractors' Association of India
• Malaysia struck key palm oil partnership deals with two major supply chain managers in the United Arab Emirates (UAE) and China to facilitate greater palm oil penetration in China, India and the Indian sub-continent.
• Energy-markets giant Intercontinental Exchange Inc., or ICE, will team up with Abu Dhabi’s state oil producer and some of the world’s biggest oil companies to launch a new futures exchange in the emirates.
It was an average week for commodities where we saw limited move in the prices. CRB saw marginal gain; closed near 190 levels. Bullion saw some bounce back after a sharp fall of last week. Gold prices continued a gradual recovery after weak economic data around the world reassured market participants that the trend toward easier global monetary conditions is still intact. Silver followed the positive move of gold and ignored the bearish base metals. Japan, China, Australia and the U.K. all reported economic data of one sort or another that was below expectations. In China, retail sales growth was the weakest in 20 years while fixed asset investment grew at the slowest rate since the country started publishing that data series. Base metals felt the pinch of weaker data and most of them closed in negative territory. Oil prices settled slightly lower after U.S. oil inventories rose more than expected. That was coupled with a decline in equities, which hurt bullishness. The Energy Information Administration said U.S. crude inventories rose by 2.2 million barrels for the week ended Nov. 8, compared with expectations for a build of 1.65 million barrels. Once again, U.S. oil production for the week came in at a record of 12.8 million barrels per day. Natural gas also moved down. Dry natural gas production in the United States will rise to an all-time high of 92.10 billion cubic feet per day (Bcf/d) in 2019, the EIA reported on Wednesday. That figure is up 10% from 2018. Nickel, which is the best performer in metals pack year-to-date (YTD), has declined more than 15% from a multimonth high of $18,850 early September. Jump in stockpiles at SHFE along with signs of easing tightness in the physical market amid trade war tension weighed down the sentiments.
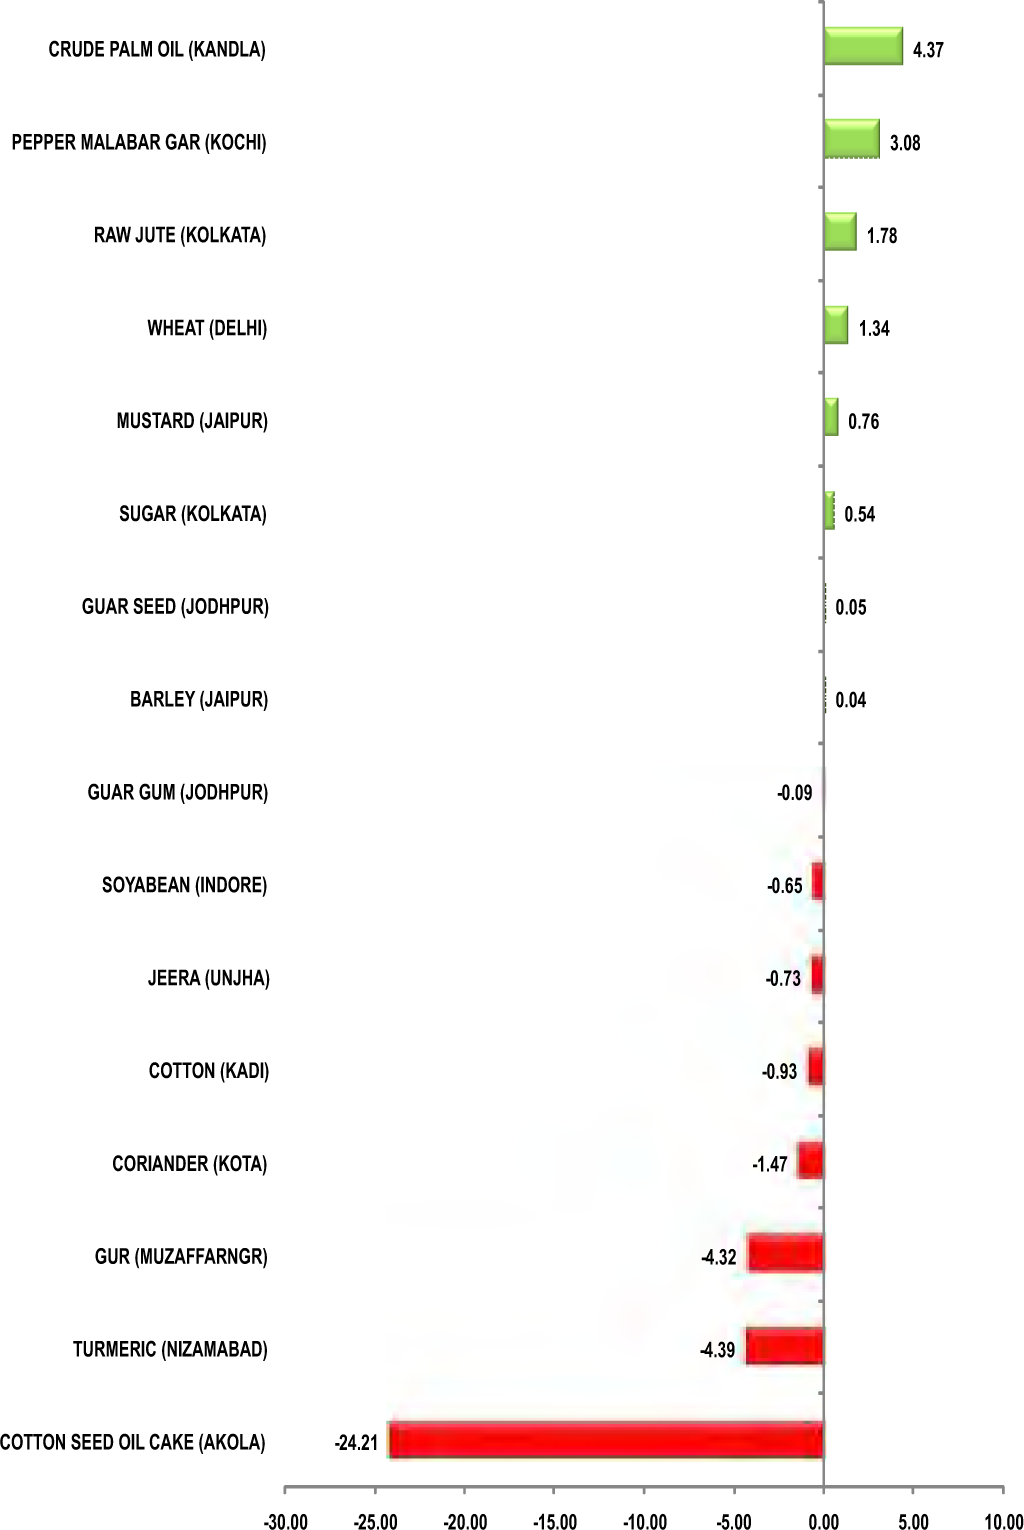
In agri, cotton futures managed to see some gain as cotton prices ruled steady in Gujarat, Maharashtra and Andhra Pradesh. Chana prices strengthened despite the news that Nafed planning to sell procured stock around 10 lakh tonnes state wise in next three month. Menthe futures prices propped up on plunging stocks at the MCX-accredited warehouses since past five consecutive weeks. Spices futures were mostly weak, except jeera. Turmeric futures were weaker demand remained lacklustre in the market as quality of spice that is being supplied reported inferior. Dhaniya traded in a range. Unfavourable weather conditions in the major growing areas have led to delays in sowing for the new season by around 10-15 days. International soyabean prices firmed. The world's two largest economies are trying to finalise a limited deal that focuses largely on increased Chinese purchases of American farm products and the opening of China's financial services market.
|

|
12

|
|
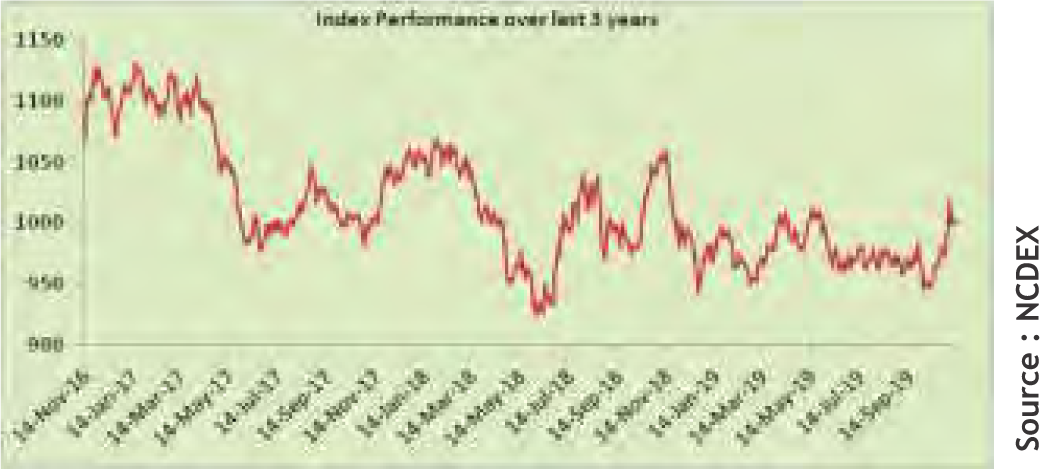
NCDEX has launched the “ AGRIDEX INDEX” with effect from, November 11, 2019. NCDEX AGRIDEX is India’s first return based agricultural futures Index which tracks the performance of the ten liquid commodities traded on NCDEX platform. The index represents the basket of ten commodities which are selected based on the liquidity on exchange platform. The NCDEX AGRIDEX serves as a benchmark and one can replicate the performance of the underlying commodities. These underlying commodities contracts are mostly deliverable, settled on spot prices, have circuits governing daily price limits and also restrict size of participation using position limits at client and member level. Strong surveillance exists both at the exchange and the regulator to prevent any abnormal trading behavior in these commodities. The index therefore will be a robust indicator of the broader market.
AGRIDEX Components for FY 2019-20
The following chart summarized the components of the index with their weightages for the period April 01, 2019 to March 31, 2020. A cap of 20% and floor of 3% is enforced onto the individual Commodity Index Percentage. The cap ensures that no single Commodity dominates the index performance. The floor ensures that each commodity, however small, has a meaningful contribution to the Index.
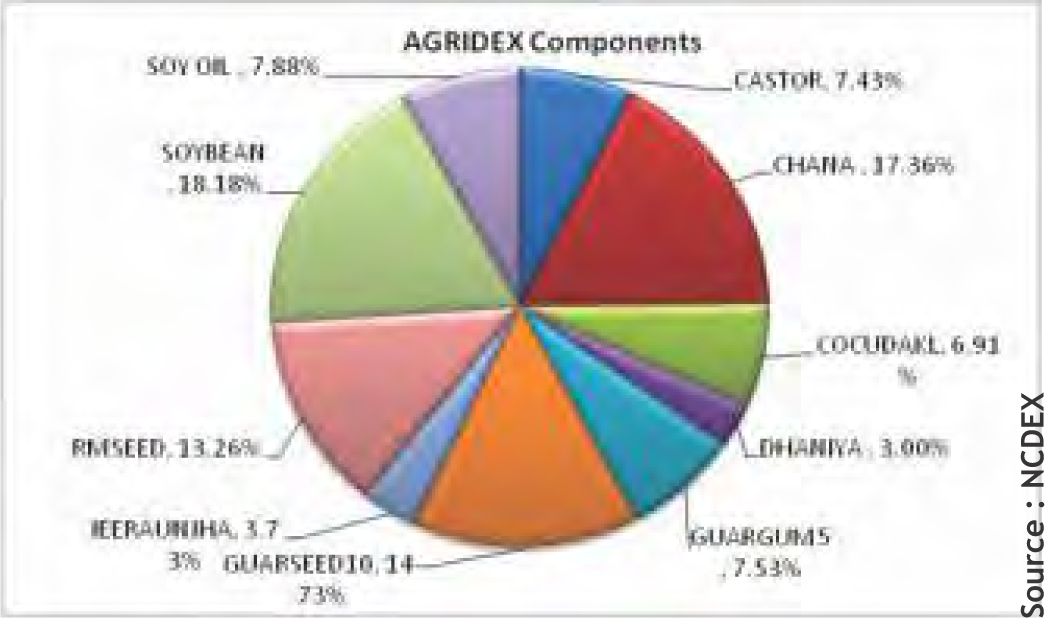
Some highlights of the Index:
• Commodities are selected based on the liquidity on exchange platform.
• 50-50% weights are assigned based on national production (average of last five financial years ) & traded value (last calendar year) on exchange respectively.
• Both upstream & downstream commodities are considered.
• Rebalanced annually on 1st April. Reselection of commodities & reassignment of weights is done based on the criterion.
• Rollover is done on first 3 days of expiry month.
• To ensure diversification, no related group of commodities (sectors) may constitute more than 40% of the weightage in the index.
13

|
| 11th NOV | India’s Industrial production shrinks 4.3%, lowest in almost 8 years. |
| 13th NOV | India’s retail inflation at 16-month high of 4.62%, breaches RBI target in October |
| 13th NOV | Fed Chair Powell won’t support interest rate cuts in December. |
| 14th NOV | India world’s most open, investment friendly economy – PM Modi at BRICS. |
| 14th NOV | Moody’s cuts India’s GDP growth forecast to 5.6% for 2019-20. |
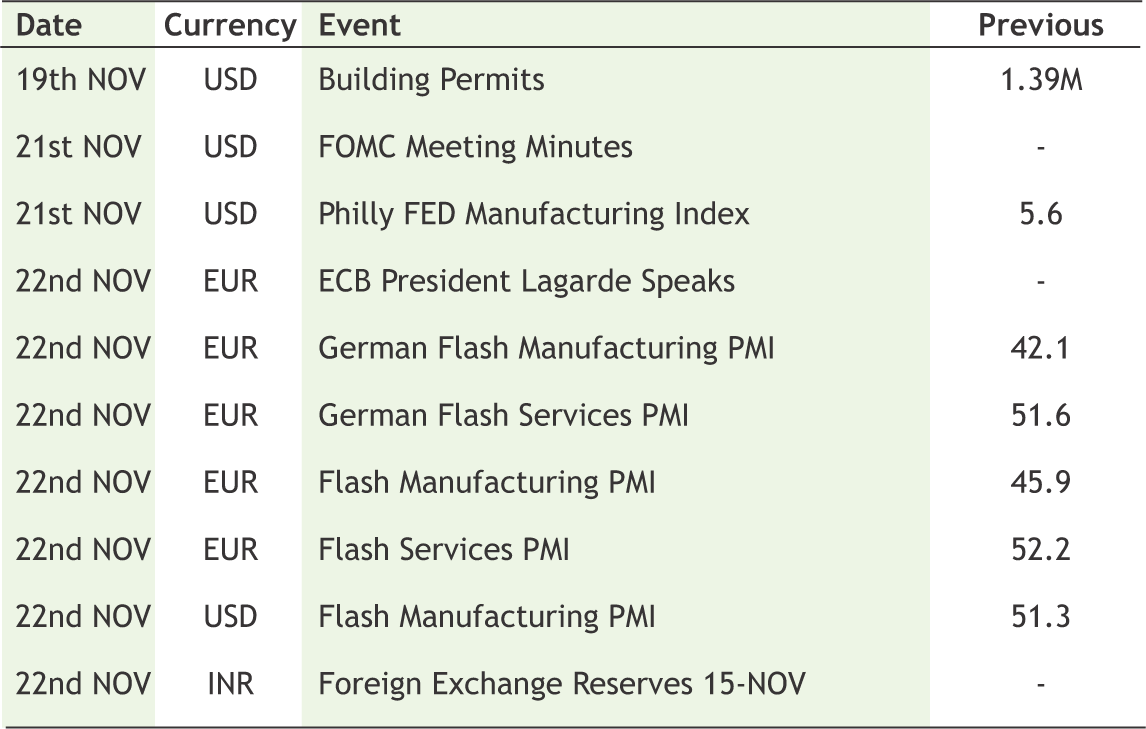
Indian rupee was hit by yet another stormy week after India faced a credit downgrade rating from Moody's Investors Service. Additionally they have casted doubts over sustainable real GDP growth of 8% which has significantly diminished now than two years ago. Expectations of further contraction in growth output club with seasonal inflationary pressures pushed greenback in strong grip over domestic currency. The latest headline inflation posted yesterday for the month of October quickened to one and half year high of 4.62% exceeding beyond RBI's upper bound of inflation target. Food inflation was the major driver climbing up to 7.89% in October versus 5.11% in September. What's more the seasonal uptrend in food inflation likely to continue, although Food Ministry is intervening to curb the rise in prices especially in onion. Early indicators - IIP indicates a substantial drag in GDP quarter ended in September which brought RBI indecisive for further easing in repo rate in December. Globally UK 3Q GDP contacted the most in nine years. Although Sterling holds the present upside levels amid optimism that Boris Johnson may get the majority to form the government and softer brexit stance will be adopted. Next week centre of attraction will be FOMC meeting minutes of its latest monetary policy. Jay Powell already cleared his modest hawkish stance in his latest congressional testimony which will be positive for dollar if the minutes turned out to be hawkish than expected.
USDINR is likely to stay within the range of 71.35 and 72 in the next week.
|
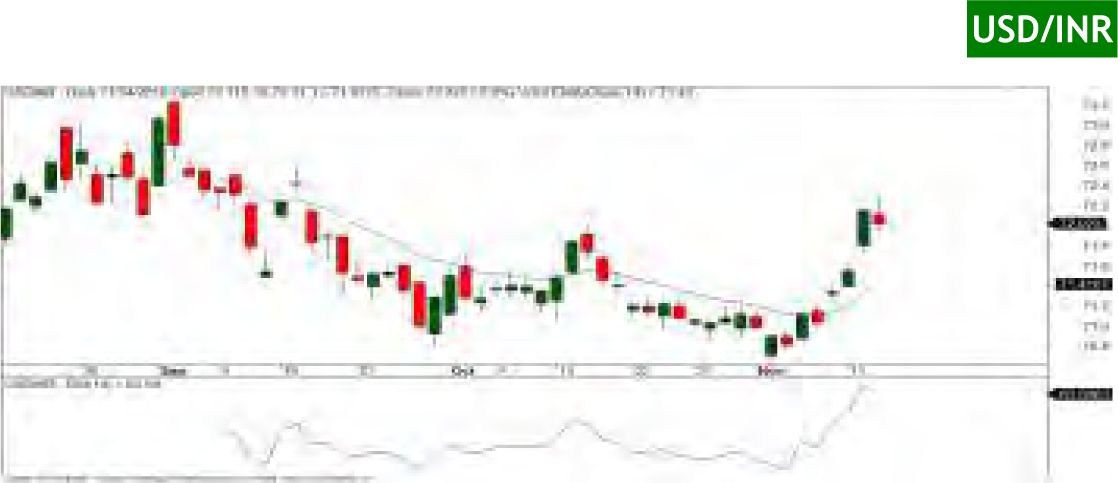
USD/INR (NOV) contract closed at 72.0250 on 14th Nov’19. The contract made its high of 72.31 on 14th Nov’19 and a low of 71.3850 on 11th Nov’19 (Weekly Basis). The 14-day Exponential Moving Average of the USD/INR is currently at 71.41.
On the daily chart, the USD/INR has Relative Strength Index (14-day) value of 63.58. One can sell at 71.95 for the target of 71.35 with the stop loss of 72.25.

EUR/INR (NOV) contract closed at 79.2375 on 14th Nov’19. The contract made its high of 79.62 on 14th Nov’19 and a low of 78.80 on 11th Nov’19 (Weekly Basis). The 14-day Exponential Moving Average of the EUR/INR is currently at 79.13.
On the daily chart, EUR/INR has Relative Strength Index (14-day) value of 51.13. One can sell at 79.50 for a target of 78.90 with the stop loss of 79.80.
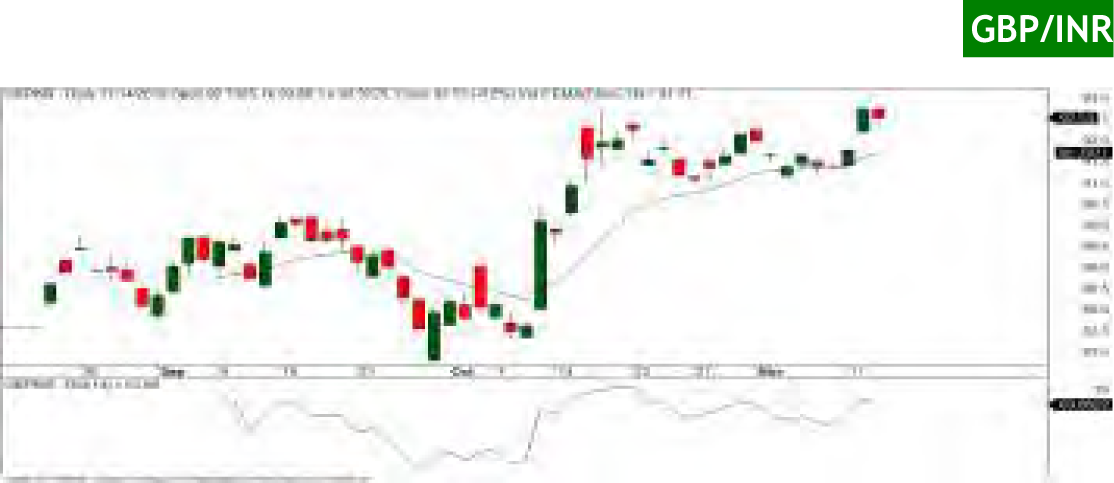
GBP/INR (NOV) contract closed at 92.53 on 14th Nov’19. The contract made its high of 92.86 on 14th Nov’19 and a low of 91.33 on 11th Nov’19 (Weekly Basis). The 14-day Exponential Moving Average of the GBP/INR is currently at 91.70.
On the daily chart, GBP/INR has Relative Strength Index (14-day) value of 63.86. One can buy at 92.30 for a target of 92.90 with the stop loss of 92.

JPY/INR (NOV) contract closed at 66.3350 on 14th Nov’19. The contract made its high of 66.5250 on 14th Nov’19 and a low of 65.47 on 11th Nov’19 (Weekly Basis). The 14-day Exponential Moving Average of the JPY/INR is currently at 65.74.
On the daily chart, JPY/INR has Relative Strength Index (14-day) value of 56.66. One can sell at 66.25 for a target of 65.65 with the stop loss of 66.55.
14
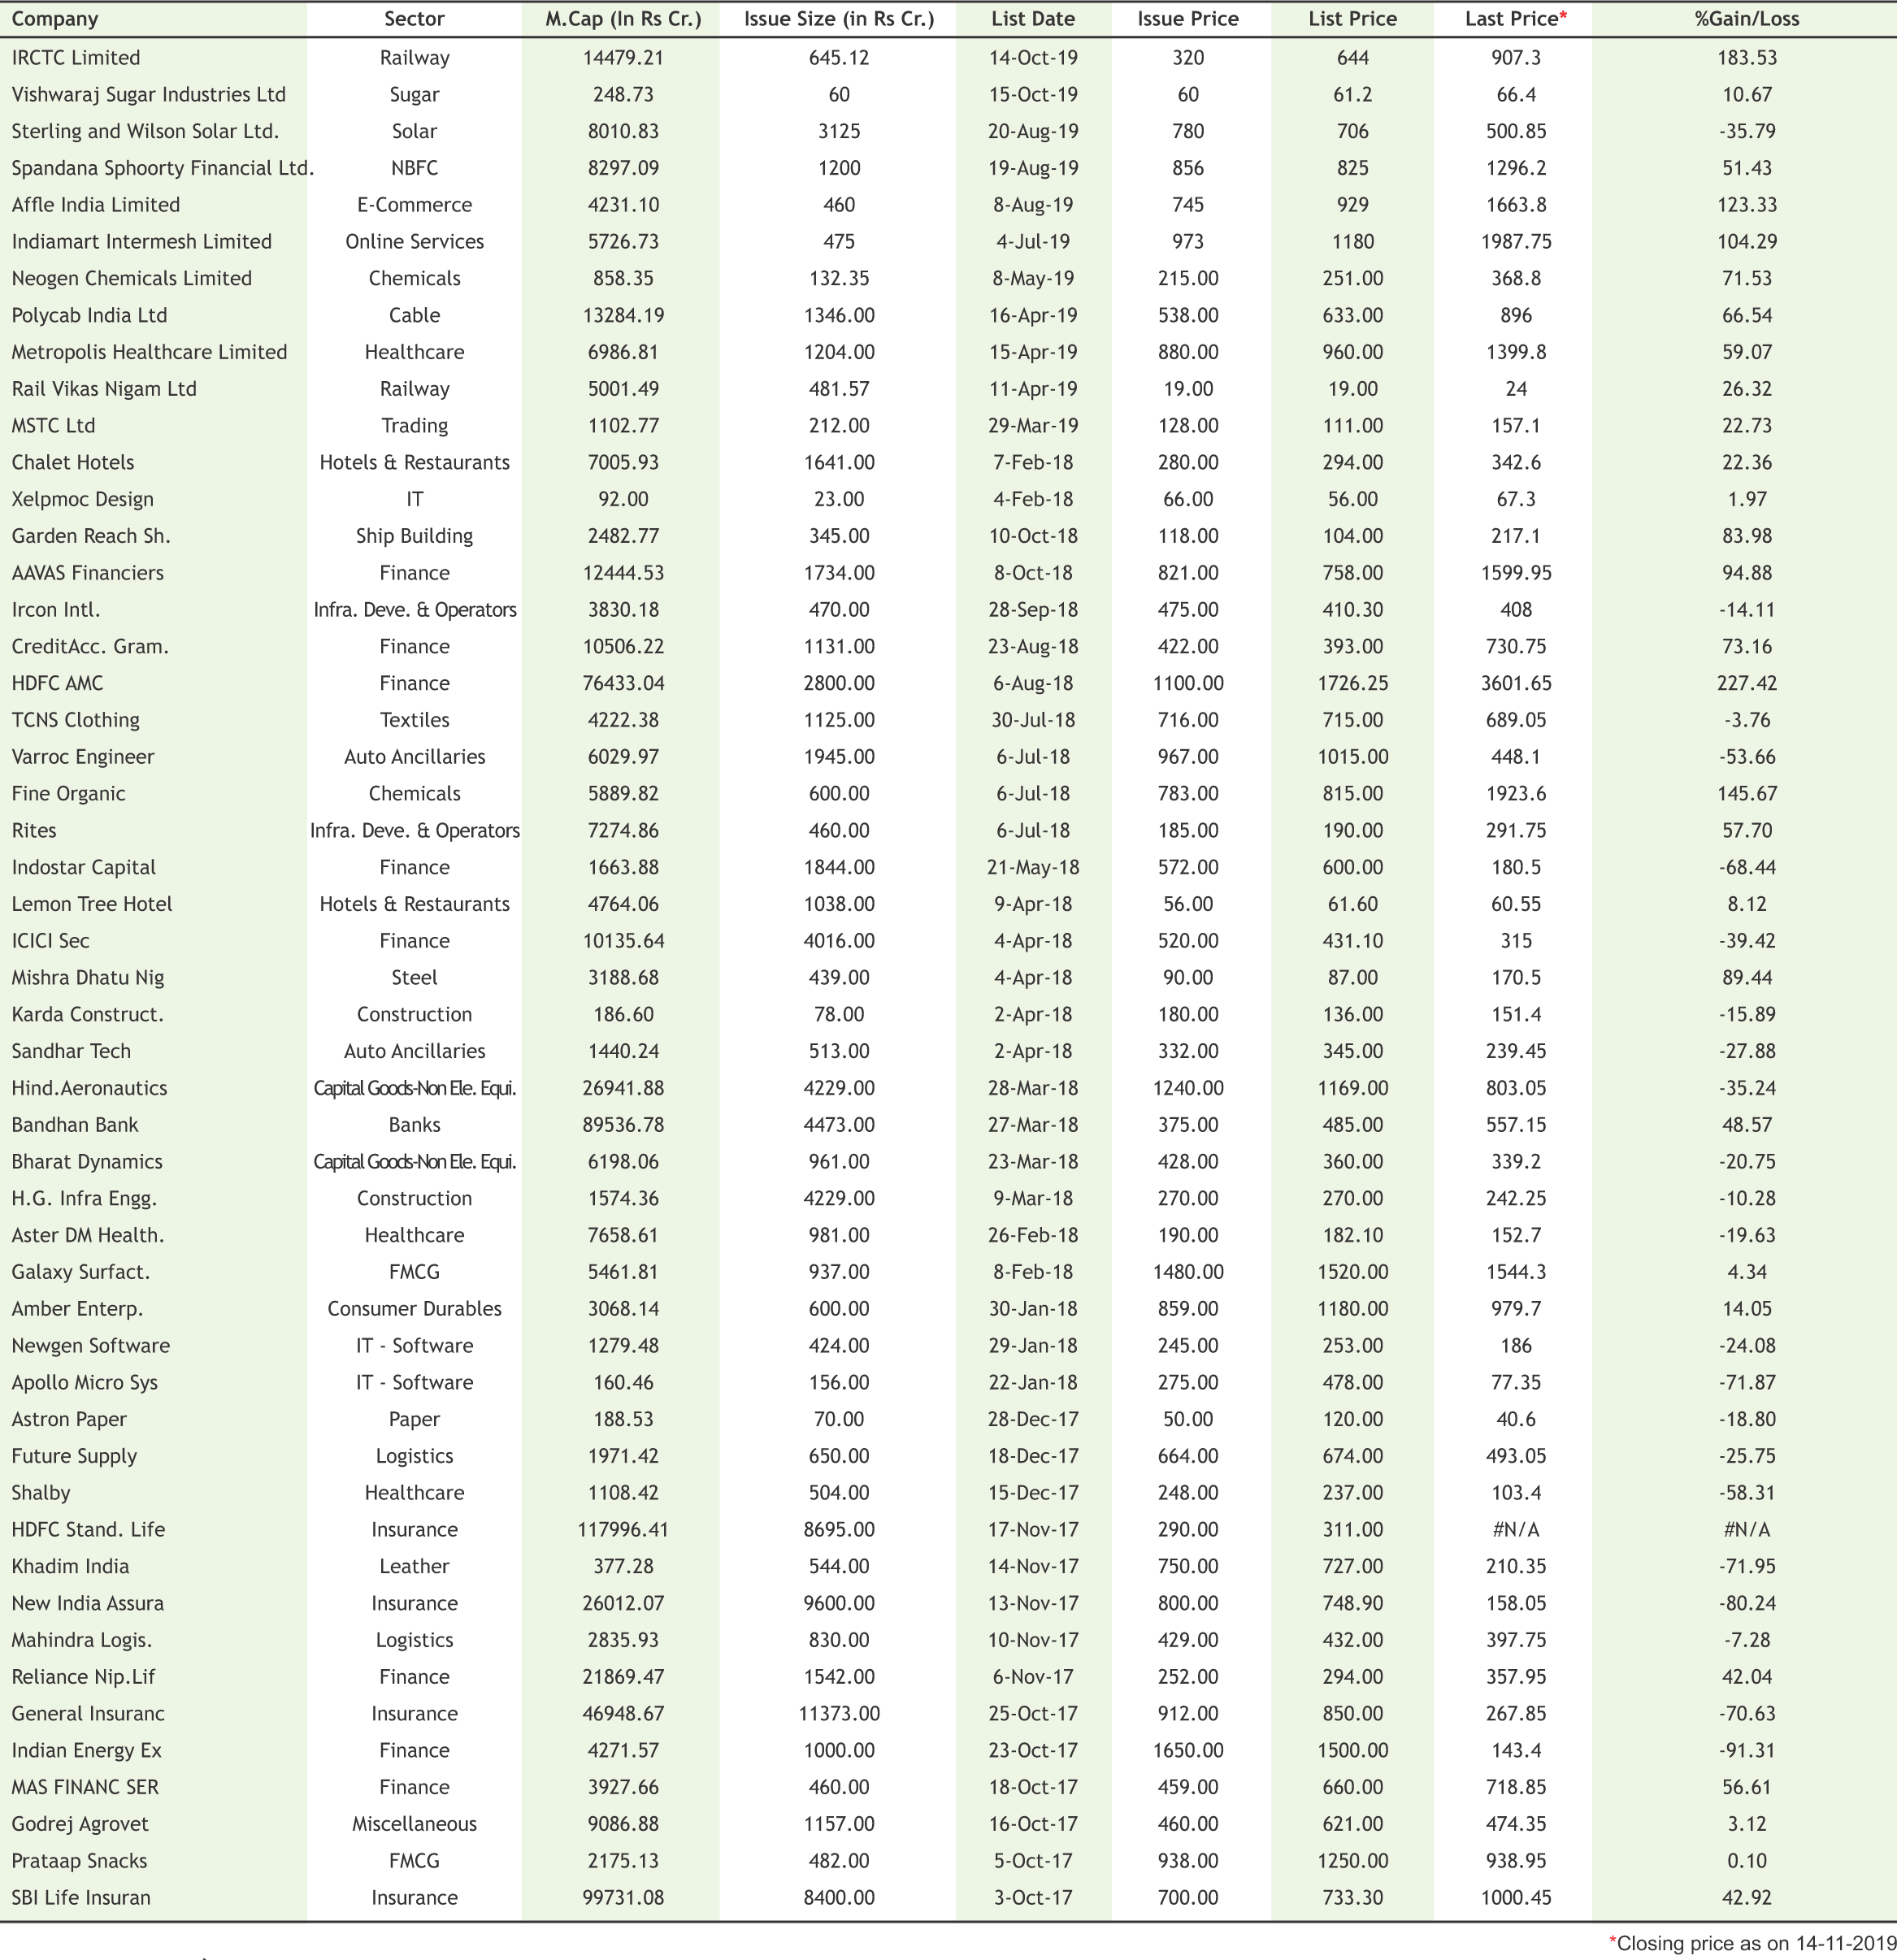
Medplus plans to raise Rs 700 crore via IPO
Pharmacy retail chain Medplus is planning an initial public offering (IPO) aimed at raising about 700 crore The city-based retail chain currently operates 1,700 outlets across seven states and hopes to take the number to 3,100 by 2023 pan India barring Jammu and Kashmir, Northeast and parts of UP. The promoters hold 77 per cent and Wipro Chairman Azim Premji's Premji Invest holds 13 per cent while the rest is held by others.
|
15

|
* Interest Rate may be revised by company from time to time. Please confirm Interest rates before submitting the application.
* For Application of Rs.50 Lac & above, Contact to Head Office.
* Email us at fd@smcindiaonline.com

16
Equity mutual fund inflows hits 5-month low in October
Equity mutual funds witnessed a net inflow of Rs 6,015 crore in October, the lowest in the last five months, amid rally in stock market following a series of reform measures taken by the government. According to data by the Association of Mutual Funds in India (Amfi), open-ended equity schemes witnessed an infusion of Rs 6,026 crore, while there was a small outflow of Rs 11 crore from close-ended equity plans, translating into a net inflow of Rs 6,015 crore in October. In comparison, net inflows in equity and equity-linked saving schemes stood at Rs 6,489 crore in September. Such inflows stood at Rs 9,090 crore in August, Rs 8,092 crore in July, Rs 7,585 crore in June and Rs 4,968 crore in May.
Mutual fund AUM rises 7.4% to Rs 26.33 lakh crore in October
Mutual funds' asset base increased to Rs 26.33 lakh crore in October-end, a rise of 7.4 percent as compared with the preceding month, on the back of robust inflows in equity and liquid schemes. The 44-player industry logged an assets under management (AUM) of Rs 24.5 lakh crore in Septemberend, according to data from the Association of Mutual Funds in India (Amfi). Mutual fund houses witnessed an overall inflow of Rs 1.33 lakh crore last month after witnessing a redemption of Rs 1.52 lakh crore in September. Of these, liquid funds alone witnessed an impressive over Rs 93,200 crore last month.
AMFI reports outflow of Rs. 3,020 crore in Fixed Term Plans
According to the monthly data released by Association of Mutual Funds in India, Fixed Term Plans accounted for Rs. 382.39 crore in outflows in Oct 2019 compared with Rs. 3,019.78 crore in the prior month. The category saw fresh purchases of Rs. 173.94 crore in Oct relative to Rs. 92.41 crore in the prior month. The net assets under management for FTP stood at Rs. 1.38 lakh crore.
Franklin Templeton Mutual Fund announced change in benchmark of multiple funds
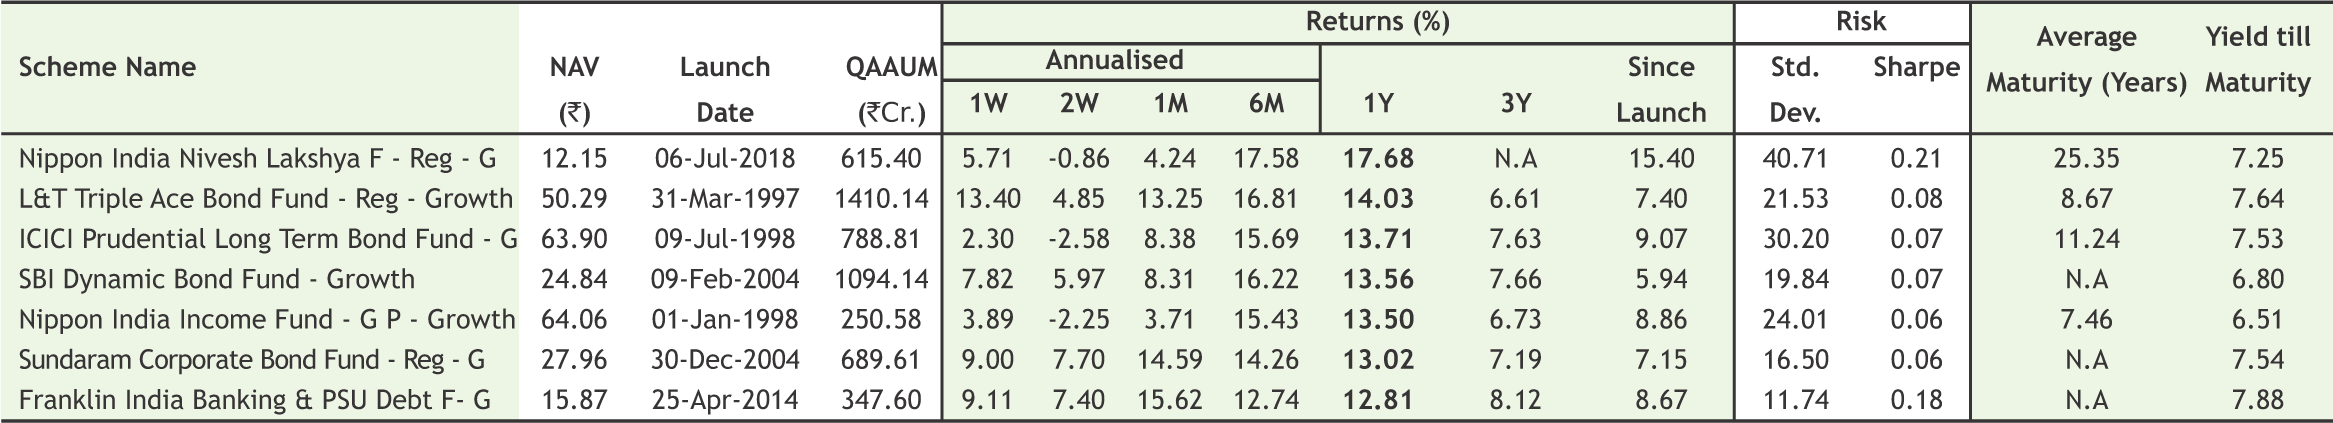
Franklin Templeton Mutual Fund announced change in benchmark of multiple funds including Franklin India Banking & PSU Debt Fund, Franklin India Corporate Debt Fund, Franklin India Credit Risk Fund, Franklin India Income Opportunities Fund to NIFTY Banking & PSU Debt Index, NIFTY Corporate Bond Index, NIFTY Credit Risk Bond Index and NIFTY Medium Duration Debt Index, respectively, effective Nov 15, 2019.
17

|
|
|
|
|
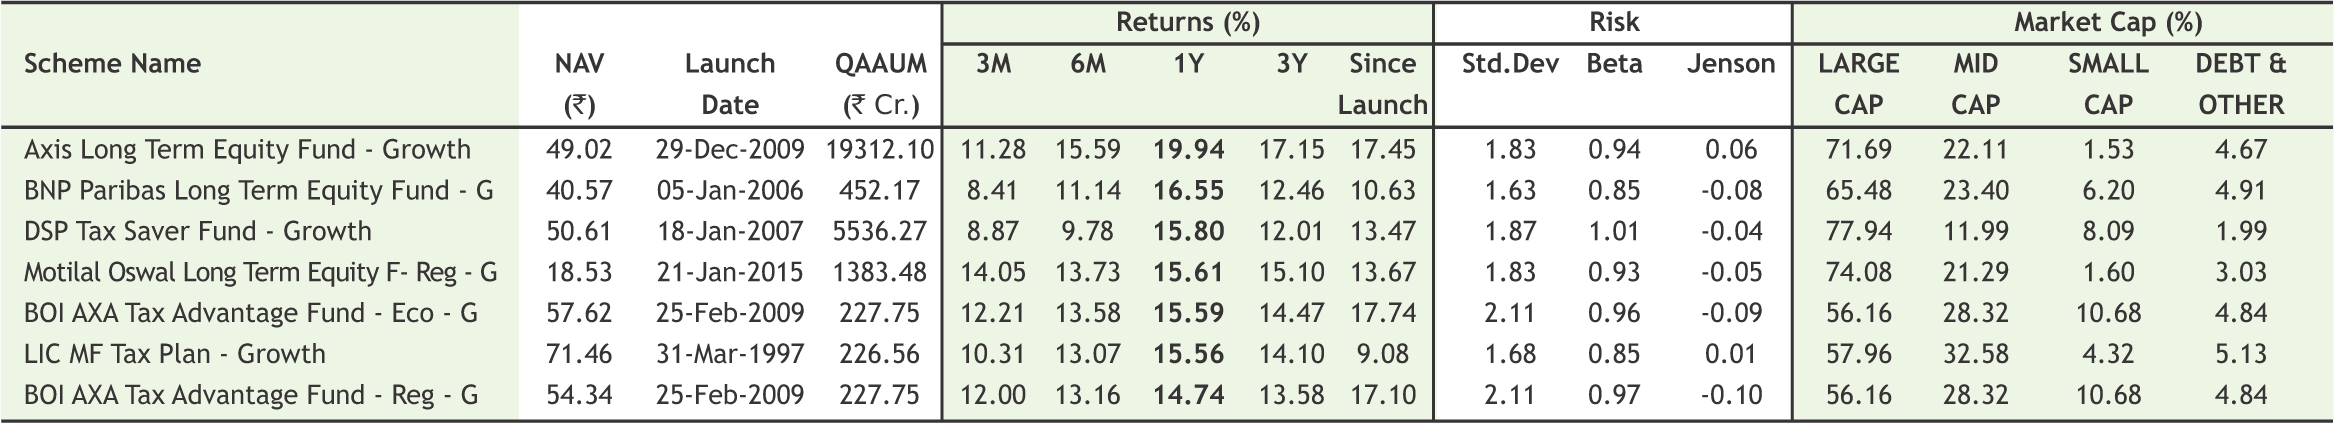
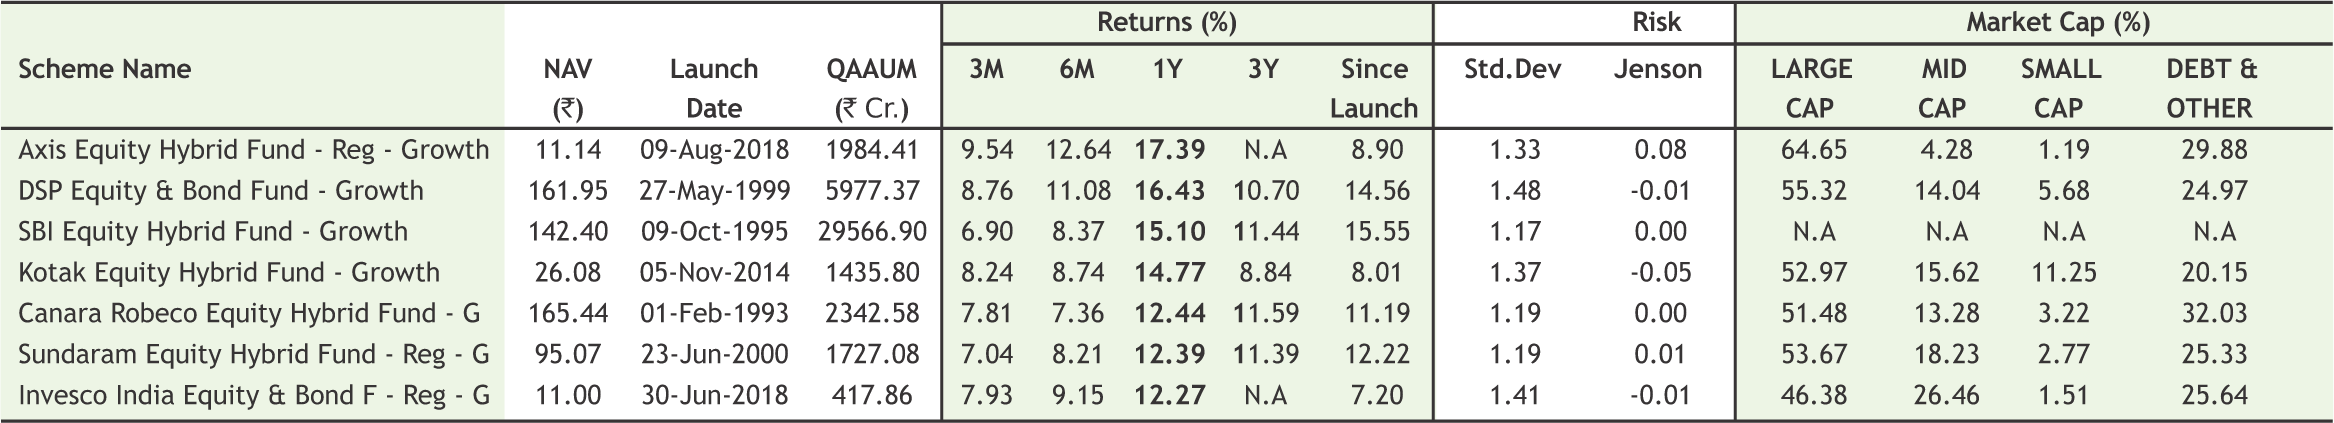
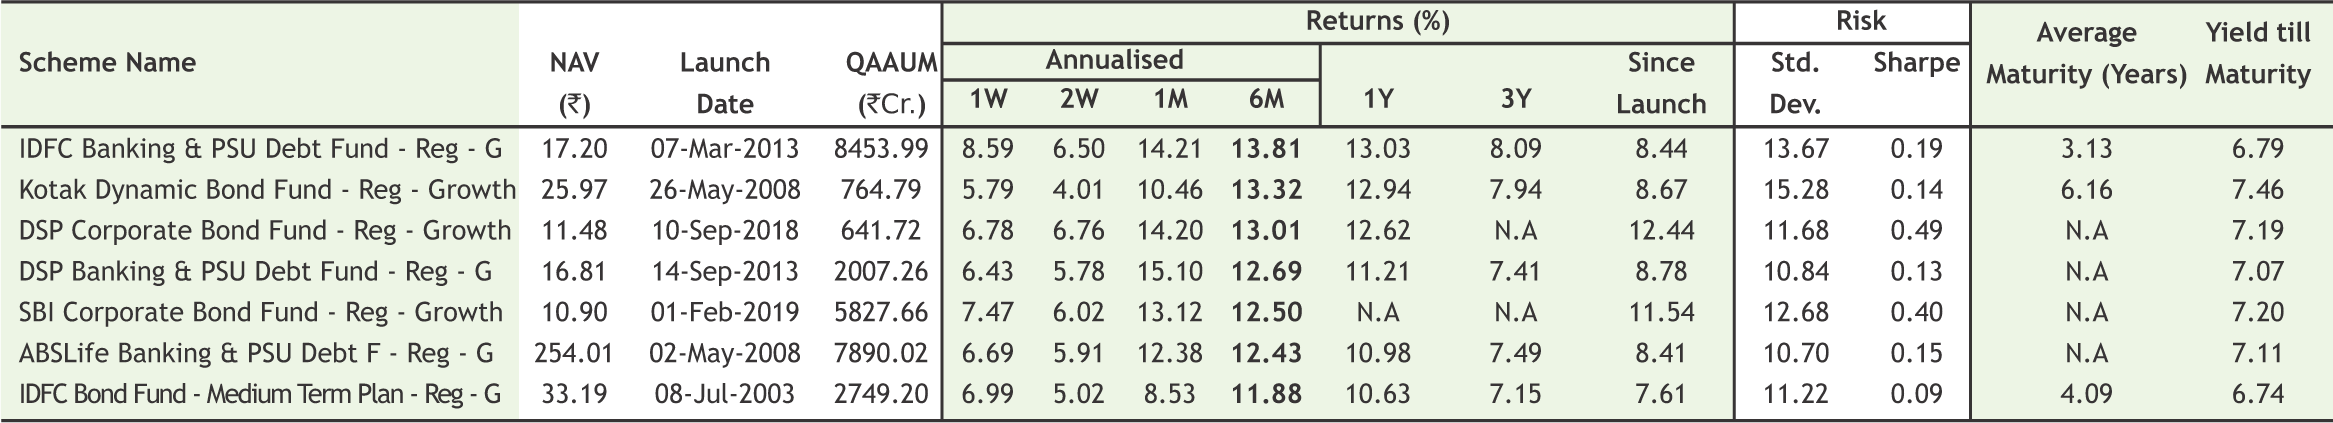
Note:Indicative corpus are including Growth & Dividend option . The above mentioned data is on the basis of 08/08/2019 Beta, Sharpe and Standard Deviation are calculated on the basis of period: 1 year, frequency: Weekly Friday, RF: 7%
*Mutual Fund investments are subject to market risks, read all scheme related documents carefully
18
SMC Global has been awarded as the 'Regional Retail Member of the Year (North)’ for Equities and Commodities at NSE Market Achiever’s Awards'19 held in Mumbai. Dr. D. K. Aggarwal (CMD, SMC Investments & President, PHDCCI) & Mr. Anurag Bansal (Director, SMC Global) receiving award from Mr. Vikram Limaye, MD & CEO, NSE.
Dr. D. K. Aggarwal (CMD, SMC Investments & President, PHDCCI) along with Mr. Rajnath Singh, Hon’ble Union Minister of Defence during 22nd India International Security Expo 2019 held on 10th October, 2019 at Pragati Maidan, New Delhi.


![]() Customized Plans
Customized Plans
![]() Comprehensive Investment Solutions
Comprehensive Investment Solutions
![]() Long-term Focus
Long-term Focus
![]() Independent & Objective Advise
Independent & Objective Advise
![]() Financial Planning
Financial Planning
Call Toll-Free 180011 0909
Visit www.smcindiaonline.com
REGISTERED OFFICES:
11 / 6B, Shanti Chamber, Pusa Road, New Delhi 110005. Tel: 91-11-30111000, Fax: 91-11-25754365
MUMBAI OFFICE:
Lotus Corporate Park, A Wing 401 / 402 , 4th Floor , Graham Firth Steel Compound, Off Western Express Highway, Jay Coach Signal, Goreagon (East) Mumbai - 400063
Tel: 91-22-67341600, Fax: 91-22-67341697
KOLKATA OFFICE:
18, Rabindra Sarani, Poddar Court, Gate No-4,5th Floor, Kolkata-700001 Tel.: 033 6612 7000/033 4058 7000, Fax: 033 6612 7004/033 4058 7004
AHMEDABAD OFFICE :
10/A, 4th Floor, Kalapurnam Building, Near Municipal Market, C G Road, Ahmedabad-380009, Gujarat
Tel : 91-79-26424801 - 05, 40049801 - 03
CHENNAI OFFICE:
Salzburg Square, Flat No.1, III rd Floor, Door No.107, Harrington Road, Chetpet, Chennai - 600031.
Tel: 044-39109100, Fax -044- 39109111
SECUNDERABAD OFFICE:
315, 4th Floor Above CMR Exclusive, BhuvanaTower, S D Road, Secunderabad, Telangana-500003
Tel : 040-30031007/8/9
DUBAI OFFICE:
2404, 1 Lake Plaza Tower, Cluster T, Jumeriah Lake Towers, PO Box 117210, Dubai, UAE
Tel: 97145139780 Fax : 97145139781
Email ID : pankaj@smccomex.com
smcdmcc@gmail.com
Printed and Published on behalf of
Mr. Saurabh Jain @ Publication Address
11/6B, Shanti Chamber, Pusa Road, New Delhi-110005
Website: www.smcindiaonline.com
Investor Grievance : igc@smcindiaonline.com
Printed at: S&S MARKETING
102, Mahavirji Complex LSC-3, Rishabh Vihar, New Delhi - 110092 (India) Ph.: +91-11- 43035012, 43035014, Email: ss@sandsmarketing.in